
 ?Mathematical formulae have been encoded as MathML and are displayed in this HTML version using MathJax in order to improve their display. Uncheck the box to turn MathJax off. This feature requires Javascript. Click on a formula to zoom.
Abstract
High viscosity of monoclonal antibody formulations at concentrations ≥100 mg/mL can impede their development as products suitable for subcutaneous delivery. The effects of hydrophobic and electrostatic intermolecular interactions on the solution behavior of MAB 1, which becomes unacceptably viscous at high concentrations, was studied by testing 5 single point mutants. The mutations were designed to reduce viscosity by disrupting either an aggregation prone region (APR), which also participates in 2 hydrophobic surface patches, or a negatively charged surface patch in the variable region. The disruption of an APR that lies at the interface of light and heavy chain variable domains, VH and VL, via L45K mutation destabilized MAB 1 and abolished antigen binding. However, mutation at the preceding residue (V44K), which also lies in the same APR, increased apparent solubility and reduced viscosity of MAB 1 without sacrificing antigen binding or thermal stability. Neutralizing the negatively charged surface patch (E59Y) also increased apparent solubility and reduced viscosity of MAB 1, but charge reversal at the same position (E59K/R) caused destabilization, decreased solubility and led to difficulties in sample manipulation that precluded their viscosity measurements at high concentrations. Both V44K and E59Y mutations showed similar increase in apparent solubility. However, the viscosity profile of E59Y was considerably better than that of the V44K, providing evidence that inter-molecular interactions in MAB 1 are electrostatically driven. In conclusion, neutralizing negatively charged surface patches may be more beneficial toward reducing viscosity of highly concentrated antibody solutions than charge reversal or aggregation prone motif disruption.
Abbreviations
| mAb | = | monoclonal antibody |
| VH | = | variable domain in the heavy chain |
| VL | = | variable domain in the light chain |
| Fv | = | fragment variable |
| Fab | = | fragment antigen binding |
| Fc | = | fragment crystallizable |
| CH2 | = | second constant domain in the heavy chain |
| CH3 | = | third constant domain in heavy chain |
| HC | = | heavy chain |
| LC | = | light chain |
| IgG | = | immunoglobulin G |
| cP | = | centipoise |
| η | = | solution viscosity |
| η0 | = | solvent viscosity |
| ηrel | = | relative viscosity |
| DLS | = | Dynamic Light Scattering |
| kD | = | protein-protein interaction parameter |
| CHO | = | Chinese Hamster Ovary |
| PEG | = | polyethylene glycol |
| ELISA | = | Enzyme-Linked Immunosorbent Assay |
| SE-HPLC | = | Size Exclusion High Performance Liquid Chromatography |
| Tm | = | thermal transition temperature |
| APR | = | Aggregation Prone Region |
| NTU | = | Nephelometric Turbidity Unit |
| ASA | = | Accessible Surface Area |
| ASAFv-HYD | = | hydrophobic accessible surface area of the Fv portion |
| ASAFv-HPH | = | hydrophilic accessible surface area of the Fv portion |
| ZFv | = | net charge of the Fv |
| ZFv-app | = | apparent charge of the Fv |
| ξFv | = | zeta-potential of the Fv |
| DFv | = | dipole moment of Fv |
| ΔGFv | = | change in Free energy of Fv |
| D0 | = | diffusion coefficient at infinite dilution |
| MD | = | molecular dynamics |
| Pagg-VL | = | aggregation propensity of VL domain |
| Pagg-VH | = | aggregation propensity of VH domain |
| MAB 1 Control | = | MAB 1 expressed in CHO cells |
| RPM | = | revolutions per minute |
| CE | = | Capillary Electrophoresis |
| cIEF | = | capillary Isoelectric Focusing |
| ZDHH | = | Debye-Huckel Henry Charge |
Introduction
Monoclonal antibodies (mAbs) have emerged as the leading class of biopharmaceuticals, and their continued success in the clinical studies is driving the need to deliver them conveniently and at high concentrations. This has led to the development of small volume (typically, 1 mL), highly concentrated antibody formulations (typically, 100 mg/mL or more) for delivery via subcutaneous injections.Citation1-Citation6 In our experience, most therapeutic mAb candidates are amenable to such product development, but, in some cases, high solution viscosity can become a hurdle while developing high concentration antibody drug products.
The product development of a Pfizer proprietary mAb (MAB 1) candidate was discontinued due to its low solubility, elevated aggregation levels and high viscosity in liquid formulations. The addition of sodium chloride significantly reduced the viscosity of this mAb, but led to an increase in opalescence. MAB 1 also showed phase separation into a solid gel when stored at 2–8°C. These attributes of MAB 1 complicated processing (i.e., sterile filtration) and development of stable liquid dosage forms at high concentrations. Furthermore, in a separate study by Li et al of 11 Pfizer proprietary mAbs whose concentration dependent viscosity curves were generated in the same buffer using identical experimental procedures, MAB 1 demonstrated the second highest viscosity values at concentrations ≥100 mg/mL; MAB 1 is mAb 10 in of this study.Citation7 MAB 1 is a good model for exploring molecular re-designs for improved solution properties because it presents several drug development challenges. Improved understanding of sequence-structural characteristics that govern solution behavior of antibodies at high concentrations will enable strategies that allow for a more efficient drug candidate design / selection, and lead to early stage mitigation / elimination of hurdles faced during drug development process.
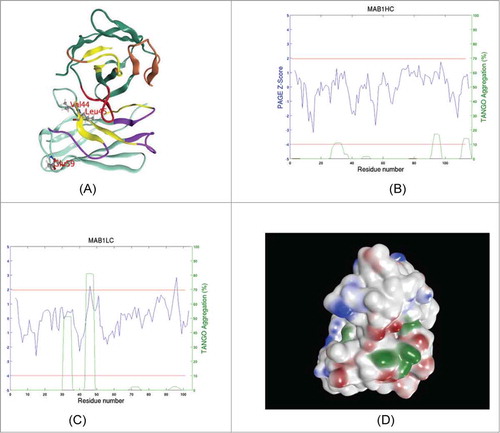
Figure 1. (A) A ribbon diagram showing the schematic structure of Fv portion of MAB 1. VH (top) and VL domains (bottom) are shown in dark green and cyan colored ribbons, respectively. Heavy chain CDRs 1 and 2 are colored brown while CDR 3 is colored red. All light chain CDRs are shown in magenta. Aggregation prone regions (APRs) predicted by a TANGO / PAGE combination are shown in yellow. Light chain residues at the sites selected for point mutations are shown in ball and stick. Note that V44 and L45 in light chain lie in an APR at VH: VL interface. Light chain E59 on the other hand is situated away from the domain interface. This model is oriented such that the antigen binding site is seen while looking down the plane of paper. (B) APRs spectrum for VH region is shown by plotting TANGOCitation13 and PAGECitation14 predictions simultaneously with respect to the residue number. The procedure followed here is the same as the one described earlier by Wang et al.Citation12 The Z-score computed from average and standard deviation values of PAGE aggregation propensity (lnP) score is plotted in blue color while TANGO predicted% aggregation is plotted in green. The 2 horizontal red lines indicate the cut-off values for Z-score (1.96, upper red line) and% aggregation (10%, lower red line) used. (C) APR spectrum for the VL region is shown. This plot is created in the same way as . Note that the second APR in the light chain (44-VLVIY-48) is the strongest one and was targeted for disruption at sites V44 and L45. (D) Solvent exposed hydrophobic (green), positively charged (blue) and negatively charged (red) patches on the surface of MAB 1 Fv. This picture is shown in the same orientation as .
Both hydrophobic and electrostatic intermolecular interactions determine solution behaviors of an antibody such as viscosity, solubility and aggregation.Citation8-Citation10 It is possible that the same (or overlapping) inter-molecular interaction hotspots on the molecular surface drive above mentioned interactions, thus promoting self-association, and therefore simultaneously underpin more than one drug development hurdles. The significance of intermolecular hydrophobic and electrostatic interactions increases with the increase in concentration because molecular crowding leads to the presence of mAb molecules at close distances, thereby, triggering proximal energy effects described by Laue.Citation11
To assess the relative contributions of hydrophobic vs. charged patches toward the viscosity of a mAb at high concentrations, 5 rationally designed single point mutants of MAB 1 were evaluated via biophysical experiments. The single point mutations were designed, using molecular modeling, to specifically target an aggregation prone region (APR) whose residues also participate in 2 solvent accessible hydrophobic patches, and a negatively charged patch present on the molecular surface of the variable region of MAB 1. Our goal was to study if such point mutations are capable of reducing the viscosity of MAB 1 at high concentrations. These experiments are part of a multi-stage study that aims to develop rational strategies for designing low viscosity variants for problematic therapeutic mAb candidates without sacrificing biological activity.
The strategies tested in this work involved disruption of an APR, and charge neutralization / reversal on a surface-exposed, negatively charged residue in the variable domain (VL) of the light chain in MAB 1. Two mutants, both present in the light chain, succeeded in improving apparent solubility and reducing viscosity of MAB 1 at high concentrations. Notably, APR disruption decreased viscosity of MAB 1 to a lesser extent than neutralization of the negatively charged surface patch, showing that inter-molecular interactions among MAB 1 molecules are electro-statically driven. Furthermore, the variants of MAB 1 that were designed to reverse the charge at the same residue led to its destabilization and loss of solubility. Another single point mutant that lies in the interface of VH and VL and disrupts the same APR resulted in drastic destabilization of MAB 1 and abolished its biological activity. All other mutants of MAB 1 retained biological activity. This work suggests useful tools and strategies important for reducing resource requirement, as well as chances of late-stage drug development failure, by appropriately optimizing a therapeutic mAb candidate at early stages of drug discovery for attributes that enable developability.Citation7
Results
MAB 1, an IgG1λ antibody, showed atypical biophysical properties that limited its options for further development as a commercially viable biotherapeutic drug product. Historical drug development data on this mAb in liquid formulation shows high levels of aggregates, opalescence / gelation at low temperatures (2–8°C), and high viscosity at concentrations ≥100 mg/mL. This mAb also bound strongly to TMAE anion exchange column during purification, thereby, reducing purification yields.
compares the data on accumulation of high molecular mass species (HMMS) in MAB 1 with a reference mAb (RefmAb) that shows low viscosities at concentrations ≥100 mg/mL,Citation7 from formulation stability studies. The HMMS species were not analytically characterized here and are referred to as aggregates in this report. These studies involved storing the antibodies formulated in the same buffer (20 mM histidine/histidine-HCl, 5% (w/v) sucrose, 0.02% (w/v) PS80, pH 5.8; see legend to ) at different temperatures for up to 3 months. During storage of highly concentrated (150 mg/mL) solutions of both the mAbs at 25°C and at 40°C, MAB 1 was found to be significantly more aggregation-prone than RefmAb. MAB 1 accumulated approximately 5 times (5×) more aggregates than RefmAb when both were stored at 40°C (). These results agree with those obtained from turbidity (opalescence) testing of MAB 1 and RefmAb over 6 months of storage at different temperatures. Samples of MAB 1 stored at 25°C showed significantly greater turbidity after 6 months (). In a study involving 11 Pfizer proprietary mAbs, concentration-dependent viscosity curves were measured using the same experimental procedures, instruments and formulation buffer.Citation7 MAB 1 demonstrated the second highest viscosity curve (see mAb 10 in Li et al.Citation7). compares the solution viscosity behavior of MAB 1 with that of the RefmAb. Again, a 150 mg/mL solution of MAB 1 is approximately 20 times (20×) more viscous than RefmAb at a similar concentration.
Table 1A. Accumulation of aggregates in MAB 1 during storage stability experiments as compared to RefmAb*
Table 1B. Turbidity of MAB 1 after 6 months of storage as compared to a RefmAb*
Table 1C. Concentration dependent viscosity behavior of MAB 1 as compared to RefmAb*
Further results and discussion in this report will be focused on MAB 1 and attempts to improve its solution behavior via single point mutations as outlined in the Materials and Methods section. Only the Fv portion of MAB 1 was considered in the molecular modeling calculations aimed at designing the mAb variants, but the effect of point mutations was experimentally studied using the full-length antibodies. Human antibodies consist of constant and variable regions. All the constant domains (CH1, CL, CH2 and CH3) in human IgG1 κ or λ mAbs have calculated pI values ≥7.0 Citation7 and, therefore, have overall positive net charges in the commonly used formulation pH range (5.5–6.3) for high concentration mAb products.Citation6 On the other hand, values of pI and net charge for the variable regions can vary from antibody to antibody, leading to different viscosity curves for the corresponding antibody solutions.
Computational modeling studies of MAB 1 and variants
An Fv model of MAB 1 was built as described in the methods section and used to identify potential sites for single point mutations (). show TANGO / PAGE predicted aggregation spectra of heavy and light chain variable domains in MAB 1, and Table S1 lists all APRs in MAB 1 Fv predicted by TANGO / PAGE combination.Citation12 Solvent-exposed hydrophobic and charged patches present on the surface of the Fv model are shown in . describes protein properties of the Fv portion of MAB 1 (MAB 1 Fv) calculated at pH 6.0 in 10 mM NaCl. MAB 1 Fv has a calculated pI of 4.4, which is below formulation buffer pH (6.0). This leads to an overall negative net charge (ZFv-Net = −2.38), negative apparent charge (ZFv-app = −0.29) and a low negative value for ξ-potential (ξFv = −2.90 mV) on MAB 1 Fv () along with the presence of several negatively charged patches in the antigen binding site (). Besides these electrostatic properties, also lists aggregation propensity values of the heavy and light chains of MAB 1 Fv. shows that several large hydrophobic patches are present on the molecular surface of MAB 1 Fv. Intermolecular interactions may play significant roles in determining solution behavior of antibodies.Citation8-Citation10 Consistent with this observation, values of net charge, pI and ξ-potential of the Fv regions were found to be correlated with viscosity of 11 full-length mAbs at high concentrations.Citation7 Similarly, the presence of large hydrophobic patches on the protein surface may enhance its tendency to self-associate, especially when electrostatic interactions have been screened by increasing salt concentration.Citation10
Table 2A. Molecular properties of the Fv portion of MAB 1*
To understand relative contributions of the hydrophobic versus electrostatic inter-molecular interactions toward solution behavior of an antibody, it is important to study the effects of variations in these interactions one by one via carefully chosen single point mutations. Calculated values for the change in thermodynamic stability (free energy), net and apparent charge, pI and aggregation propensity of the Fv portions of MAB 1 variants are given in . shows that values of pI and net charge increase for the Fv portions of all the mutants. Moreover, the increases in values of these parameters are greater for the charge reversal mutants, M2 (E59R) and M4 (E59K), than for the APR disruption mutants, M5 (L45K) and M6 (V44K), as well as for the charge neutralization mutant M3 (E59Y). These calculations were performed with respect to the Fv portion of MAB 1 (). Note that the Fv portions of MAB 1 or its variants were not produced in the laboratory and therefore no experiments were performed on the Fv portions alone.
Table 2B. Calculated changes in thermodynamic stability and other protein properties of Fv portion of MAB 1 due to single point mutations*
To study the importance of hydrophobic interactions toward the solution behavior of MAB 1, the APR 44-VLVIY-48 present in the light chain of MAB 1 variable domain (VL) was selected for disruption for the following reasons: The overall sequence of VL domain is predicted to be approximately 3 times (3×) more aggregation prone than that of VH, the variable domain in the heavy chain. The normalized aggregation propensity (Pagg) for VL is 6.54, while the corresponding value for VH is 2.23 (). Prediction for this APR is the strongest one made by the TANGO/PAGE combinationCitation12-Citation14 of all APRs identified in MAB 1 Fv (Table S1 and ). This APR is situated at the VH: VL domains interface (). The APRs can be present at the protein or subunit interfaces,Citation15 and can contribute significantly toward protein stability.Citation16 A parameter called IsolatednessCitation16 was used to measure contribution of this APR toward the native state stability of MAB 1 Fv (see Materials and Methods section). This parameter calculates the isolation of an APR from solvent, and therefore, by corollary, it measures how integrated an APR is with the rest of the protein structure.Citation16,Citation17 The APR 44-VLVIY-48 is more isolated from the solvent (ISOAPR = 0.854) than average Isolatedness of all 5-residue long segments (i.e., segments of same length as the APR) in this Fv (<ISO>av = 0.73 ± 0.13). Therefore it contributes more than average in terms of enthalpy, toward the native protein stability. Residues from this APR also participate in 2 large hydrophobic surface patches with solvent accessible surface areas of 190 Å2 and 76 Å2. Considering the location of this APR, its contribution toward Fv stability, and strength of prediction, this APR was selected for disruption via point mutations.
Two light chain amino acid residues in the above mentioned APR, V44 and L45, were chosen for mutagenesis. A mutation to Lys at either of these positions disrupts this APR (see Fig. S1B and S1C). Accessible surface area (ASA) calculations show that V44 is exposed to solvent (ASA of V44 = 31.9%) while L45 is solvent inaccessible (ASA of L45 = 1%). Visual examination of MAB1 Fv model showed that the L45 side chain points into the VH: VL interface while V44 side chain points away from it. presents calculated free energy change in the stability of the Fv due to the different single point variants explored in this study. The calculations indicate that L45K mutation is significantly destabilizing to the Fv structure, while there is no significant effect by the V44K mutation. The conformations of MAB 1 Fv with and without V44K mutations remain almost the same. These observations indicate that V44 may be a more suitable site for mutation than L45. Therefore, the L45K variant was used as a negative control to demonstrate that choice of residue position in an APR targeted for disruption can have important consequences for the protein folding, function and stability relationships.
The selection of a Lys residue for mutation at Val 44 (and Leu 45) was driven by the following reasons: (i) the Lys side chain is a primary amine with an intrinsic pKa of 11.1, which makes it highly soluble in water;Citation18 (ii) Lys is found in place of Val at the analogous sites in other human λ light chain clusters in the IMGT repertoire (http://www.imgt.org/); and (iii) in a separate study involving a different IgG1 λ mAb, disruption of a similar APR with V44K mutation resulted in improved solubility.Citation19
To test the importance of electrostatic intermolecular interactions toward the solution behavior of MAB 1, a negatively charged residue, E59, in the light chain was selected for either charge neutralization (E59Y) or charge reversal (E59K/R) because E59 is: (1) highly solvent-exposed (ASA of E59 = 76.8%); (2) situated away from the VH: VL interface () part of the third largest negatively charged surface patch (ASA of the negative patch = 126.5 Å2). Unlike the 2 larger negatively charged patches, the patch containing E59 lies at the periphery rather than being part of the main antigen binding site () of MAB 1 Fv. Therefore, its disruption is unlikely to affect the antigen binding properties of MAB 1. In our previous experience, an E59N, but not E59D, variant of MAB 1 showed decreased binding to TMAE column and therefore improved purification yields (data not shown). In the present study, however, E59N variant of MAB 1 was not tested due to a potential asparagine deamidation risk at a solvent-exposed site, even though the risk may be small because of the next residue being arginine (R60).Citation20 Small polar residues, Ser and Thr, were also found to be compatible with the E59 position via computational modeling studies (data not shown). These mutations shall be included in our future studies.
Experimental studies
MAB 1 and its single point variants (M1-M6) obtained via transient expression in HEK cells were subjected to tests for purity, stability, biological activity, apparent solubility and viscosity behavior. Values for Debye-Huckel Henry charge (ZDHH) and pI were also estimated for MAB 1 and variants. In all these experiments, MAB 1 produced in the Chinese hamster ovary (CHO) cells internally at Pfizer was used as a control (MAB 1 Control). Note that all the experiments were performed using the full-length antibodies.
Purity of MAB 1 and variants
Each antibody molecule (M1-M6) was assessed upon arrival at Pfizer laboratories for purity by SE-HPLC. shows an expanded view of an overlay of the SEC chromatograms of the 6 mAbs. With the exception of M5 (magenta), the main peak of each variant and wild type had the same retention time (RT, 10 min) as MAB 1 Control. The percent aggregates or HMMS eluting before the main monomer peak ranged from 0.7% (MAB 1 Control) to 9.0% (M6). The SE-HPLC chromatogram for M5 (L45K) contained 3 peaks, one of which eluted with the same RT as MAB 1 Control. The other 2 peaks correspond to higher order aggregates and elute before the monomer peak at 10 min. Furthermore, lower recovery of the monomer peak for M5 indicates that larger aggregates of M5 may have been trapped in the SE-HPLC column. A new batch of M5 reproduced the same SE-HPLC profile, thus, ruling out the possibility of artifacts due to impurities / contaminations in M5 sample. These observations suggest that M5 is destabilized and prone to form aggregates.
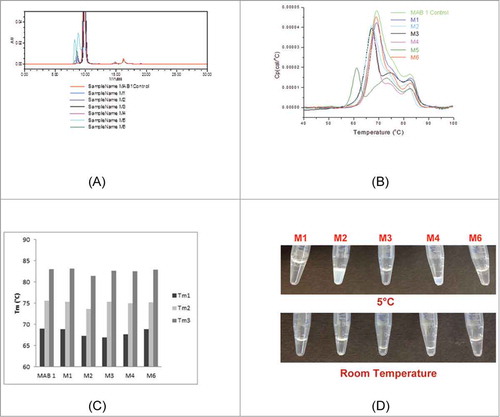
Figure 2. Observations on purity, thermal stability and concentrate-ability of MAB 1 and its variants are presented. (A) SE-HPLC profile overlays of MAB 1 Control and M1–M6. The SE-HPLC profile of M5 indicates presence of large amounts of high molecular mass species. (B) DSC thermogram overlays for MAB 1 Control and M1-M6. Again, it can be seen the M5 is significantly destabilized and shows 4 thermal transitions, while the other variants shown only 3. (C) Comparison of DSC thermal transition temperatures, Tm1, Tm2 and Tm3, for MAB 1 Control (denoted as MAB 1 in the plot), M1-M4 and M6. MAB 1 is MAB 1 Control, the parent MAB 1 produced at Pfizer using CHO cells. M1 is the parent MAB 1 produced at Syngene using transient transfection. The variants, M2, M3, M4 and M6 are single point variants of MAB 1, again, produced at Syngene using transient transection in HEK cell lines. (D) Appearance of M1 and its variants at high concentrations at 2–8°C and 25°C. All materials were at ∼130 mg/mL except for M2 and M4.
Thermal stability of MAB 1 and variants
Destabilization of M5 was confirmed by the differential scanning calorimetry (DSC) experiments. presents the overlays of DSC thermograms of MAB 1 Control and M1-M6. Table S2 in the Supplementary Material presents the data on these thermal transition temperatures and enthalpies. All variants, except M5, show 3 thermal transitions, like those reported earlier for other IgGs (see in Garber and DemarestCitation21). The DSC thermogram for M5 shows 4 thermal transitions, demonstrating that M5 is destabilized under the experimental conditions (). This observation concurs with the theoretical calculations () and demonstrates the importance of residue positioning and protein structural context when disrupting an APR. M5 was not used in further experiments because of the above described stability issues.
The DSC thermograms also indicate that M1–M6 have lower apparent enthalpies for each transition compared to MAB 1 Control ( and Table S2). The 3 thermal transition temperatures (Tms) for MAB 1 Control, M1-M4 and M6 are compared in . It can be seen that M1 and M6 have similar Tms as MAB 1 Control. However, more than one Tms are lower for each of the charge reversal and neutralization variants at position E59 (M2, M3 and M4) than the corresponding Tms for M1 or MAB 1 Control (), suggesting destabilization of different antibody structural regions. This result appears to be contrary to the Fv free energy change calculations (), which had suggested that M2, M3 and M4 shall be more stable than M1. However, the experiments were performed on full-length antibodies rather than just the Fv portions. Interestingly, it is the first thermal transition (Tm1) that appears to be affected the most. The Tm1 in DSC curve of a human IgG is associated with the melting of the CH2 domains in the Fc region.Citation21 The Fc region is located away from the site of mutations (E59 in VL domain). The Tm1s for M1, M2, M3 and M4 are 69.0°C, 67.25°C, 67.0°C and 67.66°C, respectively (Table S2). If there were no thermal coupling between stabilities of the Fab and CH2 domains, then lower Tm1 values for the variants M2, M3 and M4 would be unexpected. Therefore, this observation shows that inter-domain interactions between Fab and CH2 domains are coupling the stability of CH2 domains to stability of the Fab regions, and structural dynamics of the entire macromolecule might be affected by mutations in the Fv region. Previously, allosteric intramolecular interaction networks and coordination of conformational dynamic effects have been shown to play a role in antigen recognition by the antibodies.Citation22,Citation23 Do similar allosteric effects also modulate Fab: Fc interactions in antibodies when the antigen in absent? Such questions must await simulation studies on full-length models of MAB 1 and variants along with further experiments. The second thermal transitions, Tm2s, in the DSC thermograms of human IgGs indicate stability of the Fab regions.Citation21 Molecular dynamics (MD) studies performed on the Fv portions of M1, M2, M3 and M4 have proven useful in explaining the lowering of the second thermal transition temperatures (Tm2s). These studies are described in a later section on Fv dynamics in this report.
Concentrate-ability, phase separation and opalescence in MAB 1 and variants
The antibodies, M1-M6, needed to be concentrated for biophysical experiments because they were received under dilute conditions (1 mg/mL). Issues such as slow flow through the concentrator membrane and cloudiness of the protein solutions at concentrations ≥10 mg/mL were encountered during the process for increasing the concentration of M2 (E59R) and M4 (E59K). A white precipitate was observed in the M4 sample during this concentration process. M2 and M4 were also found to be difficult to pipette due to high viscosity of the solutions. The maximum concentrations that could be achieved for M2 and M4 were below 100 mg/mL (74 mg/mL and 61 mg/mL, respectively). Attempts at further concentrating these materials caused protein precipitation. In addition to these, both M2 and M4 showed poor recovery during the concentration processes. These difficulties in sample preparation for M2 and M4 precluded their viscosity measurements at high concentrations. M2 and M4 also phase separated into translucent white gels upon overnight storage at 2–8°C. The phase separation was reversed when these variants were warmed to 25°C (). Opalescence in M2 and M4 samples also disappeared once the samples were warmed up to the room temperature and re-appeared when they were cooled again.
Taken together, the above observations demonstrate that charge reversal at the light chain position E59 failed to improve solution behavior of MAB 1. This was unexpected because the Fv portions of charge reversal mutants had shown greater increases in the values of pI and net charge than the other mutants (). In hindsight, it is clear that since the molecular surface of the Fv portion of MAB 1 contains several large negatively charged patches (), disrupting just one of them via charge reversal actually increases the likelihood for self-associations. This is because the surface patch at position 59 is now positively charged in M2 and M4 and may promote electrostatic interactions with any of the remaining negative surface patches on the Fv portions of the other MAB 1 molecules in solution, thereby strengthening rather than weakening the inter-molecular interactions.
In contrast to the observations on M2 and M4, M1 (parent mAb), M3 (E59Y) and M6 (V44K) solutions remained clear throughout the concentration processes and yielded good protein recoveries. These variants also did not show any phase separation when stored overnight at 2–8°C.
Interaction parameter (k D) of MAB 1 and variants
Dynamic light scattering (DLS) experiments were used to study the solution behavior of MAB 1 Control, M1-M4 and M6 at dilute concentrations (2–10 mg/mL). Results from these experiments are presented in and . plots measured diffusion coefficients (D) vs. concentration for MAB 1 and its variants. This figure shows that slopes for all molecules tested in these experiments are negative, suggesting attractive self-associations. shows values of D0 (diffusion coefficient at infinite dilution), slope and interaction parameter k D for MAB 1 Control, M1-M4 and M6. The values of D0 for MAB 1 Control, M1-M4 and M6 range from 3.11 × 10⁻⁷ cm2/s to 4.34 × 10⁻⁷ cm2/s. These are similar to the diffusion coefficients of infinitely dilute solutions of human IgGs (4.4 ± 1.3 × 10⁻⁷cm2/s) reported by Saltzman et al.Citation24 As reported in the literature, several studies have attempted to interpret k D in terms of attractive or repulsive intermolecular interactions, and values of ∼ −9.0 mL/g or lower have been interpreted as the attractive self-associations.Citation8,Citation25-Citation28 In this study, the k D values are in the range of −12 mL/g to −29 mL/g for MAB 1 Control, M1-M4 and M6 (). Therefore, the nature of inter-molecular interactions for MAB 1 and mutants is most likely to be attractive.
Table 3A. DLS measurements on MAB 1 and its variants*
Figure 3. DLS profiles the parent mAb, M1, and variants M2, M3, M4 and M6 are shown along with MAB 1 Control. The X-axis shows concentration of antibody solutions, c (mg/mL), and the Y-axis shows measured diffusion co-efficient, D (cm2/s). Interaction parameters computed from the plots indicate considerable decrease in self-associative behavior for M3 (E59Y).
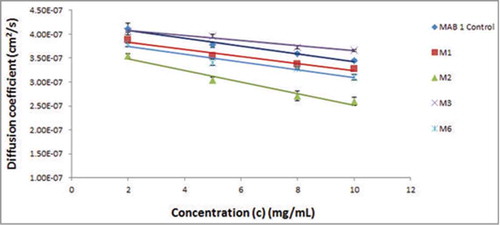
The charge reversal mutant M2 (E59R) has the most negative k D value (−28.6 mL/g), indicating that it has the strongest attractive tendency to self-associate (). As described above, this variant had also presented several issues in regard to its concentrate-ability, opalescence and phase separation. In addition to M2, precipitation of M4 during sample processing for DLS analysis hampered reliable determination of k D due to interference with the light scattering signal. In contrast to M2 and M4, M3 (E59Y) has a k D of −12.7 mL/g. This value is improved over those for both M1 (k D = −18.9 mL/g) and MAB 1 Control (k D = −28.1 mL/g) (). Therefore, eliminating a negatively charged surface patch in the Fv portion via charge neutralization reduced the ability of MAB 1 to form attractive intermolecular interactions. M6 (V44K) shows a similar DLS profile as M1 (k D = −20.8 mL/g), indicating that APR disruption did not significantly affect the k D value.
The above observations are consistent with the overall negative charge on the Fv portions of MAB 1 and its variants. The mutations do not fully neutralize overall negative charge on MAB 1 Fv (). The presence of 2 electronegative Fvs in an otherwise electropositive antibody structure (positively charged constant domains) imparts a multi-polar electrostatic character to the full-length mAb. This promotes attractive inter-molecular interactions, which will likely lead to the formation of large antibody networks capable of resisting solution deformation upon shear stress. Formation of large antibody networks was indeed observed during coarse-grained simulations of MAB 1 (data not shown).
Charge and pI measurements of MAB 1 and variants
To understand the effect of single point mutations on electrostatic properties of full-length MAB 1 and variants, their Debye-Huckel Henry charge (ZDHH) and pI values were measured using capillary electrophoresis (CE) and capillary isoelectric focusing (cIEF) methods, respectively. presents results obtained from these measurements. Global values of pI and charge for full-length MAB 1 and variants show trends that are consistent with the trends observed in the corresponding local values for their Fv portions (). All the variants (M2, M3, M4 and M6) show increase in pI and ZDHH. The values of pI and ZDHH increased to smaller extents for the APR disruption (M6) and charge neutralization (M3) mutants than for the charge reversal mutants (M2 and M4) of MAB 1. The data shown in also reinforces the conclusion from an earlier report from our group that global attributes of full-length antibodies such as pI and charge may not be linearly correlated with their solution behavior at high concentrations.Citation7 The mutants M2 and M4 both show considerably increased pI and ZDHH values compared to M1, the parent MAB 1. However, the solution behaviors of M2 and M4 worsened compared to M1. Taken together, these observations suggest that other electrostatic properties of MAB 1 and its variants, such as dipole and higher order moments, may be required for explaining their solution behaviors. However, such measurements were outside the scope of present investigation. Perhaps consistent with their lower thermal stability (Table S2), the hydrodynamic radii (RH) for M2 (ΔRH = 0.65 nm) and M4 (ΔRH = 1 nm) also increased by ∼10–15% compared to the parent MAB 1 (M1, RH = 6.35 nm), whereas the changes in the RH values for M3 (ΔRH = −0.03 nm) and M6 (ΔRH = 0.21 nm) are insignificant (ΔRH < 5%, ).
Table 3B. Isoelectric point (pI) and Charge of MAB 1 and variants*
Apparent solubility of MAB 1 and variants
Relative solubility as measured by apparent solubility scores was evaluated for M1-M4 and M6 along with MAB 1 Control. shows the PEG apparent solubility data for different mAb variants. The apparent solubility scores for M3 and M6 are 11.8 ± 0.1% and 11.3 ± 0.1%, respectively. These values are considerably greater than apparent solubility score for M1 (8.9 ± 0.1%). Therefore, M3 and M6 showed improved solubility. This observation is consistent with the improved viscosity of M3 and M6 at high concentrations (next section). The charge reversal mutants, M2 and M4, show lower apparent solubility scores (). This is consistent with the other observations on these variants as described in the previous sections.
Table 3C. Apparent solubility of MAB 1 and variants measured using the PEG precipitation method*
MAB 1 Control and M1 have identical amino acid sequences, but the apparent solubility score for MAB 1 Control is 10.3 ± 0.1%, 1.4% greater than the score for M1. It is known that the presence of glycosylation and the types of glycoforms attached to an antibody may affect its stability and aggregation propensity.Citation29-Citation32 MAB 1 Control was produced in CHO cells, while the antibodies, M1-M6, were produced via transient transfection of HEK cells (see Materials and Methods section). Differences in the cell lines may result in different glycan profiles for M1-M6 than MAB 1 ControlCitation33,Citation34 and may explain the discrepancy in apparent solubility scores between M1 and MAB 1 Control. Future studies will include the assessment of glycan profiles of these constructs. The apparent solubility of the RefmAb, also produced in CHO cells, is 19.5 ± 0.5% (). The amino acid sequence differences between RefmAb and MAB 1 are much greater than those between MAB 1 and its single point mutants. In addition to these, macromolecular attributes such as pI, net charge (Z), ξ-potential, dipole moment, distribution of charged and hydrophobic residues on the antibody surface may also contribute toward apparent solubility difference between MAB 1 and RefmAb. Clearly, the single point mutations in MAB 1 were insufficient to increase its apparent solubility to an extent that it becomes comparable to that of RefmAb.
Concentration dependent viscosity curves for MAB 1 and variants
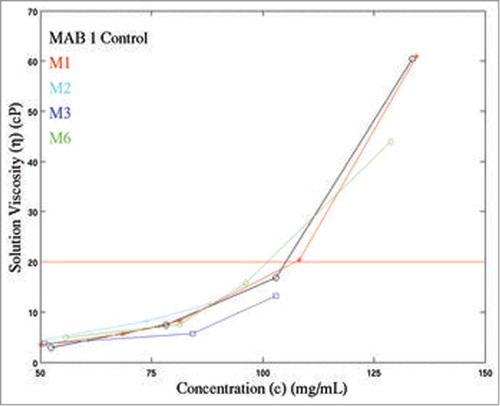
Solution viscosities were measured at several different concentrations for M1-M4, M6 and MAB 1 Control () and are plotted in . Due to the material limitations, only a few experimental measurements of viscosity data at high concentrations could be made. The experimentally measured viscosities of all antibody solutions increase with increasing protein concentrations. At ∼80 mg/mL and 100 mg/mL concentrations, the variants M3 (ηM3 = 5.7 cP at 84.3 mg/mL and 13.2 cP at 103 mg/mL) and M6 (ηM6 = 7.5 cP at 81.3 mg/mL and 15.8 cP at 96.2 mg/mL) have lower viscosities than M1 (ηM1 = 8.3 cP at 81.3 mg/mL and 20.4 cP at 108.2 mg/mL) (). At ∼130 mg/mL concentration, the solution viscosities of M1 and M6 become significantly different (ηM1 = 61.0 cP at 134.6 mg/mL and ηM6 = 44.0 cP at 128.8 mg/mL). The viscosity measurements for M1, M3 and M6 could not be made at higher concentrations due to lack of materials. In contrast, the experimental viscosity data on M2 and M4 variants is limited due to their low solubility (maximum solubility of M2 = 74 mg/mL; maximum solubility of M4 = 61 mg/mL). At ∼50 mg/mL, M2 and M4 have similar viscosity values as M1 (ηM2 = 3.6 cP at 45.8 mg/mL, ηM4 = 3.7 cP at 51.5 mg/mL and ηM1 = 3.5 cP at 50.2 mg/mL) (). In summary, M3 and M6 showed improved solution viscosity behavior as compared to M1, but M2 and M4 did not (). Interestingly, M1 has a similar concentration dependent viscosity curve as MAB 1 Control. This observation is different from the analogous observation made on apparent solubility scores for MAB 1 Control and M1 in the preceding paragraph.
Table 4. Experimentally determined solution viscosity values for antibody solutions of MAB 1 and variants at different concentrations
Figure 4. Experimentally measured concentration dependent viscosity curves for MAB 1 and its variants (M1, M2, M3, and M6) plotted along with MAB 1 Control (indicated as MAB 1). X-axis indicates concentration of antibody solutions, c (mg/mL). Y-axis shows the solution viscosity, η (cP). The horizontal red line indicates a viscosity of 20 cP. As a general rule, viscosity below 20 cP is desired for highly concentrated antibody solutions to be delivered subcutaneously. It can be seen that viscosity behaviors of M3 and M6 are improved compared to M1.
The linear relationship between logarithm of relative viscosity of a solute (antibody) and solute concentrationCitation35 was used to extrapolate the concentration-dependent viscosity curves for MAB 1 and its mutants, under an assumption that the experimental conditions remain identical. The data on MAB 1 Control, M1, M3 and M6, were manipulated according to Equations 6–8 in Materials and Methods section to obtain the regression parameters, slope (B) and intercept (lnA), for each antibody. A minimum of 3 experimental observations were required to compute the linear regression parameters in each case. The regression parameters were then used to extrapolate the solution viscosity curves for these antibodies in the concentration range of 1 mg/mL to 200 mg/mL. An extrapolated viscosity curve for M4 was not computed because there is only one experimental viscosity measurement for M4 (). An extrapolated viscosity curve for M2 was also not computed, even though 3 data points are available for M2. This is because M2 is unlikely to remain in solution at high concentrations. The extrapolated solution viscosity curves for MAB 1 Control, M1, M3 and M6 are shown in Figure S3 in the supplementary material. These curves show that both M3 and M6 have improved concentration-dependent viscosity profiles. However, reduction in viscosity for M3 is more substantial than that for M6. This observation is consistent with the k D data on these variants obtained from DLS experiments. Taken together, neutralization of the negatively charged patch has greater effect on viscosity of MAB 1 than disruption of an APR.
Biological activity of MAB 1 and variants
In this study, the MAB 1 Control, and M1-M6 were subjected to competitive binding ELISA to determine the biological activity as described in the materials and methods section. shows the results for M1-M6 along with the MAB 1 Control. All variants of MAB 1, except M5, retain biological activity. No dose response curve was observed in the case of M5, demonstrating that this mutant is inactive. MAB 1 binds a soluble protein ligand and blocks its interaction with a cell surface receptor. The ELISA method used in this work was designed to mimic the mechanism of action of MAB 1.
Table 5. Biological activity of MAB 1 and variants measured by competitive ELISA assays*
Molecular dynamics simulations on Fv portions of MAB 1 and variants
The above described experimental studies demonstrate that computational design of MAB 1 variants met with partial success. Molecular modeling calculations, which were performed only on the Fv portion of MAB 1, correctly predicted destabilization of M5 (L45K) and negligible stability change for M6 (V44K) (). However, these calculations had also indicated that mutations at E59 (M2, M3 and M4) shall increase the stability of the Fv region (). The experiments performed using the full-length mAbs, showed that M2, M3 and M4 have lower thermal transition temperatures (). Specifically all the 3 transition temperatures for M2 are lower than those for M1. These observations indicate that the effect of sequence mutations propagated beyond the immediate structural context of E59 in the VL domain and altered the whole antibody structural dynamics. For M3 and M4, the third thermal transition temperatures corresponding to melting of the CH3 domains (Tm3s)Citation21 have similar values as M1 and MAB 1 Control (Table S2). However, their Tm1 and / or Tm2 values are lower (). The modeling studies performed only on the Fv portions were incapable of predicting this because the rest of the antibody structure was not included in the calculations. It remains to be seen if similar calculations performed using the full-length antibody models would have predicted the experimental observations.
The second thermal transition, Tm2, in the DSC thermograms of human IgGs corresponds to the stability of the Fab region.Citation21 Among the variants, M2 has Tm2 (73.58°C) lowered by 1.81°C compared to the parent mAb (Tm2 for M1 = 75.39°C). For M4, Tm2s is lowered by 0.44°C (Tm2 for M4 = 74.95°C). However for M3, Tm2 (75.34°C, ΔTm2 = 0.05°C) is same as that of M1 within experimental errors. These observations indicate that charge reversal at E59 position (M2 and M4) may be disrupting specific inter-residue interactions present, but not revealed in the static structural model of MAB 1 Fv.
To understand how mutations at position E59 in the light chain affect Tm2 values for the charge reversal/neutralization variants, short molecular dynamics simulations were performed on Fv homology models of M1-M4 using NAMD.Citation36 The simulations were run at 300 K (Fig. S2A–D), and also at an elevated temperature 400 K for greater conformational sampling (). The duration for each simulation trajectory in the production run was 5 nanoseconds (5 ns). No significant deformations of the overall Fv structures were observed within this small period in any trajectory. Therefore, these simulations only explore systemic flexibility/breathing of the Fv structures. In the M1 simulation at 400 K, formation of a salt bridge between the side chains of E59 and R53 () was observed. In the analogous 300 K simulation, this salt bridge is not formed as readily, but an electrostatic interaction is formed between the side chain of R53 and the backbone carbonyl of E59 (Fig. S2A). In the elevated temperature simulation, a third electrostatic interaction also formed between the side chain of R53 and the backbone carbonyl of I57. Overall, the side chain guanidium group of R53, which lies in structural vicinity to E59, engages in 3 promiscuous salt bridging interactions with the back bone carbonyl of I57, and the backbone carbonyl as well as side chain carboxylate of E59 in M1.
Figure 5. Five nanoseconds-long molecular dynamics (MD) simulations were performed on the Fv portions of (A) M1, (B) M2, (C) M4 and (D) M3 at elevated temperatures (400 K). In each plot, X-axis shows the simulation time (ns) and Y-axis indicates distances (Å) between specific atoms of interacting residues in the structural context for position 59 in the light chain of MAB 1. The side chain and backbone distances are shown for interactions formed by the residue at position 59 and I57 with the side chain functional group of R53. The red line shows the distance between central atom in side chain of residue at position 59 and the Cξ atom in the side chain of R53. The green line indicates the distance of the backbone carbonyl atom of the residue at position 59 with the Cξ atom in the side chain of R53. Similarly, the blue line indicates the distance of the backbone carbonyl atom of I57 from the Cξ atom in the side chain of R53. When the distance between carbon atoms is below 6 Å, an interaction is considered to be formed (black horizontal line). This figure shows that side chain guanidium group of R53 engages in promiscuous salt bridging interactions with the back bone carbonyl of I57, and the backbone carbonyl as well as side chain carboxylate of E59 in the parent mAb, M1. Upon charge reversal at position 59 (M2 and M4 variants), the electrostatic repulsions between the side chains of the residue at position 59 and R53 weaken this electrostatic network leading to destabilization of the Fab as evidenced by decreased Tm2 values for M2 and M4. However, the charge neutralization variant, M3, restores the network among these 3 residues by forming tyrosine ring π interactions with the guanidium group of R53. Analogous simulations were also performed at 300 K. These are shown in the supplementary material (Fig. S2A–S2D).
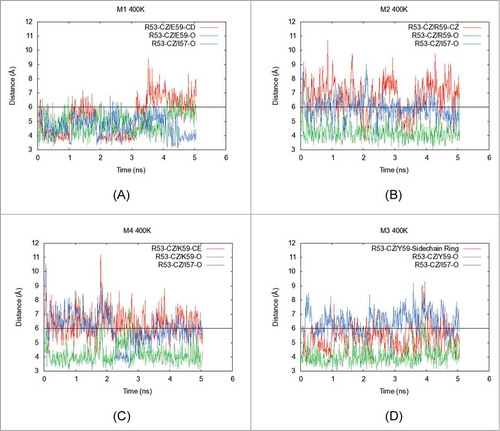
For M2 (E59R), the positively charged side chain guanidium groups in R53 and R59 are expected to repel each other. During the M2 simulation, side chains for these 2 amino acid residues were often far apart. The primary electrostatic interaction formed during the simulation of M2 was between the side chain guanidium group of R53 and the backbone carbonyl of I57 at 300 K (Fig. S2B) or the backbone carbonyl of R59 at 400 K (). Similarly, side chain interactions between residues R53 and K59 were not observed during the simulations of M4 (E59K). For this mutant, the primary electrostatic interaction formed during simulations was between the side chain of R53 and the backbone carbonyl of K59 at both 300 K and 400 K (Figs. S2C and 5C).
During the M3 (E59Y) simulations (Figs. S2D and 5D), side chain functional groups for Y59 and R53 come closer than 6 Å, much more often than the corresponding side chain interactions in M2 and M4 (Fig. S2D). At 400 K, this R53-Y59 side chain interaction forms even more often and for longer periods of time (). Therefore, it appears that the charge neutralization variant, M3, is able to compensate for lost interactions and recover thermal stability of the Fab region.
Discussion
High concentration formulations of mAb solutions suitable for subcutaneous delivery are desirable from the perspective of patient convenience and compliance to prescribed therapeutic regimes.Citation2,Citation4,Citation6 However, development of certain mAb candidates has been found to be challenging because of high viscosity and aggregation issues at concentrations above 100 mg/mL. MAB 1 was peculiar in this regard because it posed multiple challenges related to stability, solubility, and viscosity at high concentration. Therefore, it is a suitable model antibody to explore sequence optimization strategies for mitigating drug development challenges such as high viscosity. This study was focused on devising viscosity reduction strategies for MAB 1 via point mutations in the light chain.
Formulation buffer characteristics, such as pH, ionic strength, excipients and surfactants contribute toward determining viscosity behavior of an antibody at high concentrations. For example, addition of salt can significantly affect viscosity of an antibody solution.Citation10 Hydrophobic salts and excipients, polar solvents, non-aqueous organic suspensions and gel beads can help reduce solution viscosity.Citation1,Citation37-Citation39 In practice, overcoming the challenges posed by high viscosity for an antibody candidate already in development by altering solution buffer characteristics is a time-consuming, resource-intensive, trial and error process that is preferably avoided.
Sequence-structural attributes of an antibody also determine its viscosity at high concentrations. For example, Kalonia, Shire and their coworkers have studied 2 mAbs that demonstrate high and low viscosities at concentrations above 100 mg/mL. The amino acid sequences of the 2 mAbs differ only in their complementarity-determining regions (CDRs).Citation40-Citation42 Similar observations implying the role of antibody sequence—structure in determining viscosity profiles have been made by others as well.Citation43,Citation44 In the study performed by Li et al.,Citation7 each of the 11 antibodies demonstrates a different concentration-dependent viscosity curve.
The strategies for optimization of antibody formulation buffer and those for optimization of antibody sequence-structure are complementary toward the overall goal of developing low viscosity, high concentration mAb drug products suitable for subcutaneous delivery. Computational approaches can identify mAb candidates with potential for high viscosities at concentrations ≥100 mg/mL and provide remedial strategies to reduce viscosity. These approaches do not consume any materials and can be applied as soon as lead compounds have been identified.Citation7 This work was performed to gain an understanding of principles for rational design of viscosity reducing variants of therapeutic mAbs and demonstrate a proof of concept.
Several approaches to identifying viscosity reducing variants of a mAb are available. A hypothetical approach is random mutagenesis of each position in the variable region of light and heavy chains with all 20 amino acids and high throughput screening to identify clones with reduced viscosity from a potential library of up to 5000 variants for an Fv of 250 residues. The identified clones with reduced viscosity would then need to be also screened for biological activity, stability and safety. In a more practical approach, the random mutagenesis could be restricted to the residues in the CDRs or adjacent Vernier zones, keeping the framework regions unchanged. Such an approach still requires screening a potential library of several tens to hundreds of variants. Therefore, sequence and structural properties of the Fv region of MAB 1 were explored via molecular modeling to reduce the experimental effort. Initially, only 5 variants were chosen for the experiments to identify principal intermolecular interaction hotspots that underpin high viscosity, but whose disruption may not affect antigen binding. Each of these variants is a single point mutant and the rationale for selecting them was explained in the Results section. Briefly, these 5 variants explored the relative contributions of hydrophobicity versus electrostatics toward a mAb's solubility, thermal stability and viscosity by disrupting an APR and a negatively charged patch. summarizes the effect of each mutation on thermal stability, apparent solubility, DLS interaction parameter, viscosity and activity of MAB 1. The major findings are:
Table 6. Summary of the effect of single point mutations on thermal stability, solubility, viscosity and biological activity of MAB 1*
An APR 44-VLVIY-48 that also participates in 2 solvent-exposed hydrophobic patches was disrupted by 2 single point mutations. The mutation L45K (M5) destabilized MAB 1 and completely abolished its antigen binding activity. However, the same mutation at the preceding position (V44K, M6) retained both biological activity and thermal stability of MAB 1. The V44K variant also succeeded in improving apparent solubility and viscosity behavior of MAB 1. This finding demonstrates a delicate balance between protein stability, function, solubility and viscosity for MAB 1. In addition, it speaks to the need for careful selection of APRs targeted for disruption,Citation16 as well as the choice of residue position for mutation.
Neutralization of a negatively charged patch was found to be better than charge reversal (M2, M4 vs. M3) for improving solution behavior of MAB 1 in the DLS experiments and for reducing its viscosity. This finding has important implications toward devising rational strategies for creating viscosity reducing mutants of antibodies. Electrostatic properties of Fab surfacesCitation40 as well as change in pH, addition of salts/ions, especially anions, to antibody solutions can significantly alter physical behavior of antibodies.Citation9,Citation10,Citation45 Number and size of negatively charged patches can vary among different antibodies, and the relative importance of hydrophobic versus electrostatic intermolecular interactions toward their solution behaviors is variable.Citation10 Therefore, it remains to be seen whether this observation can be generalized to other antibodies as well. For MAB 1, the data suggests that optimization of the negative charge on the Fv portion is a more appropriate strategy. It must be noted that experimental measurements of overall protein charge can be performed using electrophoretic techniques, which provide an overall estimate of protein charge in solution, taking anion binding into account. Similarly, measurement of dipole moments can help explain the behavior of concentrated systems.Citation45 However, these global measurements provide no guidance for site-directed mutagenesis for which computational models used in this work are well suited.
Disruption of a hydrophobic patch and neutralization of a negatively charged surface patch led to similar improvements in apparent solubility, but improvements in concentration-dependent viscosity profiles were substantially different. These findings show that solution viscosity behavior of an antibody depends mainly on electrostatic inter-molecular interactions, while hydrophobicity may be important for ‘fine tuning’.
While the above described work is promising, its limitations should be also acknowledged. First, the modeling efforts were restricted to the MAB 1 Fv because it was expected that the effect of mutations on thermodynamic stability shall be restricted to MAB 1 Fv. The mutations at the solvent exposed site, E59, lowered all 3 thermal transition temperatures measured by DSC for M2, and the first and/or second thermal transitions for M3 and M4. Therefore, the effect of these mutations on the thermodynamic stability and conformational dynamics was found to be global rather than localized. This observation reinforces the importance of inter-domain interactions and allosteric effects in antibody structural dynamics,Citation22,Citation23 and simulations of full-length antibodies are needed to rationalize these observations. Second, not all the variants succeeded in reducing viscosity of MAB 1 at high concentrations. The charge reversal variants (M2 and M4) were expected to raise the net charge and pI of the Fv portion and of the whole mAb. In the experiments, however, these mutants increased antibody self-associations. All these are important lessons for improving future work.
In spite of the above mentioned limitations, this report presents results from a comprehensive investigation into the relative importance of hydrophobic and electrostatic protein—protein interactions in determining concentration dependent viscosity behavior of the antibody solutions. As mentioned previously, Kalonia, Shire and their coworkers had compared amino acid sequences of 2 mAbs, MAb1 and MAb2, which showed high and low viscosities, respectively, at high concentrations.Citation40-Citation42 They attempted to lower viscosity of MAb1 by swapping 8 residues in its CDR regions with those present in MAb2 (charge swap mutant M7, see in Yadav et al 2011).Citation41 The authors found that replacing the negatively charged residues in both VH and VL regions simultaneously led to a greater decrease in viscosity of MAb1 than replacing them in either VH or VL. This study demonstrated that solvent exposed negatively charged residues in the CDRs led to increased self-associations for MAb1, but did not address the question of how the specific CDR mutations affected biological activity of MAb1.Citation41 As far as we know, ours is the first report that seeks to understand relative importance of the 2 principal kinds of protein-protein interactions (hydrophobic and electrostatics) toward viscosity behavior of a therapeutic mAb candidate via single point mutations, while simultaneously retaining the biological activity of the mAb. In future work, the light chain negatively charged patch of MAB 1 will be explored further with additional point mutations, both singly and in combination with the APR disrupting mutation, V44K. Simultaneous disruption of the APR and negatively charged patch is expected to yield synergistic improvements in viscosity of MAB 1.
Materials and Methods
MAB 1 Fv model building
A molecular model for the Fv portion of MAB 1 was made using the Antibody Modeler module in MOE2013.08. A total of 625 intermediate homology-based models (25 backbone models and 25 side chain models per backbone model) were generated and optimized to a root mean square gradient (RMSG) of 0.01 via energy minimizations using AMBER99 Force-field with reaction field implicit solvation model. The internal dielectric constant was set to 4 and the external dielectric constant was 80. Cut-off distances of 10 and 12 Å were used to screen non-bonded interactions. The intermediates were ranked according to their GB/VI scores and the model with the highest rank was selected as the final model for the Fv portion of each mAb. The C-termini of VL and VH domain in the final model were neutralized via amidation and the model was re-protonated at pH 6.0 and 10 mM salt concentration, via Protonate3D in MOE2013.08, to mimic the experimental conditions (20 mM histidine/histidine-HCl buffer, 5% (w/v) sucrose, and pH 6.0). Note that the calculations were carried out at low salt concentration even though the formulation does not contain salts. This was done to take into account the effect of Cl− anions that may be tightly bound to the antibody. After these steps were completed, the final model of MAB 1 Fv was optimized via energy minimizations to RMSG below 0.00001. To generate molecular models for Fv portions of MAB 1 variants, the model for MAB 1 Fv was mutated at the light chain (LC) sequence positions V44, L45 or E59. To carry out these mutations, ResidueScan module under Protein Design was used with the following settings for the variant generation: Re-pack environment, 9 Å; Alternate protomers pH, 6.0; and Refine mutations, 0.01 RMSG. For the parent (MAB 1 Fv) and each variant, the conformational ensembles were generated using molecular dynamics. The following conformational ensemble generation settings were used: Simulation Length, 1000 ps; Energy Window, 10 Kcal/mole, Conformation Limit, 100; and Fix residues farther than, 10 Å. Overall, the following Fv models were generated: M1, parent MAB 1; M2, LC E59R; M3, LC E59Y; M4, LC E59K; M5, LC L45K; and M6, LC V44K.
Computation of molecular properties
Molecular models of the Fv portions of MAB 1 and variants were used to compute structure-based molecular properties at pH 6.0 and 10 mM NaCl concentration (low ionic strength) using Protein Properties and Patch Analyzer modules in MOE2013.08. The formulation buffer used in the experiments performed here did not contain any added salt. However, low ionic strength was still used in these calculations to account for any ions that may have been carried over from the purification train. The following quantities were computed for each Fv model: net charge (ZFv), apparent charge (ZappFv), dipole moment (DFv), ξ-potential (ξFv), pI (pIFv), hydrophobic and hydrophilic Van der Waals surface area, and number of positively charged, negatively charged and hydrophobic surface patches.
Sequence based predictions of aggregation propensity and APRs
The amino acid sequences of the Fv portions of M1-M6 were used for aggregation propensity and identification of APRs. Aggregation propensity values were calculated separately for light and heavy chains in an Fv. For each chain, the aggregation propensity, Pagg, was defined as the total TANGO aggregation scoreCitation13 for the chain normalized by number of amino acid residues in the chain. The APRs were identified using a combination of TANGOCitation13 and PAGECitation14 as described by Wang et al.Citation12
Isolatedness of APRs from the solvent
Atomic coordinates from MAB 1 Fv model structure were used to compute solvent accessible surface areas (ASA) for all residues in the structure using STRIDE.Citation46 The ASA values for individual residues in an APR were summed to obtain total solvent accessible surface area (TotASAAPR) for the APR. The residues from the APR were also used to compute total surface area values (TotSAAPR) for the APR outside of its protein structural context. Note that APR has the same conformation in both the calculations. TotSAAPR and TotASAAPR values for each APR were used to compute Isolatedness from the solvent of the APR (ISOAPR) as follows ( Equation 1 ):
The values of ISOAPR range from 0 (the APR is completely solvent exposed) to 1 (the APR is completely buried in the protein core or subunit interface).Citation17
ISOAPR can be interpreted as contribution of an APR toward native state of the protein.Citation16,Citation17 To evaluate the significance of an APR's contribution to native protein structure, the Isolatedness values were also computed for all sequence segments of same length as the APR. Each segment was obtained by sliding a window of same length as the APR over the Fv structure one residue at a time. The Isolatedness values thus computed were averaged to obtain average Isolatedness (<ISO>) and used for comparison with each ISOAPR value.
Molecular dynamics simulations
NAMD simulationsCitation36 were performed to relax homology-based molecular models of Fv portions of MAB 1 and its variants, using the CHARMM27 force field.Citation47 In the simulation setup, all intra-domain disulfide bonds were formed. The Fv models were solvated in a bath of TIP3 water and ions were added to neutralize the system. Both chains had their C-termini amidated to neutralize charges. Solvent and hydrogen atoms were energy minimized first for 20,000 steps using conjugate gradient descent. Subsequently, all atoms were minimized for 10,000 steps. Simulations were run at 300 K and 400 K for 5 ns with a 2 femto second (fs) time-step. Periodic boundaries conditions were employed and Particle Mesh Ewald summation was used to model long range electrostatics past a non-bonded interaction cutoff of 10 Å. Temperature was controlled using a Langevin dampening coefficient of 5ps−1. Pressure was simulated at 1 atmosphere and controlled using a Langevin piston. Trajectory samples were taken every 10 ps for the calculation of structural properties.
MAB 1 and variants expression and purification
Full-length cDNA for the parent MAB 1 (M1) and each variant (M2, E59R; M3, E59Y; M4, E59K; M5, L45K and M6, V44K) was prepared at Pfizer, Cambridge, MA. MAB 1 and variants were expressed in HEK cell lines using transient transfection at Syngene (Bangalore, India). These full-length mAbs were purified using a 2-step column purification process that consisted of a protein A column followed by size exclusion chromatography (SEC) (mobile phase: 20 mM sodium phosphate, 150 mM NaCl, pH 6.0). Approximately 50 mg of each variant was shipped frozen to Pfizer, Andover, MA, USA for experimental studies. MAB 1 previously manufactured at Pfizer Andover in CHO cells was used as an internal control. It is referred to here as ‘MAB 1 Control’. Upon receipt, an aliquot of each mAb was thawed and its purity was assessed by size exclusion high performance liquid chromatography (SE-HPLC). All mAb variants produced in these studies were formulated in 20 mM histidine/histidine-HCl buffer, 5% (w/v) sucrose, pH 6.0.
Size exclusion-high performance liquid chromatography
SE-HPLC was performed on YMC-Pack Diol −200 column, 300 mm × 8 mm ID using a mobile phase containing 20 mM sodium phosphate, 400 mM NaCl, pH 7.2. The flow rate was 0.75 mL/min and the column temperature set at 30°C. Absorbance was monitored at A280 nm over the course of the 30 min run time. A total of 50 μg of protein from each sample was loaded neat for each analysis. Instrumentation included Water's Alliance 2695 separations module equipped with Water's W2489 UV/Vis detector. Empower 2154 was used for data acquisition and analysis.
Dynamic light scattering
For DLS studies, dilutions were prepared in the same formulation buffer (20 mM histidine/histidine-HCl buffer, 5% (w/v) sucrose, pH 6.0) for each mAb in the range of 2–10 mg/mL. DLS was performed using a Dynapro Plate Reader II (Wyatt Technology) and data analyzed using Dynamics V7.1.7 software.
Measurement of charge for MAB 1 and variants by capillary electrophoresis
Measurement of electrophoretic mobility for MAB 1 and its variants was carried out in a Beckman Coulter PA800 instrument using eCap amine capillary of 30 cm total length (LT) and 50 μm internal diameter (ID). The length of the capillary from the injector to the detector (LD) was 20 cm. Detection was carried out at 280 nm wavelength. Benzyl alcohol was used as a neutral marker for calculating electrosmotic flow (VEOF) so that it could be detected at 280 nm. Each sample (2 mg/mL, 20 mM histidine/histidine-HCl buffer, 5% (w/v) sucrose, pH 6.0) was mixed with benzyl alcohol prior to injection. Concentration of benzyl alcohol in the final mix was 0.1% (v/v). The samples were injected at 0.3 psi for a period of 5 sec. Separation was carried out under constant voltage of 8 kV, under reverse polarity. In an amine capillary at the given solution condition (pH 6.0), the electrosmotic flow is expected to happen from –ve electrode to +ve electrode, whereas the electrophoretic movement (VELE) of MAB 1 and its variants are expected to happen in the opposite direction (+ve to –ve electrode) because the pI values for MAB 1 and variants, as determined by capillary isoelectric focusing (described below), are more than 7.0 (). Based on this, the electrophoretic mobility (cm2/volt-sec) values for MAB 1 and variants are calculated using Equation 2 .
Calculation of Debye-Huckel Henry charge (ZDHH) was performed using Equation 3 , as described by Chase et al.Citation48
Zeff was calculated from electrophoretic mobility using Equation 5 .
Determination of pI for MAB 1 and variants by capillary isoelectric focusing
The pI values for MAB1 and variants were determined via capillary isoelectric focusing (cIEF) using a ProteinSimple iCE3 instrument and the iCE Chemical Test kit (ProteinSimple, part no. 101801). Anolyte and catholyte solutions were prepared as per the manufacturer instructions. The samples for injection contained 0.3 mg/ml protein, 4% Pharmalyte pH 3–10 (GE part no. 17-0456-01), 2.0 M urea, 0.25% methyl cellulose (ProteinSimple, part no. 101876), 0.01 mg/ml pI Marker 6.14 (ProteinSimple, part no. 102220), and 0.01 mg/ml pI Marker 9.50 (ProteinSimple, part no. 101996). The capillary was cIEF Cartridge Column (Fluorocarbon Coated, 100 mm ID × 50 mm, ProteinSimple part no. 101701). The samples were prefocused at 1500 V for 1 min followed by a 3000 V focusing period of 6 min. UV detection wavelength was at 280 nm and the iCE CFR software was used to calibrate the UV image with the pI markers to determine the sample pI.
Concentrate-ability
To assess ability to concentrate the protein, MAB 1 Control, M1 and variants (M2-M6) were concentrated up to 50–130 mg/mL using Amicon® Ultra-4 Centrifugal Filters, 10,000 NMWL cut off. The centrifugation was performed at 4000 RPM at 15°C.
Apparent solubility by PEG precipitation
The absolute solubility for MAB 1 and variants could not be determined because of the limited amounts of available materials. However, apparent solubility measurements of MAB 1 and its variants were carried out to estimate the change in solubility of MAB 1 upon point mutations. These measurements were performed using a PEG precipitation method as described earlierCitation51 with minor modifications. A 47% (w/w) PEG stock solution was prepared by dissolving PEG 12 k into 20 mM histidine/histidine-HCl buffer, pH 6.0. The solutions of MAB 1 and its variants were diluted to a protein concentration of 10 mg/mL using the same buffer. From solutions of MAB 1 and each of its variant antibodies, 50 μL samples were used for this analysis. Aliquots of the stock PEG solution were pipetted into each sample, 0.5 μL at a time. Each antibody sample and PEG aliquot was thoroughly mixed by pipetting the solutions up and down, so as to avoid subjecting the mAb to unnecessary shear stress. Additional aliquots of PEG were added until the antibody started to precipitate. The minimum amount of PEG required to cause precipitation (confirmed via visual inspection) of the antibody was then calculated and used as a relative apparent solubility score for the antibody sample. The measurements were repeated thrice for each antibody solution.
Concentration dependent viscosity measurements by Cone and Plate rheology
Viscosity data were generated on MAB 1 and variants in the following formulation buffer: 20 mM histidine/histidine-HCl buffer, 5% (w/v) sucrose at pH 6.0. MAB 1 and its variants were concentrated to their solubility limits and then a serial dilution was performed for viscosity measurements. The procedures followed for concentrating, diluting and measuring viscosity of MAB 1 and its variants were the same as described in our earlier report.Citation7 All samples were buffer exchanged extensively against their off-set buffers using centrifugal concentrators. The off-set buffers were based on the method developed by Bolton et al.,Citation52 to compensate for the Donnan effect. The formulation does not contain any added salt, and all the samples were buffer-exchanged extensively so that ions carried over from the purification train were removed as much as possible. Solutions of MAB 1 and variants behaved as Newtonian solutions during the viscosity measurements, showing no significant fluctuations among different readings.
Experimentally measured viscosity data on MAB 1 Control, M1, M3 and M6 was analyzed using common viscosity and solute concentration relationships.Citation35 The following equations were used:
Differential scanning calorimetry
The DSC experiments were performed with a GE Healthcare Life Sciences MicroCal™ VP-Capillary DSC system using a scan rate of 60°C/h over the temperature range of 20°C to 100°C. After achieving 100°C, the sample was cooled then reheated to determine if the unfolding events were reversible. The Origin software was used to process the data by subtracting the thermogram of the formulation buffer (20 mM histidine/histidine-HCl, 5% (w/v) sucrose, pH 6.0) from the thermogram of the sample. A baseline correction was performed, and then the thermogram was fit to determine midpoints (Tm) of the 3 thermal transitions.
Competitive binding ELISA
Dilutions of MAB 1 within the concentration range of 0.0009–15 μg/mL were mixed with 10 ng/mL of a custom-made proprietary biotin-labeled MAB 1 target antigen. The mixtures were then transferred to a 96-well plate that had been coated with the antigen receptor, a custom-made proprietary receptor fusion protein, to enable binding of antigen to the coated receptor. After incubation for approximately 2 h at the room temperature, the 96-well plate was washed to remove MAB 1: biotin–antigen complex unbound to the coated receptor. The amount of bound biotin-labeled antigen protein was detected using horseradish peroxidase-conjugated streptavidin (Southern Biotech catalog #7100–05). After incubation for approximately one h at room temperature, the plate was washed to remove unbound streptavidin, and a solution of 3, 3′, 5, 5′-tetramethyl benzidine (TMB) substrate (Surmodics, catalog TMB-1000-01) was added to generate a colorimetric reaction. The resulting intensity of the blue coloration is proportional to the amount of bound biotin-labeled antigen protein. After 30 min of incubation at room temperature, the reaction was quenched by the addition of 0.18 M H2SO4 (Fischer Scientific, catalog #A300), which generated a yellow coloration. The optical density (absorbance) of each well in the plate was recorded at 450 nm using Molecular Devices M5 plate reader and SoftMax Pro software for data analysis. These absorbance data were used to construct a dose response curve (% maximum response against log MAB 1 concentration), from which the bioequivalence (i.e., parallelism) and relative biological activity of a standard vs. test sample was assessed. This same procedure was followed for all variants of MAB 1.
Disclosure of Potential Conflicts of Interest
No potential conflicts of interest were disclosed.
Supplemental_Material.pdf
Download PDF (1.4 MB)Acknowledgments
Pfizer Business Technology is thanked for computational facilities. PMB acknowledges Pfizer Inc. for a postdoctoral fellowship. Aadi Krishnan is thanked for help with viscosity experiments. Dr. Madan Katragadda is acknowledged for help with constructing DNA vectors for the MAB 1 variants. Dr. Vidhya Ramamurthy is thanked for coordinating Syngene's efforts at expressing and purifying MAB 1 and variants and Dr. Angela Widom is thanked for liaising between Pfizer and Syngene. SK thanks Drs. Chandra Webb, Monika Geiger and Donna Luisi for several stimulating discussions on viscosity of highly concentrated antibody formulations. Mr. Joseph McLaughlin, Dr. John Reusch, Dr. Chee-Keng Ng, Dr. David Cirelli and Prof. Peter Tessier are thanked for critical reading and suggestions to improve the manuscript.
Funding
The authors thank Pfizer Technology and Innovation for funding this work.
Supplemental Material
Supplemental data for this article can be accessed on thepublisher's website.
Related Research Data
References
- Johnson HR, Lenhoff AM. Characterization and suitability of therapeutic antibody dense phases for subcutaneous delivery. Mol Pharm 2013; 10:3582-91; PMID:24011376
- Narasimhan C, Mach H, Shameem M. High-dose monoclonal antibodies via the subcutaneous route: challenges and technical solutions, an industry perspective. Ther Deliv 2012; 3:889-900; PMID:22900469; http://dx.doi.org/10.4155/tde.12.68
- Galush WJ, Le LN, Moore JM. Viscosity behavior of high-concentration protein mixtures. J Pharm Sci 2012; 101:1012-20; PMID:22170353; http://dx.doi.org/10.1002/jps.23002
- Jezek J, Rides M, Derham B, Moore J, Cerasoli E, Simler R, Perez-Ramirez B. Viscosity of concentrated therapeutic protein compositions. Adv Drug Deliv Rev 2011; 63:1107-17; PMID:22014592; http://dx.doi.org/10.1016/j.addr.2011.09.008
- Liu J, Nguyen MD, Andya JD, Shire SJ. Reversible self-association increases the viscosity of a concentrated monoclonal antibody in aqueous solution. J Pharm Sci 2005; 94:1928-40; PMID:16052543; http://dx.doi.org/10.1002/jps.20347
- Warne NW. Development of high concentration protein biopharmaceuticals: the use of platform approaches in formulation development. Eur J Pharm Biopharm 2011; 78:208-12; PMID:21406226; http://dx.doi.org/10.1016/j.ejpb.2011.03.004
- Li L, Kumar S, Buck PM, Burns C, Lavoie J, Singh SK, Warne NW, Nichols P, Luksha N, Boardman D. Concentration dependent viscosity of monoclonal antibody solutions: explaining experimental behavior in terms of molecular properties. Pharm Res 2014; 31:3161-78; PMID:24906598
- Connolly BD, Petry C, Yadav S, Demeule B, Ciaccio N, Moore JM, Shire SJ, Gokarn YR. Weak interactions govern the viscosity of concentrated antibody solutions: high-throughput analysis using the diffusion interaction parameter. Biophys J 2012; 103:69-78; PMID:22828333; http://dx.doi.org/10.1016/j.bpj.2012.04.047
- Fesinmeyer RM, Hogan S, Saluja A, Brych SR, Kras E, Narhi LO, Brems DN, Gokarn YR. Effect of ions on agitation- and temperature-induced aggregation reactions of antibodies. Pharm Res 2009; 26:903-13; PMID:19104916; http://dx.doi.org/10.1007/s11095-008-9792-z
- Lilyestrom WG, Yadav S, Shire SJ, Scherer TM. Monoclonal antibody self-association, cluster formation, and rheology at high concentrations. J Phys Chem B 2013; 117:6373-84; PMID:23560896; http://dx.doi.org/10.1021/jp4008152
- Laue T. Proximity energies: a framework for understanding concentrated solutions. J Mol Recognit 2012; 25:165-73; PMID:22407980; http://dx.doi.org/10.1002/jmr.2179
- Wang X, Singh SK, Kumar S. Potential aggregation-prone regions in complementarity-determining regions of antibodies and their contribution towards antigen recognition: a computational analysis. Pharm Res 2010; 27:1512-29; PMID:20422267; http://dx.doi.org/10.1007/s11095-010-0143-5
- Fernandez-Escamilla AM, Rousseau F, Schymkowitz J, Serrano L. Prediction of sequence-dependent and mutational effects on the aggregation of peptides and proteins. Nat Biotechnol 2004; 22:1302-6; PMID:15361882; http://dx.doi.org/10.1038/nbt1012
- Tartaglia GG, Pawar AP, Campioni S, Dobson CM, Chiti F, Vendruscolo M. Prediction of aggregation-prone regions in structured proteins. J Mol Biol 2008; 380:425-36; PMID:18514226; http://dx.doi.org/10.1016/j.jmb.2008.05.013
- Pechmann S, Levy ED, Tartaglia GG, Vendruscolo M. Physicochemical principles that regulate the competition between functional and dysfunctional association of proteins. Proc Natl Acad Sci U S A 2009; 106:10159-64; PMID:19502422; http://dx.doi.org/10.1073/pnas.0812414106
- Buck PM, Kumar S, Singh SK. On the role of aggregation prone regions in protein evolution, stability, and enzymatic catalysis: insights from diverse analyses. PLoS Comp Biol 2013; 9:e1003291
- Kumar S, Sham YY, Tsai CJ, Nussinov R. Protein folding and function: the N-terminal fragment in adenylate kinase. Biophys J 2001; 80:2439-54; PMID:11325743; http://dx.doi.org/10.1016/S0006-3495(01)76213-3
- Creighton TE. Proteins: Structures and Molecular Properties, Second Edition. New York: W. H. Freeman, 1993
- Bingham JT, Blasina A, Chapman JG, Haubrich TA, Jani JP, Ladetzki-Baehs K, North MA, Ponsel D, Tesar M. Osteopontin Antibodies. WO2011/021146 A1. In: World Intellectual Property Organization IB, ed. PCT. USA: Pfizer Inc, 2011:80-3
- Robinson NE, Robinson AB. Prediction of primary structure deamidation rates of asparaginyl and glutaminyl peptides through steric and catalytic effects. J Pept Res 2004; 63:437-48; PMID:15140161; http://dx.doi.org/10.1111/j.1399-3011.2004.00148.x
- Garber E, Demarest SJ. A broad range of Fab stabilities within a host of therapeutic IgGs. Biochem Biophys Res Commun 2007; 355:751-7; PMID:17321501; http://dx.doi.org/10.1016/j.bbrc.2007.02.042
- Corrada D, Morra G, Colombo G. Investigating allostery in molecular recognition: insights from a computational study of multiple antibody-antigen complexes. J Phys Chem B 2013; 117:535-52; PMID:23240736; http://dx.doi.org/10.1021/jp310753z
- Corrada D, Colombo G. Energetic and dynamic aspects of the affinity maturation process: characterizing improved variants from the bevacizumab antibody with molecular simulations. J Chem Inf Model 2013; 53:2937-50; PMID:24168661; http://dx.doi.org/10.1021/ci400416e
- Saltzman WM, Radomsky ML, Whaley KJ, Cone RA. Antibody diffusion in human cervical mucus. Biophys J 1994; 66:508-15; PMID:8161703; http://dx.doi.org/10.1016/S0006-3495(94)80802-1
- Yadav S, Scherer TM, Shire SJ, Kalonia DS. Use of dynamic light scattering to determine second virial coefficient in a semidilute concentration regime. Anal Biochem 2011; 411:292-6; PMID:21156151; http://dx.doi.org/10.1016/j.ab.2010.12.014
- Saluja A, Fesinmeyer RM, Hogan S, Brems DN, Gokarn YR. Diffusion and sedimentation interaction parameters for measuring the second virial coefficient and their utility as predictors of protein aggregation. Biophys J 2010; 99:2657-65; PMID:20959107; http://dx.doi.org/10.1016/j.bpj.2010.08.020
- Saito S, Hasegawa J, Kobayashi N, Kishi N, Uchiyama S, Fukui K. Behavior of monoclonal antibodies: relation between the second virial coefficient (B (2)) at low concentrations and aggregation propensity and viscosity at high concentrations. Pharm Res 2012; 29:397-410; PMID:21853361; http://dx.doi.org/10.1007/s11095-011-0563-x
- Jayaraman J, Wu J, Brunelle MC, Cruz AM, Goldberg DS, Lobo B, Shah A, Tessier PM. Plasmonic measurements of monoclonal antibody self-association using self-interaction nanoparticle spectroscopy. Biotechnol Bioeng 2014; 111:1513-20; PMID:25097914; http://dx.doi.org/10.1002/bit.25221
- Wang X, Kumar S, Buck PM, Singh SK. Impact of deglycosylation and thermal stress on conformational stability of a full length murine igG2a monoclonal antibody: observations from molecular dynamics simulations. Proteins 2013; 81:443-60; PMID:23065923; http://dx.doi.org/10.1002/prot.24202
- Buck PM, Kumar S, Singh SK. Consequences of glycan truncation on Fc structural integrity. MAbs 2013; 5:904-16; PMID:24492344; http://dx.doi.org/10.4161/mabs.26453
- Hristodorov D, Fischer R, Joerissen H, Muller-Tiemann B, Apeler H, Linden L. Generation and comparative characterization of glycosylated and aglycosylated human IgG1 antibodies. Mol Biotechnol 2013; 53:326-35; PMID:22427250; http://dx.doi.org/10.1007/s12033-012-9531-x
- Hossler P, Khattak SF, Li ZJ. Optimal and consistent protein glycosylation in mammalian cell culture. Glycobiology 2009; 19:936-49; PMID:19494347; http://dx.doi.org/10.1093/glycob/cwp079
- Nallet S, Fornelli L, Schmitt S, Parra J, Baldi L, Tsybin YO, Wurm FM. Glycan variability on a recombinant IgG antibody transiently produced in HEK-293E cells. N Biotechnol 2012; 29:471-6; PMID:22401955; http://dx.doi.org/10.1016/j.nbt.2012.02.003
- Croset A, Delafosse L, Gaudry JP, Arod C, Glez L, Losberger C, Begue D, Krstanovic A, Robert F, Vilbois F, et al. Differences in the glycosylation of recombinant proteins expressed in HEK and CHO cells. J Biotechnol 2012; 161:336-48; PMID:22814405; http://dx.doi.org/10.1016/j.jbiotec.2012.06.038
- Creighton TE. The Physical and Chemical Basis of Molecular Biology. UK: Helvetian Press, 2010
- Phillips JC, Braun R, Wang W, Gumbart J, Tajkhorshid E, Villa E, Chipot C, Skeel RD, Kale L, Schulten K. Scalable molecular dynamics with NAMD. J Comput Chem 2005; 26:1781-802; PMID:16222654; http://dx.doi.org/10.1002/jcc.20289
- Guo Z, Chen A, Nassar RA, Helk B, Mueller C, Tang Y, Gupta K, Klibanov AM. Structure-activity relationship for hydrophobic salts as viscosity-lowering excipients for concentrated solutions of monoclonal antibodies. Pharm Res 2012; 29:3102-9; PMID:22692671; http://dx.doi.org/10.1007/s11095-012-0802-9
- Kamerzell TJ, Pace AL, Li M, Danilenko DM, McDowell M, Gokarn YR, Wang YJ. Polar solvents decrease the viscosity of high concentration IgG1 solutions through hydrophobic solvation and interaction: formulation and biocompatibility considerations. J Pharm Sci 2013; 102:1182-93; PMID:23359242; http://dx.doi.org/10.1002/jps.23453
- Srinivasan C, Weight AK, Bussemer T, Klibanov AM. Non-aqueous suspensions of antibodies are much less viscous than equally concentrated aqueous solutions. Pharm Res 2013; 30:1749-57; PMID:23543302; http://dx.doi.org/10.1007/s11095-013-1017-4
- Yadav S, Liu J, Shire SJ, Kalonia DS. Specific interactions in high concentration antibody solutions resulting in high viscosity. J Pharm Sci 2010; 99:1152-68; PMID:19705420; http://dx.doi.org/10.1002/jps.21898
- Yadav S, Sreedhara A, Kanai S, Liu J, Lien S, Lowman H, Kalonia DS, Shire SJ. Establishing a link between amino acid sequences and self-associating and viscoelastic behavior of two closely related monoclonal antibodies. Pharm Res 2011; 28:1750-64; PMID:21626060; http://dx.doi.org/10.1007/s11095-011-0410-0
- Yadav S, Laue TM, Kalonia DS, Singh SN, Shire SJ. The influence of charge distribution on self-association and viscosity behavior of monoclonal antibody solutions. Mol Pharm 2012; 9:791-802; PMID:22352470; http://dx.doi.org/10.1021/mp200566k
- Chaudhri A, Zarraga IE, Yadav S, Patapoff TW, Shire SJ, Voth GA. The role of amino acid sequence in the self-association of therapeutic monoclonal antibodies: insights from coarse-grained modeling. J Phys Chem B 2013; 117:1269-79; PMID:23316912; http://dx.doi.org/10.1021/jp3108396
- Zarraga IE, Taing R, Zarzar J, Luoma J, Hsiung J, Patel A, Lim FJ. High shear rheology and anisotropy in concentrated solutions of monoclonal antibodies. J Pharm Sci 2013; 102:2538-49; PMID:23873347; http://dx.doi.org/10.1002/jps.23647
- Singh SN, Yadav S, Shire SJ, Kalonia DS. Dipole-dipole interaction in antibody solutions: correlation with viscosity behavior at high concentration. Pharm Res 2014; 31:2549-58; PMID:24639233
- Heinig M, Frishman D. STRIDE: a web server for secondary structure assignment from known atomic coordinates of proteins. Nucleic Acids Res 2004; 32:W500-2; PMID:15215436; http://dx.doi.org/10.1093/nar/gkh429
- Brooks BR, Brooks CL, 3rd, Mackerell AD, Jr., Nilsson L, Petrella RJ, Roux B, Won Y, Archontis G, Bartels C, Boresch S, et al. CHARMM: the biomolecular simulation program. J Comput Chem 2009; 30:1545-614; PMID:19444816; http://dx.doi.org/10.1002/jcc.21287
- Chase SF, Laue TM. The determination of protein valence by capillary electrophoresis. Beckman Coulter PACE Setter 2008; 12(1):1-12
- Winzor DJ, Jones S, Harding SE. Determination of protein charge by capillary zone electrophoresis. Anal Biochem 2004; 333:225-9; PMID:15450796; http://dx.doi.org/10.1016/j.ab.2004.05.013
- Durant JA, Chen C, Laue TM, Moody TP, Allison SA. Use of T4 lysozyme charge mutants to examine electrophoretic models. Biophys Chem 2002; 101-102:593-609; PMID:12488029
- Li L, Kantor A, Warne N. Application of a PEG precipitation method for solubility screening: a tool for developing high protein concentration formulations. Protein Sci 2013; 22:1118-23; PMID:23740802; http://dx.doi.org/10.1002/pro.2289
- Bolton GR, Boesch AW, Basha J, Lacasse DP, Kelley BD, Acharya H. Effect of protein and solution properties on the Donnan effect during the ultrafiltration of proteins. Biotechnol Prog 2011; 27:140-52; PMID:21312362; http://dx.doi.org/10.1002/btpr.523