
Abstract
Monoclonal antibodies (mAbs) against human proteins are the primary protein capture reagents for basic research, diagnosis, and molecular therapeutics. The 2 most important attributes of mAbs used in all of these applications are their specificity and avidity. While specificity of a mAb raised against a human protein can be readily defined based on its binding profile on a human proteome microarray, it has been a challenge to determine avidity values for mAbs in a high-throughput and cost-effective fashion. To undertake this challenge, we employed the oblique-incidence reflectivity difference (OIRD) platform to characterize mAbs in a protein microarray format. We first systematically determined the Kon and Koff values of 50 mAbs measured with the OIRD method and deduced the avidity values. Second, we established a multiplexed approach that simultaneously measured avidity values of a mixture of 9 mono-specific mAbs that do not cross-react to the antigens. Third, we demonstrated that avidity values of a group of mAbs could be sequentially determined using a flow-cell device. Finally, we implemented a sequential competition assay that allowed us to bin multiple mAbs that recognize the same antigens. Our study demonstrated that OIRD offers a high-throughput and cost-effective platform for characterization of the binding kinetics of mAbs.
Abbreviations
| OIRD | = | oblique-incidence reflectivity difference |
| mAb | = | monoclonal antibody |
| IP | = | immunoprecipitation |
| IHC | = | immunohistochemistry |
| ICC | = | immunocytochemistry |
| ChIP | = | chromatin immunoprecipitation |
| HuProt | = | human proteome microarray |
| ELISA | = | enzyme-linked immunosorbent assay |
| ITC | = | isothermal titration calorimetry |
| SPR | = | surface plasmon resonance spectroscopy |
| OE | = | optical ellipsometry |
| RIFS | = | reflectometric interference spectroscopy |
| PEM | = | photo-elastic modulator |
| 2-D | = | two dimensional |
Introduction
Protein affinity reagents are fundamental tools of both basic and applied biomedical research. They are used for a wide range of applications, including measurement of protein expression levels, detection of protein-protein and protein-nucleic acid interactions, and detection of disease biomarkers.Citation1 For obvious reasons, renewable affinity reagents, such as monoclonal (mAb) and recombinant antibodies, that each recognize a single protein epitope, are desirable for most applications.Citation2,Citation3
Specificity and avidity are the 2 most important attributes for affinity reagents. Ideally, a renewable affinity reagent should be of both high specificity and high affinity. However, previous studies demonstrated that many commercially available mAbs cross-react extensively with other cellular antigens, and some may not even recognize their purported targets.Citation4-Citation7 To analyze the specificity of antibodies generated against viral,Citation8 microbialCitation9,Citation10 and mammalian proteins,Citation11-Citation14 a protein microarray-based approach has been previously reported to determine potential cross-reactivity. For example, protein microarrays, composed of protein epitope signature tags (PrESTs), have been implemented as part of the Human Protein Atlas projects, one of the several ongoing large-scale efforts to systematically identify high-grade antibodies against much of the human proteome.Citation15-Citation18 With advances in proteome microarray technology, such as the E. coli, yeast, and HuProt™ arrays, specificity of an antibody can now be surveyed against the entirety or majority of an organism's proteome.Citation9,Citation19-Citation21 Mono-specificity of an antibody reagent is thus established only when it recognizes a single antigen on a proteome microarray.Citation9,Citation21
Measurement of a reagent's affinity/avidity value, on the other hand, is equally important. It is generally believed that high affinity antibodies are more biologically reactive than low affinity antibodies, which is particularly important for antibody-based therapeutics. Moreover, high affinity antibodies might be useful for a variety of end uses, such as immunoprecipitation (IP), immunohischemistry (IHC), immunocytochemistry (ICC), flow cytometry, and chromatin immunoprecipitation (ChIP). Finally, providing affinity values of commercial antibodies will enable a new industrial standard in the antibody field and allow researchers to directly compare antibodies from different commercial sources. However, a concern with high affinity antibodies (e.g., those with KD values in the low nanomolar range) has always been the possibility of increased levels of potential cross-reactivity. Therefore, it is important to determine the affinity values for mono-specific mAbs.
In the past, the quantitative aspects of antigen-antibody interactions have been studied with a variety of methods, such as enzyme-linked immunosorbent assays (ELISA), isothermal titration calorimetry (ITC), and fluorescence anisotropy, which utilize either thermodynamic or kinetic approaches.Citation22 However, because these assays require large amounts of the analytes and because they are time-consuming and labor-intensive, they are not amenable to high-throughput determination of affinity values.
To remedy this situation, we have employed an optical technique, termed oblique-incidence reflectivity difference (OIRD), for quantitative measurement of antigen-antibody interactions. Indeed, optical techniques of various types are emerging as an important tool for monitoring the dynamics of biomolecule interactions on a solid surface. For instance, imaging surface plasmon resonance spectroscopy (SPR),Citation23,Citation24 imaging optical ellipsometry (OE),Citation25 and reflectometric interference spectroscopy (RIFS)Citation26 are 3 label-free optical techniques that in essence measure the same optical dielectric response of a thin film and thereby detect changes of physical or chemical properties of the thin film such as thickness and mass density during biochemical reactions. Compared with the above 3 methods, the OIRD technique is a more sensitive form of ellipsometry that measures the difference in reflectivity between the s- and p-polarized lights.Citation27,Citation28 It has a time resolution of 20 microseconds, a space resolution (i.e., thickness) of 0.4 nanometer, and a detection sensitivity of 14 fg of protein per spot. In addition, it also shares other advantages of the SPR and OE methods, such as non-contacting, non-damage and label-free detection.Citation29,Citation30 Recently, the OIRD technique has been applied to detect DNA hybridization, protein-protein, and protein-DNA interactions in a microarray format in a real-time fashion and these studies demonstrated its potential as a high-throughput detection method that can obtain association and dissociation rates of biomolecular interactions.Citation30-Citation32 However, no effort has been reported to systematically determine the detection limit of OIRD or to further transform it into a real high-throughput platform via fully exploiting its potential in characterization of binding kinetics. Therefore, we employed a large number of mono-specific monoclonal antibodies that were raised against human transcription factors, in order to demonstrate the development of OIRD as a fast and high-throughput platform for characterization of antibody binding kinetics.
Results
Kinetics measurement of mAbs in a multi-channel flow cell
The basic layout of the OIRD system is sketched in . A 632.8 nm wavelength p-polarized He-Ne laser beam passes through a photo-elastic modulator (PEM), which modulates the probe beam to oscillate between p- and s-polarization at a constant frequency Ω at 50 KHz, followed by passing a phase shifter that introduces a variable phase between p- and s-polarization. Then, the beam is focused on the glass surface at a 60° incident angle (θ inc). After a polarization analyzer, the reflected beam is detected by a silicon photodiode. Finally, the first harmonic I (Ω) and second harmonic I (2Ω) of the AC components after photodiode are simultaneously monitored by 2 digital lock-in amplifiers (see Methods).Citation30 The difference caused by changes in reflectivity between the s- and p-polarized lights, namely the OIRD signal, is “Δp−Δs,” composed of both real and imaginary components. Because the imaginary component, which is proportional to the first I (Ω), is more sensitive on the epoxy slide, the imaginary part of OIRD signal is determined as “Im{Δp−Δs} ,” which is dependent on the incident angle (θ inc) and the dielectric constants of the ambient (e.g., liquid layer covering the antigen arrays), spotted antigens, and substrate of the microarray (i.e., glass).Citation33
Figure 1. Multi-chamber flow cell design for OIRD device. (A) Design of the flow cell reaction chamber for the OIRD device. (B) Top: a custom-made scaffold is made of stainless steel with 4 inlets and outlets attached. Bottom: A rubber pad (orange color) with 4 rectangular holes was mounted onto a glass slide to generate 4 chambers that each contained an identical sub-array of immobilized antigens. (C) A picture of the OIRD device. (D) Fitted OIRD sensorgrams obtained at 3 concentrations of anti-ZFYVE20 mAbs using the flow cell device.
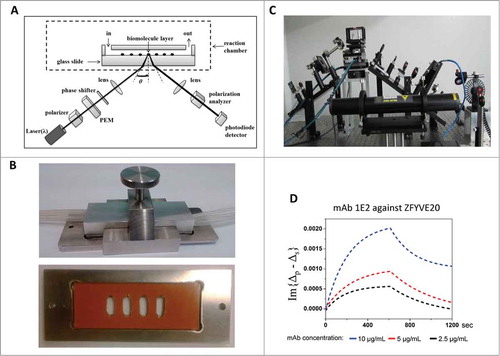
To enable simultaneous monitoring of binding kinetics of mAbs at different concentrations, we created a multi-chamber flow-cell for the OIRD device (). In this design, a rubber pad with 4 rectangular holes was mounted onto a glass slide to generate 4 chambers that each contained an identical sub-array of immobilized antigens (see Methods). A cover glass with 8 holes, half connected to the inlets and the other half to the outlets, was then placed on top of the pad. The whole assembly was then placed and tightened in the stainless steel manifold with 4 inlet and 4 outlet tubings attached to the 8 holes on the cover glass (). After the inlet tubings are connected to a buffer tank, the buffer can be pumped into the flow-cells at a desired rate controlled by a dispensing peristaltic pump and the waste collected through the outlets to the waste tank.
We next tested whether this flow-cell design can be used to simultaneously measure the binding kinetics at different concentrations of 2 different mAbs, both raised against ZFYVE20, an endosomal membrane protein that regulates protein trafficking. As described above, purified ZFYVE20 proteins were printed in quadruplicate on a glass slide to form 4 sub-arrays. After blocking the antigen slides with 1% BSA in TBS buffer, a mono-specific mAb 1E2 raised against ZFYVE20, was pumped into the flow-cells at 3 different concentrations (i.e., 2.5, 5.0, and 10.0 μg/mL). After the binding signals reach saturation as judged by the OIRD sensorgram in real-time, wash buffers were pumped into the flow-cells while the OIRD device continued to record the signals. As illustrated in , both on- and off-curves could be readily obtained and extracted from original data for 1E2 at 3 different initial concentrations. Using a computer simulation algorithm as reported previously,Citation30 the Kon / Koff values were determined for each concentration of the added 1E2. By taking the Kon / Koff ratio at each concentration, the deduced average KD value of 1E2 was determined as 28.0 nM. When the same procedure was applied to another mono-specific mAb 1C3 against ZFYVE20, its avidity values was determined to be 34.9 nM (Fig. S1). Therefore, the multi-flow-cell design allowed rapid measurement of KD values.
To establish the OIRD method as a high-throughput platform for avidity measurement of mAbs, we decided to determine avidity values of 50 mono-specific mAbs raised against 19 different human antigens. Similar to the design described above, each purified antigen at 0.25 mg/mL was spotted in duplicate on an epoxy-grafted glass surface using a microarrayer to form 4 sub-antigen microarrays on a single glass slide. After mounting the flow cells, the antigen microarrays were blocked and a particular mAb was pumped into the flow cells at 3 different concentrations to obtain the Kon and Koff curves on the OIRD device. The KD value of a given mAb was then calculated by taking the average of the Koff / Kon ratios determined at different mAb concentrations. summarizes all of the obtained Koff and Kon values with the deduced KD for the 50 mAbs. While the Koff values showed a wide dynamic range of > 5E + 06, the Kon values also varied >50,000-fold (). More importantly, the deduced KD values also showed a 9-log dynamic range, from 2.92 μM (i.e., R359.1.1E4 against DBX2) to 3.80 fM (i.e., R451.1.4B4 against BATF), indicating that the sensitivity and dynamic range of the OIRD platform are at least comparable to the existing technologies, such as SPR. Because the entire procedure of measuring the kinetics of 50 mAb took less than 3 hrs to accomplish, and because the consumption of purified antigens was reduced to minimum, we conclude that the OIRD platform offers a fast and economic method for measuring affinity/avidity values of mAbs.
Table 1. Summary of binding kinetics of 50 mAbs
Multiplexed avidity measurement with the OIRD
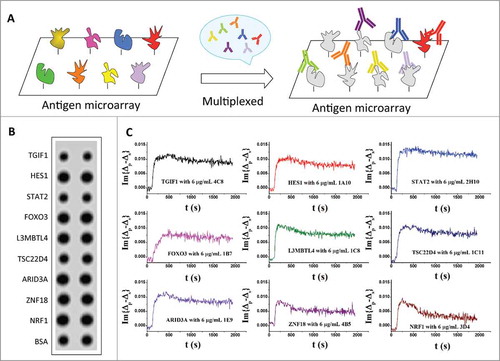
To further improve the throughput of the OIRD platform, we tested whether binding events for multiple mono-specific mAbs could be monitored simultaneously, given that there was no cross-reactivity among these mAbs (). We selected 9 mono-specific mAbs raised against 9 different antigens that showed highly specific interactions with the corresponding antigens without any detectable cross-reactivity as determined on our HuProt™ arrays in a mAb-binding assay (data not shown).Citation21 The 9 antigens were printed in duplicate to form the antigen microarrays (); the 9 mAbs were mixed at 3 different concentrations of 6, 3, and 1.5 μg/mL. After blocking, mixtures of the 9 mAbs were pumped into the flow cells while the binding kinetics were measured in real-time. As expected, each of the 9 mAbs showed different shapes in the OIRD sensorgrams (; Fig. S2A, S2B) and the deduced KD values covered a wide range (Table S1), indicating the success of the assay.
Figure 2. Multiplexed avidity measurement of mono-specific MAbs. (A) Design of the multiplexed avidity measurement. Nine different antigens were spotted to form the protein microarray. After blocking, 9 of their corresponding mono-specific mAbs were mixed at 3 different concentrations and pumped into the reaction chamber to obtain their individual binding kinetics. (B) OIRD image of spotted 9 antigens. (C) OIRD sensorgrams of 9 antigen-antibody interactions obtained simultaneously in a single reaction chamber.
Sequential avidity measurement with the OIRD
Because our ultimate goal is to achieve fully automated measurement of antibody avidity, non-interrupted sequential measurement of antigen-antibody binding kinetics is highly desirable. In addition, it is particularly useful when multiple monoclonal antibodies against the same antigen are to be characterized. To test its feasibility on the OIRD system, a protein microarray composed of 3 antigens, TSC22D4, ZNF18, and NRF1, and a negative control protein BSA, was formed to test whether the KD values of their corresponding mAbs could be determined sequentially. After blocking the microarrays, a 2-D OIRD image was obtained (Image (1); ). Next, binding buffer containing 15 μg/mL of anti-TSC22D4 mAb was pumped into the flow cell, while the real-time OIRD signals were being recorded until the very end of all the binding events. After the on-curve reached saturation, wash buffer was pumped in until the off-curve was stabilized, at which point the second 2-D OIRD image was obtained (Image (2); ). Without regenerating the surface, an anti-ZNF18 mAb at the same concentration was pumped into the flow cell, and the entire measuring process was repeated, resulting in Image (3) (). Finally, the same procedure was repeated for anti-NRF1 (Image (4); ). Because OIRD measures the binding events by taking differences in the OIRD signals, the binding results of anti-TSC22D4 mAb could be visualized by subtracting Image (1) from Image (2) (lower left panel; ). Likewise, specific binding of anti-ZNF18 and anti-NRF1 mAbs was measured by subtracting Image (2) from (3), and Image (3) from (4), respectively (Lower middle and right panels; ). To ensure reproducibility, the same binding assays were performed at 2 lower concentrations (). Only the expected antigen spots were detected in each sequential binding event, with no detectable signals observed on BSA spots or empty areas (Low panels; ), indicating the success of the design and little to no interference between different mAbs.
Figure 3. Sequential measurement of mAb avidity values. (A) 2-D images of the OIRD binding assay. After protein microarray composed of 3 antigens, TSC22D4, ZNF18, and NRF1, and a negative control protein BSA, was formed and blocked with BSA, a 2-D OIRD Image (1) was obtained. Next, after 15 μg/mL of anti-TSC22D4 mAb was pumped into the reaction chamber and reached saturation, wash buffer was pumped in until the off-curve was stabilized, at which point the second 2-D OIRD Image (2) was obtained. Without regenerating the surface, anti-ZNF18 at the same concentration was pumped into the reaction chamber, and the entire measuring process was repeated, resulting in Image (3). Finally, the same procedure was repeated for anti-NRF1 to generate Image (4). Because OIRD measures the binding events by taking differences in the OIRD signals, the binding results of anti-TSC22D4 mAb could be visualized by subtracting Image (1) from Image (2) (lower left panel). By the same token, the binding results of anti-ZNF18 and anti-NRF1 mAbs were obtained by subtracting Image (2) from (3) (Lower mid panel), and Image (3) from (4) (Lower right panel), respectively. (B) Real-time kinetics for all 3 mAb were also obtained during the entire binding and washing steps. When the on- and off-curves of each mAb measured at 3 different concentrations were plotted together, they all showed similar trend and concentration-dependent changes in the shapes of the curves. The calculated KD for each mAb are also shown.
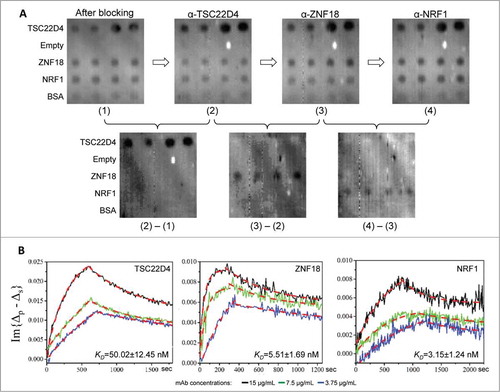
More importantly, real-time kinetics for all 3 mAb could be readily obtained during the entire binding and washing steps (). When the on- and off-curves of each mAb measured at 3 different concentrations were plotted together, they all showed similar trend and concentration-dependent changes in the shapes of the curves. The small error ranges of the average values of the calculated KD for each mAb indicated high reproducibility of the measurement.
Epitope binning using a competition assay
When multiple mAbs recognize the same antigen, determining their preference for the same or different epitopes on the target molecule becomes a crucial factor in their evaluation. Separating these mAbs into groups (bins) with a common preference for the same epitope helps researchers further characterize the specificity of the clones and their ability to block target activity, which can have far reaching effects on the mAbs’ efficacy and pharmacokinetics. Once the sequential monitoring of binding kinetics was established, we next tested whether the OIRD platform could be used to bin multiple mAbs raised against the same antigen. In a proof-of-principle assay, we fabricated a protein microarray by spotting 2 individual antigens, i.e., HES1 and NRF1, as well as a mixture of HES1 and NRF1. When an anti-HES1 mAb was first pumped into the flow cell, 2 on-curves could be immediately observed on the HES1 and HES1/NRF1 spots, but no binding signals could be detected on the NRF1 spot (left panel; ), as expected. The relatively weaker OIRD signals on the HES1/NRF1 spot might reflect different surface occupancy by the HES1. Next, after an anti-NRF1 mAb was pumped into the flow cell, we observed an additional increase in the OIRD signals on the HES1/NRF1 spot, as well as the expected increase on the NRF1 spot, indicating a secondary binding event happened on the HES1/NRF1 mixture spot. In contrast, no further increase was observed on the HES1 spot. As expected, a secondary increase in the OIRD signals at the HES1/NRF1 spot was again observed when the order of application of the same 2 mAbs against HES1 and NRF1 was reversed, suggesting this design is likely to work for binning the epitopes (right panel; ).
Figure 4. Epitope binning using a competition assay. (A) A proof-of-principle assay. A protein microarray was fabricated by spotting 2 individual antigens, i.e., HES1 and NRF1, as well as a mixture of HES1 and NRF1. Left panel: An anti-HES1 mAb was first applied to the reaction chamber (as indicated by the left blue vertical line) and when OIRD signals reach saturation on HES1 and HES1/NRF1 spots, an anti-NRF1 mAb was pumped into the reaction chamber (as indicated by the right blue vertical line). Right panel: A similar assay was performed by reversing the application of the 2 mAbs. (B) Epitope binning of mAbs against HES1. Five mAbs raised against HES1 were selected to perform a pairwise comparison of their binding ability to their antigens. Because no additional increase of the OIRD signals was observed when the order of application of each mAb pair was reversed, they all recognized the same epitope on HES1 with different avidity in the order of 1B11>4A11>1A3>2C1. (C) Anti-HES1 mAb 2E8 was found to recognize a different epitope by 1B11. When anti-HES1 mAb 2E8 was tested with 1B11, a secondary increase in OIRD signals were observed regardless of the order in which they were applied, indicating that they recognized different epitopes on HES1 (Two leftmost panels). This conclusion was further supported by the similar observations when 2E8 was tested in pair with 4A11, 1A3, and 2C1. (D) ELISA validation of the epitope binning results obtained by OIRD. Using the traditional antigen-capture sandwich ELISA, one pair of anti-HES1 mAbs and one pair of anti-HMGB1 mAbs were tested. Shown are average ELISA signals plotted against input antigen concentration, a dose-dependent binding curve could be readily obtained and the signals reached saturation at higher antigen concentrations.
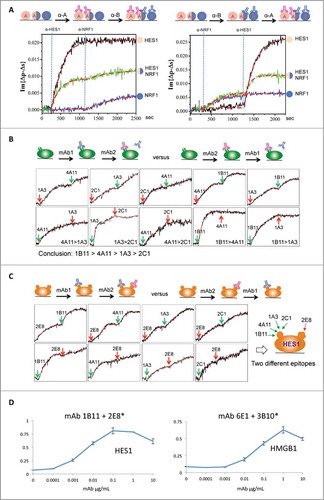
To establish the epitope binning approach in a real case scenario, we collected 5 and 3 mAbs raised against HES1 and HMGB1, respectively, to perform a pairwise comparison of their binding ability to their antigens. For example, when anti-HES1 mAbs 1A3 and 4A11 were sequentially pumped into the reaction chamber, 4A11 showed a further increase in the OIRD signals, suggesting that 4A11 either recognized a different epitope on HES1 or possessed a stronger avidity than 1A3 such that it could compete off 1A3 (upper leftmost panel; ). This ambiguity was resolved by reversing the order of the 2 mAbs in the OIRD measurement. The observation that 1A3 could not further increase the OIRD signals after 4A11 was first pumped into the reaction chamber confirmed that both mAbs recognized the same epitope with quite different affinities (lower leftmost panel, ). Indeed, additional pairwise OIRD measurement demonstrated that 4 mAbs 1B11, 4A11, 1A3, and 2C1 all recognized the same epitope of HES1 and have relative affinities in the order of 1B11>4A11>1A3>2C1 ().
On the other hand, when anti-HES1 mAb 2E8 was tested with 1B11, a secondary increase in OIRD signals were observed regardless of the order in which they were applied, indicating that they recognized different epitopes on HES1 (two leftmost panels, ). This conclusion was further supported by the similar observations when 2E8 was tested in pair with 4A11, 1A3, and 2C1 (). In a parallel assay, we concluded that mAbs 3B10 and 3A7 recognized different epitopes compared with 6E1 on HMGB1 ().
Finally, to confirm the OIRD generated functional epitope binning results, we employed the traditional antigen-capture sandwich ELISA and tested one pair of anti-HES1 mAbs and one pair of anti-HMGB1 mAbs, each predicted by OIRD to bind distinct epitopes on their targets. To do so, a capture mAb (e.g., 1B11 at 10 μg/mL) was first immobilized to an ELISA plate and blocked. A dilution series of antigen HES1 was added and incubated, and, after a wash step, biotinylated detection mAb (e.g., 2E8) at 2 μg/mL was added to the plate, incubated, washed, and binding signals detected by addition of streptavidin:HRP plus ABTS/H2O2 (see Methods). When average ELISA signals were plotted against input antigen concentration, a dose-dependent binding curve could be readily obtained and the signals reached saturation at higher antigen concentrations (). Taken together, these results demonstrated that OIRD offers an effective method to rapidly bin mAbs on the basis of their epitope recognition behavior.
Discussion
In this study, we established the OIRD platform as a high-throughput method that offers a reliable methodology to determine the avidity values of mAbs. Using a multi-flow-cell design, we demonstrated that multiplexed measurements of binding kinetics for mono-specific mAbs could be readily carried out at different mAb concentrations simultaneously. By implementing a sequential competition assay, we were able to bin multiple mAbs that recognize the same antigens.
In our opinion, the OIRD platform will have a tremendous impact on both the research and clinical communities. To this end, quality of a given commercial antibody is very difficult to evaluate on the basis of the information provided by the manufacturers. The dilemma that a researcher always faces is how to choose a “good” antibody from many others available from different commercial sources.Citation34 Because of a lack of quantitative standards, a researcher usually ends up randomly testing all available commercial antibodies of interest until one of them works for the desired experiment, resulting in a huge waste of efforts and resources. Therefore, the availability of affinity/avidity values in the form of Kon , Koff , and KD for most, if not all, of the commercially available antibodies will establish a new industrial standard in the antibody field that will allow researchers to directly compare antibodies from different commercial sources before purchasing them. Furthermore, measuring the affinity/avidity values of many commercial antibodies may provide us a useful proxy to determine whether a mAb of a high affinity/avidity (e.g., <1 nM) can be used to predict its end use, such as IP, ICC, IHC or ChIP. However, because of the high-cost and labor-intensive nature of avidity measurement using the existing technologies, it has been highly prohibitive to determine affinity/avidity values for hundreds to thousands of commercial antibodies.
We believe that, with further optimization and automation, the described protein microarray-based OIRD platform will offer a low-cost, high-throughput method to measure affinity/avidity values of tens of thousands of commercial antibodies. Based on our data, the OIRD can determine avidity values in the fM range (). At its current stage, the cost of using the OIRD platform is already many-fold cheaper than the traditional methods. As fabrication of an antigen array requires minute amounts of purified proteins (e.g., << 1 ng), the estimated cost per antigen array, assuming 20 antigens per array, is <$15. For each mAb, on the other hand, <50 μg of purified mAb is needed to determine its on- and off-curves at 3 different concentrations, yielding a total reagent cost of <$30 per antigen-antibody pair, far less than any other type of affinity/avidity measurement approach. With the current setup, 3 parallel measurements (i.e., 3 concentrations of mAbs) of antigen-antibody binding kinetics can be accomplished in 2000 sec (i.e., 33 min) and, therefore, 12 runs can be readily carried out per 8 hr working day. As we demonstrated above, the binding kinetics of 9 mAbs can be determined simultaneously and therefore, avidity values of a total of 108 (= 9 × 12) mAbs can be measured in a single day. This throughput can be easily improved by a factor of 9 via tripling the number of multiplexed antigen-mAb pairs and tripling the number of runs per day through automation. Obviously, improving the throughput will further reduce the cost. Furthermore, we believe that this OIRD platform can be readily adapted to evaluate the binding specificity of other types of protein avidity reagents, including recombinant antibodies and aptamers, because it is an ellipsometry-based, label-free method.
Materials and Methods
HuProt™ array construction
The cloning of human ORFs and protein purification was described previously.Citation21 ∼17,000 individually purified human proteins in full-length were printed, together with antigens in the form of protein domains, on Full Moon slides (Full Moon BioSystems, USA) with NanoPrint LM210 system (ArrayIT, USA).
Generation of hybridomas
N-terminal, Hisx6-tagged antigen proteins in the form of protein domains were expressed in and purified from E. coli (provided by Stephen Anderson, Rutgers University). 25 μg of each antigen in 25 μL 1X PBS was emulsified with an equal volume of Titermax adjuvant, and the mixture was introduced into one rear footpad of 6 to 8 weeks old BALB/c mice. Popliteal lymph nodes were harvested 14–16 d later and teased into single-cell suspensions. These immune cells were fused to Sp2/0-Ag14 myeloma cells with 50% PEG under standard conditions.Citation21 Fusion reactions were plated into 60 mm Petri dishes containing DMEM, HAT, HFCS, FBS and 1% methyl cellulose and incubated at 37°C under 5% CO2 atmosphere. Colonies were visualized with an inverted-stage dissecting microscope, harvested with microcapillary pipettes and transferred into 96-well plates containing DMEM/HAT for expansion. Supernatants of cell culture from individual wells were tested by ELISA for the presence of IgG, and antibody-positive wells were expanded into T-25 flasks to generate IgG-containing medium for subsequent antibody characterizations.
Identification of mono-specific mAbs using HuProt™ arrays
Diluted hybridoma supernatants (with antibodies at an average final concentration of 1.5 μg/mL in 1xPBS) were screened for antigen binding activity using a mini-array slide that contained 14 sub-arrays of the antigens used for the immunization separated with a multi-chamber gasket. To do so, each subarray of the mini-array slide was first blocked for 2 hr with 2% BSA in 1xPBS at RT and then incubated with a different mAb, plus rabbit anti-Hisx6 antibody, for 1 hr at RT, followed by 3 × 15 min washes in 1xTBST. The binding signals were visualized by incubating the mini-array with Cy5-labeled goat anti-mouse (diluted 1:800) and Cy3-labeled goat anti-rabbit (diluted 1:1000) (Invitrogen, USA) antibodies for 1 hr at RT. After the mini-array was subjected to 3×15 min washes in 1xTBST and a brief rinse in ddH2O, it was spun dry and scanned using a GenePix 4000B scanner (Molecular Devices, USA). Scanned images were analyzed using GenePix software, and proteins known to bind non-specifically to mouse IgG were excluded from further analysis. Signal intensities were calculated as median foreground minus median background signals in the Cy5 channel (i.e., bound mAb signals), and in the Cy3 channel (i.e., spotted antigen signals).
MAbs that recognized their expected targets on the mini-arrays were tested individually on the HuProt™ arrays to determine their binding profiles against 17,000 human proteins. Hybridoma supernatants (with antibodies at an average final concentration of 1.5 μg/ml in 1xPBS) were individually incubated on a separate HuProt™ array for 1 hr at RT along with rabbit anti-GST antibodies. The arrays were washed 3 × 15 min in 1xTBST, incubated with Cy5-labeled goat anti-mouse and Cy3-labeled goat anti-rabbit (Invitrogen, USA) in blocking buffer for 1 hr at RT, was washed 3 × 15 minutes in 1xTBST, rinsed once in ddH20, spun dry and scanned using a GenePix 4000B scanner (Molecular Devices, USA). Scanned images were analyzed using GenePix software. Signal intensity was then calculated as median foreground minus median background signals in the Cy5 channel (i.e., bound mAb signals), and the Cy3 channel (i.e., GST signals). To determine specificity, the mean and standard deviation of the signal intensity across all spots on the HuProt™ arrays was calculated. We then ranked the Cy5 signal intensity for any pair of spots, which we define as A, where An = (In −)/s. Here, In is the signal intensity (i.e., median foreground minus median background signals) for any given spot pair n on array I, is the mean signal intensity for all spots on the array I, and s is the standard deviation of signal intensity of array I. We next quantitatively evaluated the specificity of any individual mAb identified as potentially specific by means of this analysis. To do this, we calculated a value for specificity which we define as S , where S = A 1-A 2. Here, A 1 represents the spot pair on the array that shows the highest value of A , and A 2 represents the spot pair with the second highest value of A . A mAb was considered as mono-specific when the S value was equal to or greater than 3.
Antigen production
All of the antigens used in this study were provided by Dr. Steven Anderson's group at Rutgers University as part of the NIH Protein Capture Reagents Initiative funded by the NIH Common Fund (https://commonfund.nih.gov/proteincapture/index). All of the antigens were purified as His6 fusions from bacteria.
Antibody purification
Antibody from tissue culture supernatant was purified using Protein G-Sepharose (13 μL bead volume/mL of supernatant) by rotating at 4°C for 1 hr. Beads were washed 3 times with cold 50 mM sodium phosphate buffer at pH 7.0, and antibody was eluted with 2.0 mL 100 mM glycine at pH 2.5. Eluted material was immediately neutralized by addition of 300 μL 1 M Tris at pH 9.0 and dialyzed overnight at 4°C against PBS buffer.
Antigen-mAb pairs and antigen microarray fabrication
Information about the 19 human antigens and 50 monoclonal antibodies employed in this study can be found in . BSA was chosen as a negative control for antigen protein microarray fabrication. These antigens and BSA were diluted to a final concentration of 0.25 mg/mL in 1xPBS with 30% glycerol before printing. For the proof-of-principle experiment for epitope binning, 0.25 mg/mL HES1, NRF1, and a mixture of equal amount of 0.25 mg/mL HSE1 and 0.25 mg/mL NRF1 were diluted in 1xPBS and 30% glycerol, and then printed on epoxy slides (ArrayIt, USA) with VersArray ChipWriter™ Pro systems (Bio-Rad, USA). After being cured at 4°C for 10 h, the printed microarrays were installed in the flow-cell and scanned by OIRD.
OIRD analysis
For the OIRD measurement, antigen proteins were printed on the epoxy-modified slides (ArrayIt, USA) as described previously. We designed different kinds of antigen microarrays for measuring mAb avidity values and for epitope binning. After being cured at 4°C overnight, the antigen microarray was assembled into the flow-cell and scanned by OIRD program to get a 2-D image of OIRD Im{Δp−Δs} intensity. The mounted antigen slide was then blocked by incubating with 1 mg/mL BSA in 1xPBS for 40 min at RT. Next, 1xPBS and 1xPBST buffer was sequentially pumped into the flow-cell to wash the antigen slide for 5 min at a flow rate of 1 mL/min. After the washing step, another OIRD 2-D image was obtained. Reaction mixtures containing a particular mAb diluted to different concentrations were simultaneously pumped into the 3 reaction chambers, and the scanning program compiled in LabVIEW (NI, USA) was carried out and the laser beam was scanned along the centerlines of the printing spots on the antigen microarray. This scanning process on the printing spots was repeated every 10 seconds. The reflective light intensity proportionately corresponding to Im{Δp−Δs} signals was directly collected to obtain the on-curves of the binding events. After the Im{Δp−Δs} signals reached saturation, 1xPBST was pumped into the flow-cell at a flow rate of 200 μL/min and the off-curves were recorded simultaneously. At the end of the off-curve measurement, a final OIRD 2D image was obtained. After data of the on- and off-curves were extracted from LabVIEW into OriginPro 9.0 (OriginLab, USA), we used simulated curves to fit the on- and off-curves to calculate the K on and K off values, respectively.Citation35,Citation36 The K D value was then deduced by taking the K off / K on ratio.
ELISA analysis
100 μg of each protein G-purified antibody was labeled with biotin using EZ-Link Sulfo-NHS-LC-Biotinylation Kit (ThermoScientific, USA) and passed through a desalting column to remove unbound biotin. Unlabeled mAbs (1B11 and 6E1) were used to coat flat-bottom polystyrene 96-well plates at 10 μg/mL in carbonate buffer at pH 8.5 for overnight at 4°C. Wells were blocked with Tris-buffered saline/3% BSA (TBS/BSA) for one hour at RT. Wells were washed 3 times with TBS/0.05% Tween20 (TBS/T-20). HES1 and HMGB1 protein domains were diluted into TBS/BSA, added to the corresponding antibody-coated wells, and incubation continued for 1 hr at RT. Wells were washed 3 times with TBS/T-20. Biotinylated mAbs (2E8* and 3B10*) were diluted to 2 μg/mL in TBS/BSA and added to the wells containing their antigen and mAb pair partner, and incubated for 1 hr at RT. Wells were washed 3 times with TBS/T-20. All wells were incubated with 0.1 μg/mL streptavidin:horseradish peroxidase (Sigma Aldrich, USA) diluted into TBS/BSA for 30 min at RT. Wells were washed 3 times with TBS/T-20. All wells received ABTS/hydrogen peroxide detection reagent (KPL Laboratories, USA) and optical density was measured at 405 nm with a Multiskan Ascent plate reader.
Disclosure of Potential Conflicts of Interest
HZ, DE, and IP are co-founders of CDI Laboratories and all hold stock in the corporation. SH and IP are current employees of CDI Laboratories.
Supplemental_Figures_1-3__Table_1.zip
Download Zip (6.2 MB)Acknowledgments
We would like to thank Dr. Steven Anderson from Rutgers University for providing all of the purified antigens used in this study.
Funding
This work was supported by the NIH Common Fund grant U54RR020839 to HZ, DE, IP, and by a grant from the Puerto Rico Science and Technology Trust. Additional support was obtained from the Puerto Rico Science and Technology Trust. HZ is also partially supported by National Scientific Foundation of China (No. 81328014).
Supplemental Material
Supplemental data for this article can be accessed on the publisher's website.
References
- Uhlén M. Affinity as a tool in life science. Biotechniques 2008; 44:649; http://dx.doi.org/10.2144/000112803
- Strebhardt K, Ullrich A. Paul Ehrlich's magic bullet concept: 100 years of progress. Nat Rev Cancer 2008; 8:473-80; PMID:18469827; http://dx.doi.org/10.1038/nrc2394
- Kohler G, Milstein C. Continuous cultures of fused cells secreting antibody of predefined specificity. Nature 1975; 256:495-7; PMID:1172191; http://dx.doi.org/10.1038/256495a0
- Jensen BC, Swigart PM, Simpson PC. Ten commercial antibodies for alpha-1-adrenergic receptor subtypes are nonspecific. Naunyn Schmiedebergs Arch Pharmacol 2009; 379:409-12; PMID:18989658; http://dx.doi.org/10.1007/s00210-008-0368-6
- Hughes B. Antibody-drug conjugates for cancer: poised to deliver? Nat Rev Drug Discov 2010; 9:665-7; PMID:20811367; http://dx.doi.org/10.1038/nrd3270
- Berger JR, Houff SA, Major EO. Monoclonal antibodies and progressive multifocal leukoencephalopathy. MAbs: Landes Bioscience 2009; 1:583-9; http://dx.doi.org/10.4161/mabs.1.6.9884
- Michaud GA, Salcius M, Zhou F, Bangham R, Bonin J, Guo H, Snyder M, Predki PF, Schweitzer BI. Analyzing antibody specificity with whole proteome microarrays. Nat Biotechnol 2003; 21:1509-12; PMID:14608365; http://dx.doi.org/10.1038/nbt910
- Davies DH, Wyatt LS, Newman FK, Earl PL, Chun S, Hernandez JE, Molina DM, Hirst S, Moss B, Frey SE. Antibody profiling by proteome microarray reveals the immunogenicity of the attenuated smallpox vaccine modified vaccinia virus ankara is comparable to that of Dryvax. J Virol 2008; 82:652-63; PMID:17977963; http://dx.doi.org/10.1128/JVI.01706-07
- Bacarese-Hamilton T, Gray J, Crisanti A. Protein microarray technology for unraveling the antibody specificity repertoire against microbial proteomes. Curr Opin Mol Therap 2003; 5:278-84; PMID:12870438
- Keasey SL, Schmid KE, Lee MS, Meegan J, Tomas P, Minto M, Tikhonov AP, Schweitzer B, Ulrich RG. Extensive antibody cross-reactivity among infectious gram-negative bacteria revealed by proteome microarray analysis. Mol Cell Proteomics 2009; 8:924-35; PMID:19112181; http://dx.doi.org/10.1074/mcp.M800213-MCP200
- Kijanka G, IpCho S, Baars S, Chen H, Hadley K, Beveridge A, Gould E, Murphy D. Rapid characterization of binding specificity and cross-reactivity of antibodies using recombinant human protein arrays. J Immunol Methods 2009; 340:132-7; PMID:18996391; http://dx.doi.org/10.1016/j.jim.2008.10.008
- Lueking A, Possling A, Huber O, Beveridge A, Horn M, Eickhoff H, Schuchardt J, Lehrach H, Cahill DJ. A nonredundant human protein chip for antibody screening and serum profiling. Mol Cell Proteomics 2003; 2:1342-9; PMID:14517340; http://dx.doi.org/10.1074/mcp.T300001-MCP200
- Bussow K, Nordhoff E, Lubbert C, Lehrach H, Walter G. A human cDNA library for high-throughput protein expression screening. Genomics 2000; 65:1-8; PMID:10777659; http://dx.doi.org/10.1006/geno.2000.6141
- Hu S, Li Y, Liu G, Song Q, Wang L, Han Y, Zhang Y, Song Y, Yao X, Tao Y, et al. A protein chip approach for high-throughput antigen identification and characterization. Proteomics 2007; 7:2151-61; PMID:17549792; http://dx.doi.org/10.1002/pmic.200600923
- Stoevesandt O, Taussig MJ. Affinity reagent resources for human proteome detection: initiatives and perspectives. Proteomics 2007; 7:2738-50; PMID:17639606; http://dx.doi.org/10.1002/pmic.200700155
- Berglund L, Bjorling E, Oksvold P, Fagerberg L, Asplund A, Szigyarto CA, Persson A, Ottosson J, Wernerus H, Nilsson P, et al. A genecentric Human Protein Atlas for expression profiles based on antibodies. Mol Cell Proteomics 2008; 7:2019-27; PMID:18669619; http://dx.doi.org/10.1074/mcp.R800013-MCP200
- Uhlen M, Hober S. Generation and validation of affinity reagents on a proteome-wide level. J Mol Recognit 2009; 22:57-64; PMID:18546091; http://dx.doi.org/10.1002/jmr.891
- Colwill K, Renewable Protein Binder Working G, Graslund S. A roadmap to generate renewable protein binders to the human proteome. Nat Methods 2011; 8:551-8; PMID:21572409; http://dx.doi.org/10.1038/nmeth.1607
- Chen CS, Sullivan S, Anderson T, Tan AC, Alex PJ, Brant SR, Cuffari C, Bayless TM, Talor MV, Burek CL, et al. Identification of novel serological biomarkers for inflammatory bowel disease using Escherichia coli proteome chip. Mol Cell Proteomics 2009; 8:1765-76; PMID:19357087; http://dx.doi.org/10.1074/mcp.M800593-MCP200
- Song Q, Liu G, Hu S, Zhang Y, Tao Y, Han Y, Zeng H, Huang W, Li F, Chen P, et al. Novel autoimmune hepatitis-specific autoantigens identified using protein microarray technology. J Proteome Res 2010; 9:30-9; PMID:19545157; http://dx.doi.org/10.1021/pr900131e
- Jeong JS, Jiang L, Albino E, Marrero J, Rho HS, Hu J, Hu S, Vera C, Bayron-Poueymiroy D, Rivera-Pacheco ZA, et al. Rapid identification of monospecific monoclonal antibodies using a human proteome microarray. Mol Cell Proteomics 2012; 11(6):O111.016253; PMID:22307071; http://dx.doi.org/10.1074/mcp.O111.016253
- Tseng WL, Chang HT, Hsu SM, Chen RJ, Lin S. Immunoaffinity capillary electrophoresis: determination of binding constant and stoichiometry for antibody-antigen interaction. Electrophoresis 2002; 23:836-46; PMID:11920868; http://dx.doi.org/10.1002/1522-2683(200203)23:6%3c836::AID-ELPS836%3e3.0.CO;2-J
- Rella R, Spadavecchia J, Manera MG, Siciliano P, Santino A, Mita G. Liquid phase SPR imaging experiments for biosensors applications. Biosens Bioelectron 2004; 20:1140-8; PMID:15556360; http://dx.doi.org/10.1016/j.bios.2004.05.020
- Nelson BP, Frutos AG, Brockman JM, Corn RM. Near-infrared surface plasmon resonance measurements of ultrathin films. 1. Angle shift and SPR imaging experiments. Anal Chem 1999; 71:3928-34; http://dx.doi.org/10.1021/ac990517x
- Wang ZH, Jin G. A label-free multisensing immunosensor based on imaging ellipsometry. Anal Chem 2003; 75:6119-23; PMID:14615990; http://dx.doi.org/10.1021/ac0347258
- Piehler J, Brecht A, Gauglitz G, Zerlin M, Maul C, Thiericke R, Grabley S. Label-free monitoring of DNA-ligand interactions. Anal Chem 1997; 249:94-102.
- Chen F, Lu HB, Chen ZH, Zhao T, Yang GZ. Optical real-time monitoring of the laser molecular-beam epitaxial growth of perovskite oxide thin films by an oblique-incidence reflectance-difference technique. J Opt Soc Am B 2001; 18:1031-5; http://dx.doi.org/10.1364/JOSAB.18.001031
- Landry JP, Zhu XD, Gregg JP. Label-free detection of microarrays of biomolecules by oblique-incidence reflectivity difference microscopy. Opt Lett 2004; 29:581-3; PMID:15035477; http://dx.doi.org/10.1364/OL.29.000581
- Wang X, Lu H, Wen JA, Yuan K, Lu HB, Jin KJ, Zhou YL, Yang GZ. Label-free and high-throughput detection of protein microarrays by oblique-incidence reflectivity difference method. Chinese Phys Lett 2010; 27:107801; PMID:17356635; http://dx.doi.org/10.1088/0256-307X/27/10/107801
- Lu H, Wen J, Wang X, Yuan K, Li W, Lu H, Zhou Y, Jin K, Ruan K, Yang G. Detection of the specific binding on protein microarrays by oblique-incidence reflectivity difference method. J Opt 2010; 12:095301; PMID:21781038; http://dx.doi.org/10.1088/2040-8978/12/9/095301
- Hu SH, Wan J, Su YJ, Song QF, Zeng YX, Nguyen HN, Shin JH, Cox E, Rho HS, Woodard C, et al. DNA methylation presents distinct binding sites for human transcription factors. elife 2013; 2:e00726; PMID:24015356
- Fei YY, Landry JP, Sun YS, Zhu XD, Luo JT, Wang XB, Lam KS. A novel high-throughput scanning microscope for label-free detection of protein and small-molecule chemical microarrays. Rev Sci Instrum 2008; 79:013708; PMID:18248040; http://dx.doi.org/10.1063/1.2830286
- Wen J, Lu H, Wang X, Yuan K, Lu HB, Zhou YL, Jin KJ, Yang GZ, Li W, Ruan KC. Detection of protein microarrays by oblique-incidence reflectivity difference technique. Sci China Phys Chem 2010; 53:306-9.
- Barnstable CJ, Bodmer WF, Brown G, Galfre G, Milstein C, Williams AF, Ziegler A. Production of monoclonal antibodies to aroup-a Erythrocytes, Hla and other human cell-surface antigens - New Tools for Genetic-Analysis. Cell 1978; 14:9-20; PMID:667938; http://dx.doi.org/10.1016/0092-8674(78)90296-9
- Morton TA, Myszka DG, Chaiken IM. Interpreting complex binding-kinetics from optical biosensors - a comparison of analysis by linearization, the integrated rate-equation, and numerical-integration. Anal Biochem 1995; 227:176-85; PMID:7668379; http://dx.doi.org/10.1006/abio.1995.1268
- Roden LD, Myszka DG. Global analysis of a macromolecular interaction measured on BIAcore. Biochem Bioph Res Co 1996; 225:1073-7; PMID:8780736; http://dx.doi.org/10.1006/bbrc.1996.1297