
Abstract
Cloned bovine preimplantation embryos were generated by somatic cell nuclear transfer (SCNT) of bovine fetal fibroblasts with a silent copy of the pluripotency reporter gene GOF, integrated at a single site of a chromosome 13. GOF combines the regulatory Oct4/Pou5f1 sequence with the coding sequence for EGFP. EGFP expression served as a marker for pluripotency gene activation and was consistently detected in preimplantation embryos with 9 and more cells. Three-dimensional radial nuclear positions of GOF, its carrier chromosome territory and non-carrier homolog were measured in nuclei of fibroblasts, and of day 2 and day 4 embryos, carrying 2 to 9 and 15 to 22 cells, respectively. We tested, whether transcriptional activation was correlated with repositioning of GOF toward the nuclear interior either with a corresponding movement of its carrier chromosome territory 13 or via the formation of a giant chromatin loop. A significant shift of GOF away from the nuclear periphery was observed in day 2 embryos together with both carrier and non-carrier chromosome territories. At day 4, GOF, its carrier chromosome territory 13 and the non-carrier homolog had moved back toward the nuclear periphery. Similar movements of both chromosome territories ruled out a specific GOF effect. Pluripotency gene activation was preceded by a transient, radial shift of GOF toward the nuclear interior. The persistent co-localization of GOF with its carrier chromosome territory rules out the formation of a giant chromatin loop during GOF activation.
Abbreviations
| BFF | = | bovine fetal fibroblasts |
| BTA | = | Bos taurus |
| CLSM | = | confocal laser scanning microscopy |
| CT | = | chromosome territory |
| eADS | = | enhanced absolute 3D distances to surfaces |
| IVF | = | in vitro fertilization |
| MGA | = | major embryonic genome activation |
| GOF | = | Oct4/Pou5f1-EGFP reporter gene |
| SCNT | = | somatic cell nuclear transfer |
Introduction
Early development of mammalian embryos is a critical period characterized by transition of developmental control from RNAs and proteins stored in the oocyte to RNAs and proteins, which are newly synthesized after major embryonic genome activation.Citation1 This critical event occurs at species-specific times after one or several rounds of blastomere cleavage.Citation2 In bovine embryos major embryonic genome activation takes place at the 8-cell stage, where the largest proportion of genes becomes active during preimplantation development.Citation3 Some genes, however, are already activated earlier during minor genome activation.Citation4 The functional implications of nuclear architecture changes, which occur during this period, are currently not well understood. A number of groups, including ours, have made strong efforts to overcome the methodological obstacles preventing the detailed analysis of nuclear architecture in space and time during early mammalian development.Citation5-11
It has been reported that nuclear positions of genes, chromatin domains and even entire chromosome territories can change during development and cell differentiation.Citation8,12-14 As an alternative to movements of entire chromosome territories, it was suggested that they may occupy the same nuclear place before and after activation of genes carried by them, whereas giant chromatin loops may form upon transcriptional activation and move such genes far away from their carrier chromosome territory into a nuclear environment favorable for their transcriptional activation and/or the maintenance of transcription. It was hypothesized that giant loops would even allow the formation of co-regulated, spatial clusters of genes located on different chromosome territories.Citation15 Based on a protocol that combines chromosome painting in 3-dimensional (3D) preserved in vitro fertilized (IVF) bovine embryos with 3D confocal laser scanning microscopy (CLSM) and quantitative 3D image analysis, we have previously studied radial nuclear distributions of the gene-dense BTA 19 and the gene-poor BTA 20 chromosome territories during preimplantation development.Citation8 Prior to major embryonic genome activation at the 8-cell stage we observed a peripheral, radial distribution of both chromosome territories 19 and 20.Citation3 After major embryonic genome activation a gene density-related radial distribution of chromosome territories, 19 (more central) and 20 (more peripheral), was established.Citation8
The goal of the present investigation was to explore a possible link between pluripotency gene activation and specific radial movements of such genes in nuclei of cloned bovine embryos with the help of a marker gene for pluripotency gene activation (GOF).Citation16 In a previous study we established a model system of cloned bovine embryos based on somatic cell nuclear transfer (SCNT) of bovine fetal fibroblasts with the stably integrated pluripotency marker gene GOF.Citation17 This transgene combines regulatory sequences of the pluripotency gene Oct4/Pou5f1 with the coding sequence for EGFP.Citation18 The coding sequence for EGFP synthesis is controlled by a 9-kb fragment of the mouse Oct4/Pou5f1 regulatory sequence with a deletion in the proximal enhancer.Citation19 GOF is silent in fibroblast nuclei, but EGFP was detected in cloned embryos with ≥9 cells.Citation17 Although causal relationships between pluripotency gene activation and major embryonic genome activation are still not clear, we suggest a temporal correlation of GOF activation with major embryonic genome activation in cloned bovine embryos and that this event occurs in both cloned and IVF bovine embryos at the 8-cell stage.Citation3 This model system was employed for a quantitative 3D-FISH study to answer the question, whether Oct4/Pou5f1 promoter activation in nuclei of cloned bovine embryos is preceded or followed by changes of the radial nuclear positioning of GOF in comparison with the radial positioning of silent GOF in fibroblast nuclei. We considered 2 scenarios for a hypothetical repositioning of GOF. The marker gene might move on a giant chromatin loop expanding from the carrier chromosome territory into the nuclear interior or GOF might move together with its carrier chromosome territory. The analysis of the non-carrier homolog 13 provided a control for possible chromosome territory 13 movements unrelated to the presence and activity of GOF.
An accompanying study from our group demonstrated strikingly similar global changes of nuclear landscapes during early development of cloned and in vitro fertilized bovine embryos.Citation11 On their way toward major EGA at the 8-cell stage nuclei of in vitro fertilized embryos underwent striking structural changes characterized by the development of a centric or sometimes acentric major lacuna deprived of chromatin and surrounded by rather compact major chromatin bodies. These bodies were located at the nuclear periphery. They were well separated from each other and apparently represent individual chromosome territories. We referred to these nuclei as ENPs (for Embryonic Nuclei with Peripheral chromosome territory distribution). In cloned embryos approaching the 8-cell stage strikingly similar changes were observed. The flat-ellipsoidal shape of nuclei in cultured bovine fetal fibroblasts, used for somatic cell nuclear transfer, changed to a roundish shape. Nuclei increased in size and developed a major lacuna with a peripheral chromatin arrangement. In some cases, the nuclear phenotype noted in cloned 8-cell embryos was indistinguishable from ENPs in IVF embryos. In other cases, the major lacuna and the formation of well separated major chromatin bodies was less pronounced. Accordingly, we referred to such nuclei as ENP-like. During further development of cloned and IVF embryos nuclei became smaller but maintained their roundish shape and adopted a phenotype presenting typical architectural features of somatic cells, characterized by a network of CTs and chromatin clusters throughout the nuclear space, as well as an enrichment of dense chromatin beneath the nuclear lamina and around nucleoli.Citation20,21 We referred to these nuclei as ENCs (for Embryonic Nuclei with Conventional architecture).Citation11 These pronounced changes of nuclear architecture have to be taken into consideration in studies of embryonic nuclei focused on potential radial movements, which may accompany the activation of GOF or other individual genes (see Discussion).
Results
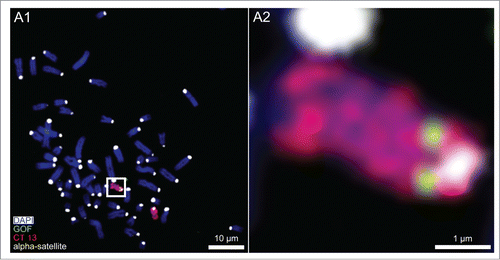
In a previous study we had demonstrated a single integration site of the pluripotency marker gene GOF into an autosome of the bovine fetal fibroblast culture used for SCNT experiments.Citation17 In the present study this site was mapped more precisely (). Three-color FISH to fibroblast metaphase chromosome spreads of the GOF probe, a chromosome paint probe for BTA 13 and an α-satellite DNA probe to pericentromeric heterochromatin demonstrated integration of GOF into BTA 13q, close to the block of pericentromeric heterochromatin.
Figure 1. Chromosome 13 painting combined with FISH of the pluripotency marker gene GOF. (A1) Wide-field, digital, fluorescence microscopy from a bovine fetal fibroblast metaphase spread after 3-color FISH shows DAPI stained chromosomes (blue) painted chromosomes 13 (red), the pluripotency marker gene GOF (green) and α-satellite DNA clusters in pericentromeric heterochromatin (white). (A2) Magnification of the boxed carrier chromosome 13 demonstrates the integration of GOF on 13q near the pericentromeric heterochromatin.
Next, we performed 2-color 3D-FISH with BTA 13 paint probes and a differentially labeled GOF probe to nuclei of fibroblasts and cloned embryos, fixed at day 2 and day 4 after SCNT. Embryos chosen at day 2 consisted of 2 to 9 cells, embryos at day 4 of 15 to 22 cells. A confocal laser scanning microscope with a high numerical aperture objective was used to record 3D image stacks from 48 BFF nuclei and 127 blastomere nuclei. For high quality 3D imaging we chose embryonic nuclei, located close to the plastic surface onto which day 2 and day 4 embryos were attached.
Whereas parameters, such as the strong volume increase and the roundish shape of nuclei in day 2 embryos were fully maintained after 3D-FISH as compared with nuclei studied immediately after the 3D fixation procedure, we noted that the preservation of nuclei in embryos suffered during the 3D-FISH procedure as indicated by multiple, local disruptions of the nuclear border. Such disruptions were most prominent following 3D-FISH in the large nuclei of day 2 embryos, but were not seen in embryonic nuclei after a 3D fixation and DAPI staining without a FISH treatment.Citation11 Nuclei of cloned day 2 embryos resembled nuclei of IVF embryos close to major embryonic gene activation. We suggest that the particular vulnerability of such nuclei reflected the lack of a layer of compact chromatin attached to the lamina beneath the nuclear envelope. This layer was typical for the much smaller nuclei of day 4 embryos, which were also less sensitive to damage induced by the 3D-FISH protocol in line with the fact that such damage was also very rarely noted after 3D-FISH of fibroblast nuclei. For a quantitative 3D analysis we chose nuclei showing a reasonable structural preservation with well defined FISH signals. From the 20 nuclei selected from day 2 embryos for a detailed 3D analysis, 3 were chosen from 2 2-cell embryos, 3 from one 3-cell embryo, 5 from 2 6-cell embryos, 2 from 2 7-cell embryos, 5 from 3 8-cell embryos, and 2 from 2 9-cell embryos.
Of the 20 nuclei selected from day 4 embryos, 18 were taken from embryos carrying between 15 and 22 cells. Two nuclei selected from day 4 embryos, whose cell number was not determined, showed a decreased volume within the range of the other 18 nuclei. Significant and non-significant differences between the absolute changes of radial positions of GOF and both chromosome territories 13 in day 2 and day 4 embryos were maintained, when these 2 nuclei, as well as the 2 nuclei from 9-cell embryos at day 2 were eliminated from the statistical analysis (data not shown).
Nuclear examples shown in indicate an impressive internuclear variability of radial positions noted for GOF, carrier and non-carrier chromosome territories 13 in fibroblast and embryonic nuclei. GOF signals were found either at the border or inside of the carrier chromosome territory 13, but never far away. This finding excludes a role of giant chromatin loops, which would carry away GOF from its carrier chromosome territory prior to or during transcriptional activation.
Figure 2. Variability of higher order chromatin arrangements of the pluripotency marker gene GOF, its carrier chromosome territory (CT) 13 and the non-carrier homolog. Panels A-F. CSLM images were recorded from 6 nuclei A-F representative for the variability of radial nuclear arrangements of GOF (green), its carrier and non-carrier chromosome territories 13 (red): 2 fibroblast nuclei (A and B), 2 embryonic nuclei from cloned embryos at day 2 (C and D), and 2 nuclei from cloned embryos at day 4 (E and F). DAPI stained DNA is presented in gray. X/Y-sections (A1-F1) and X/Z sections (A2-F2) were taken at positions including the painted carrier chromosome territory with the GOF signal. Two white arrows in A1-F1 indicate the site, where the X/Z section was taken perpendicular to the X/Y section. Correspondingly, 2 white arrows in A2-F2 indicate the site, where the X/Y section was taken perpendicular to the X/Z section. A3-F3 show partial 3D reconstructions of the same nuclei presenting the location of the carrier and non-carrier chromosome territories 13. A4-F4 show enlarged, virtual sections of the carrier chromosome territory with GOF signals representing the nearest position of GOF to the DAPI stained nuclear border. Bars: 3 μm for A1-F1, A2-F2, A3-F3; 2 μm for A4-F4.
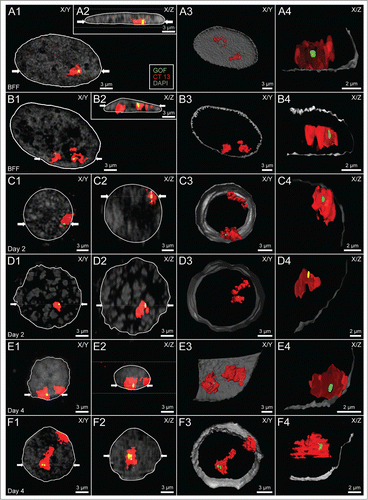
Figure S1 shows examples of nuclei with aberrant numbers of carrier and non-carrier chromosomes 13 in our SCNT experiments. argues for a higher frequency of polyploidization and chromosome missegregation events in cloned embryos compared with IVF embryos. Day 2 cloned embryos displayed a higher frequency of chromosome missegregations compared with day 4 cloned and day 2 IVF embryos. Compared with fibroblast nuclei, a highly significant increase of nuclei with gains of GOF and/or chromosome territories 13 was detected in day 2 embryos but not in day 4 embryos, which in comparison with day 2 embryos revealed a significant drop of aberrations.
Table 1. Chromosomal gains and losses in cloned and IVF bovine embryos
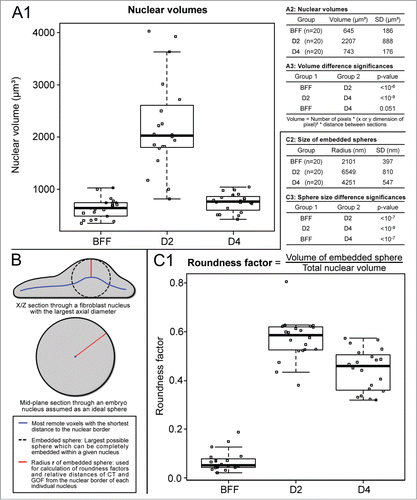
For a complete 3D reconstruction and 3D evaluation we chose 20 fibroblast nuclei, 20 nuclei from day 2 embryos and 20 nuclei from day 4 embryos with intense painting of both chromosome territories 13 and clearly identifiable GOF signals. Compared with nuclei seen in fibroblast cultures, embryonic nuclei revealed a severalfold volume increase at day 2, whereas at day 4 nuclear volumes had decreased again to the range observed for fibroblast nuclei (). For a measure of nuclear roundness we calculated the volume of the largest possible sphere, which could be virtually embedded in a given nucleus and then divided the volume of this sphere by the total nuclear volume (). A strictly spherical cell nucleus is characterized by a roundness factor 1, whereas a roundness factor 0 would indicate a completely flat nucleus with a negligible axial extension. Compared with the flat ellipsoidal shape of nuclei recorded in fibroblast cultures, shows a highly significant increase of nuclear roundness in both day 2 and day 4 embryos.
Figure 3. (A) Volume measurements of bovine fetal fibroblast (BFF) nuclei, day 2 and day 4 embryonic nuclei. Compared with the volumes of fibroblast nuclei, a severalfold increase was noted for day 2 nuclei, whereas a decrease of nuclear volumes back to the level of fibroblast nuclei was noted in day 4 embryos. (B and C) Flat-ellipsoidal shaped fibroblast nuclei adopt a roundish shape in cloned embryos. (B) Scheme for the determination of nuclear roundness factors and relative radial distances. A roundness factor (RF) = 0 represents an extremely flat nucleus with zero axial extension, RF = 1 a perfect round shape. (C) Compared with RFs of fibroblast nuclei, RFs of nuclei in day 2 and day 4 embryos showed a severalfold increased roundness factor.
and and present the results of a quantitative analysis of absolute and relative 3D radial positions of GOF, carrier and non-carrier chromosome territories 13 with respect to 3D nuclear borders in fibroblast nuclei and in day 2 and day 4 embryonic nuclei. The absolute radial position of a given FISH signal was defined as the shortest distance (nm) of its intensity gravity center from the nuclear border. Each signal's relative position was determined to be between 1 and 0. A position of 1 represented localization directly at the border and a position of 0 represented localization at the center of the nucleus (for further details see Experimental Procedures). Box/scatter plots in show the results of our measurements of absolute, radial positions, whereas box/scatter plots in show the calculated relative positions. A statistical analysis of these data is presented in . In comparison with fibroblast nuclei, we observed a significant increase of the mean distance of carrier chromosome territory 13 to the nuclear border in day 2 embryos (, row 1). A significantly larger, absolute, mean distance was also noted for carrier chromosome territory 13 in day 2 nuclei compared with day 4 nuclei (, row 2). Absolute, radial positions of carrier chromosome territory 13 in fibroblast nuclei and in day 4 embryonic nuclei did not differ significantly (, row 3). Absolute GOF positions determined in fibroblast nuclei did also not significantly change in day 2 embryonic nuclei (, row 4). A significant, absolute shift of GOF toward the nuclear periphery occurred between day 2 and day 4 (, row 5). In line with this finding we also noted a significant decrease of the absolute distance of GOF to the nuclear border between fibroblast nuclei and day 4 embryonic nuclei (, row 6).
Table 2. Statistical analysis of differences between absolute, mean distances of GOF and chromosome territory (CT) 13 gravity centers to the nuclear border in bovine fetal fibroblasts (BFFs), day 2 and day 4 cloned embryos
Table 3. Statistical analysis of differences between relative, radial positions of GOF and chromosome territory (CT) 13 gravity centers in bovine fetal fibroblasts (BFFs), day 2 and day 4 cloned embryos
Figure 4. Quantitative analysis of radial nuclear arrangements of the pluripotency reporter gene GOF, its carrier chromosome territory (CT) 13 and the non-carrier homolog. (A) Absolute 3D distances from the 3D reconstructed nuclear border. (B) Relative 3D positions between the center of the nucleus (0) and the 3D reconstructed nuclear border (1). Combined box/scatter plots of GOF, the carrier and non-carrier chromosome territories CT 13 in fibroblast nuclei, day 2 embryonic nuclei and day 4 embryonic nuclei observed in cloned embryos at the onset of major embryonic genome activation and shortly thereafter demonstrate an extensive internuclear variability of these measurements. (C and D) present the data set shown in (A and B), respectively, in relation to the largest sphere, which could be embedded in each given nucleus (compare and ). Note that the variability of absolute distance measurements increased with the size of the embeddable sphere (C), whereas a similar variability was detected with respect to the relative radial positions (D).
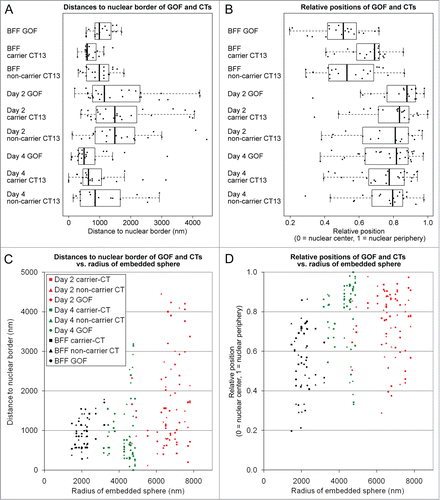
Most notably, a comparison between absolute, radial positions of carrier and non-carrier chromosome territories 13 measured in nuclei of fibroblasts, day 2 and day 4 embryos did not reveal a significant difference (, rows 7–9). This finding shows that the presence of GOF in one of the 2 chromosome territory 13 homologs had no specific influence on their absolute radial positioning. In comparison with fibroblast nuclei the absolute, mean radial position of non-carrier chromosome territory 13 was significantly further removed from the nuclear border in embryonic nuclei at day 2 (, row 10), whereas these positions were neither significantly different between day 2 and day 4 embryonic nuclei (, row 11) nor between fibroblast nuclei and day 4 embryonic nuclei (, row 12).
To account for the large internuclear variability of volumes, we also determined the relative, radial positions of GOF, carrier and non-carrier chromosome territories 13 ( and ). In comparison with BFF nuclei, the mean, relative position of carrier chromosome territory 13 in day 2 and day 4 embryonic nuclei showed a significant shift towards the nuclear periphery (, rows 1 and 3), whereas the mean, relative position of carrier chromosome territory 13 did not change between day 2 and day 4 embryos (, row 2). The observed changes of relative GOF positions were in line with the relative, positional changes of carrier chromosome territories (, rows 4–6). In line with the comparisons of the absolute, mean radial positions of carrier vs. non-carrier chromosome territory 13, comparisons of the relative positions did also not reveal a significant difference (, rows 7–9). In contrast, in comparison with fibroblast nuclei the relative mean, radial positions of non-carrier chromosome territories were significantly shifted toward the nuclear periphery in embryonic nuclei at day 2 and day 4 (, rows 10 and 12), whereas these positions did not significantly differ in day 2 and day 4 embryos (, row 11).
and present the same set of absolute and relative measurements shown in and in relation to the largest sphere, which could be embedded in each given nucleus. This presentation further emphasizes the pronounced internuclear variability of GOF, carrier and non-carrier chromosome territory 13 positions, which defies a straightforward interpretation, even for the case of normalized positions.
Discussion
The integration of the GOF transgene into one of the 2 chromosome territories 13 in bovine fetal fibroblasts and therefore in cloned embryos derived from these cells allowed us to perform 3D-FISH experiments to clarify 3 questions, a) whether GOF activation might be accompanied by a radial movement of this transgene toward the nuclear interior; b) whether a demonstrable movement of GOF would occur together with its carrier CT 13 or independent via a giant chromatin loop expanding from the carrier CT; c) whether potential radial movements of the carrier CT would be paralleled by similar movements of the homologous CT 13.
EGFP, the product of transcribed GOF, was only detected in embryos with ≥9 cells. Activation of pluripotency genes signifies a major change of the transcriptome during reprogramming of the descendents of a transferred fibroblast nucleus. Notably, GOF activation occurred during the same period of preimplantation development as major embryonic gene activation in IVF embryos at the 8-cell stage.Citation3,17 Apparently major reprogramming of gene expression signified by GOF activation was correlated with structural changes of nuclei in cloned embryos, which were strikingly similar with structural changes observed in IVF embryos.Citation11 Cloned embryos approaching the 8-cell stage adopted a nuclear phenotype, which was termed ENP-like because of its similarities with the ENP phenotype described in 8-cell IVF embryos (the acronym stands for Embryonic Nucleus with Peripheral chromosome territory distribution; see Introduction). After major EGA in IVF embryos and pluripotency gene activation in cloned embryos CTs were redistributed into the nuclear interior resulting in a nuclear phenotype, called ENC for Embryonic Nuclei with Conventional architecture presenting typical architectural features of somatic cells. ENCs are characterized by a network of CTs and chromatin clusters throughout the nuclear space, as well as an enrichment of dense chromatin beneath the nuclear lamina and around nucleoli.Citation11,22
Cell numbers counted in cloned embryos at day 2 and day 4 suggest that GOF activation had already started in a fraction of day 2 embryos and that GOF was active in the large majority, if not all nuclei of embryos studied from day 4 embryos. These nuclei showed predominantly the ENC phenotype, which was also adopted by nuclei of in vitro fertilized embryos after major genome activation.Citation11 At first glance our quantitative analysis of 3D radial nuclear positions of GOF in nuclei from fibroblasts and day 2 embryos may argue that a repositioning of this pluripotency marker gene preceded its transcriptional activation. Notably, a comparison of the radial positions of GOF and both chromosome territories 13 in day 2 embryos did not indicate a significant correlation with the actual number of cells present in each embryo (data not shown). This finding argues against a gradual repositioning of GOF during subsequent cleavage cycles toward the nuclear interior before major embryonic/pluripotency gene activation is occurring around the 8-cell stage. At this point we can neither exclude the possibility that the required detachment of fibroblasts from the plastic surface for SCNT yielded a rounder shape with a change of the radial position of GOF nor the possibility that the observed shift in day 2 embryos with 2 to 9 cells was already present in cloned one-cell embryos. A radial shift of genes prior to transcriptional activation makes sense in somatic cell nuclei, where a chromatin environment favorable for transcription together with an enrichment of active genes was noted in the nuclear interior as compared to the less favorable nuclear periphery.Citation23,24 When applied to the present study, such an interpretation does not take into account the major changes of higher order chromatin architecture, which take place both in IVF and cloned bovine embryos, which pass through the major embryonic/pluripotency gene activation window of preimplantation development.Citation11 The significant transient shift of GOF away from and back to the nuclear periphery observed in our quantitative 3D comparison of fibroblast nuclei with day 2 and day 4 embryonic nuclei was strictly correlated with corresponding movements of the carrier chromosome territory 13 in embryonic nuclei. The persistent colocalization of GOF with its carrier chromosome territory rules out the possibility that the repositioning of GOF away from the nuclear periphery in day 2 embryos compared with nuclei from fibroblasts depended on the formation of giant chromatin loops. Movements of the non-carrier chromosome territory 13 homolog provided an ideal internal control to decide whether movements of the carrier chromosome territory 13 were triggered by the presence of GOF. Our observation, that the same absolute and relative transient movements were observed for carrier and non-carrier chromosome territories 13, rules out a specific influence of GOF. In our original hypothesis we predicted that GOF may move from the nuclear periphery toward the nuclear interior, because the interior may provide a more convenient environment for active genes. Since GOF, once activated around the 8-cell stage, remains transcriptionally active throughout the whole following preimplantation period, one would expect that GOF should also retain the more interior nuclear position observed in day 2 embryos. The highly significant absolute shift toward a more peripheral position in day 4 embryos came as an unexpected surprise.
Our findings emphasize that positional changes of genes must be interpreted in the context of changes of the nuclear architecture at large. The apparent differences of absolute and relative distance measurements are a reflection of the complex changes in volume, shape and global chromatin organization between flat ellipsoid fibroblast nuclei, the much larger, roundish nuclei of embryos at the onset of major embryonic gene activation at day 2 and the again much smaller, but still roundish nuclei of day 4 embryos. We do not know yet, when and why the change of nuclear shape actually takes place. Possibly, nuclei already adopt a more roundish shape, when fibroblasts are detached from their growth surface.
Preimplantation development of bovine IVF embryos is prone to chromosomal missegregation and polyploidization events, often leading to embryos consisting of both diploid and polyploid cells.Citation25,26 Such effects have been observed in various mammalian species, including man, and seem to be even more pronounced in cloned embryos.Citation27,28 The wide variation of cell numbers observed in our study in day 2 embryos may reflect the particularly high frequency of chromosome missegregations during the first cleavage stages of cloned embryos. The interplay of structural and functional changes of embryonic nuclei during early development provides an unresolved conundrum of developmental biology. The fact that a fibroblast nucleus after SCNT is forced within its new cellular environment to achieve the same, global architecture as nuclei in fertilized IVF embryos and pass through the same sequence of changes, however, strongly suggests that the observed sequence of structural changes should not be belittled as a byproduct of functional reprogramming. We argue that structural reorganization is linked inseparably with changes of nuclear functions.
It is interesting to compare the changes of 3D nuclear architecture observed in our current studies of cloned and IVF bovine embryos with the development of embryos from other mammalian species, such as mouse and rabbit.Citation5,6,10 For this purpose, one has to take into account that mammalian species differ in the timing of major embryonic gene activation.Citation2 In rabbit embryos this event apparently starts, like in bovine embryos, at the 8-cell stage. In a previous study of in vivo derived and cloned rabbit embryos from our group, only occasional nuclei recorded at this stage showed the peripheral chromatin arrangement phenotype.Citation6 Immunodetection of H3K4me2/3 was used in this study as a marker for transcriptionally competent chromatin. Although remarkable changes of the nuclear patterns of this marker occurred between 4-cell and 16-cell rabbit embryos, the resolution of 3D-CLSM was not sufficient to perform the quantitative, high resolution 3D-SIM analyses performed with immunostained H3K4me3 in the accompanying study of bovine embryos during the corresponding window of development.Citation11 In mouse embryos major embryonic gene activation starts at the 2-cell stage.Citation29 Merico et al.Citation10 found stage-specific differences between the nuclear topography of kinetochores, pericentric heterochromatin and the nucleolus in IVF and cloned preimplantation mouse embryos. The time-course of nuclear remodeling events differed during the first blastomere cleavage events, but IVF and cloned embryos achieved the same distinct nuclear organization in the majority of embryos at the 8-cell stage. Aguirre-Lavin et al.Citation5 combined 3D-FISH, 3D-CLSM and quantitative 3D image analyses to study nuclear arrangements of centromeric (minor satellites), pericentromeric (major satellites), and telomeric genomic sequences, as well as nucleolar precursor bodies and nucleoli in naturally fertilized mouse embryos from the zygote to blastocyst stage. Remarkable changes of nucleolar precursor bodies and pericentromeric heterochromatin were noted during the transition from the mouse 2-cell to the 4-cell stage. Approximately half of the telomeres were localized around the nucleolar precursor bodies or associated with extranucleolar pericentromeric signals. The different probe sets and goals pursued in our studies of cloned and IVF bovine embryos and current studies of mouse and rabbit embryos preclude any direct comparison of the results. The differences of global nuclear architectures are, however, remarkable and emphasize the importance of evolutionary comparisons. Such comparisons will help to identify evolutionary conserved features, which are likely of functional importance for the early development of all mammalian species.
In summary, the 3 questions posed at the beginning of the Discussion can be answered as follows: Compared with silent GOF in fibroblast nuclei, we detected a transient shift of GOF in embryonic nuclei away from the nuclear periphery at day 2 (question a). At day 4 GOF had moved back toward the nuclear periphery. This finding disproves the hypothesis that GOF activation requires a permanent shift of this transgene into the nuclear interior. The observation that GOF movements in both directions occurred together with their carrier chromosome territory (CT) 13 rules out the hypothesis a giant chromatin loop was involved in these movements (question b). A specific effect of GOF activation on movements of the carrier CT 13 was ruled out by the fact that the same transient shift observed for the GOF carrier CT was also observed for the non-carrier homolog (question c). The activation of GOF as an indicator of pluripotency gene transcription and translation in cloned day 2 to day 4 embryos seemingly parallels the developmental window, where major embryonic genome activation occurs in IVF embryos. The observed timing of the positional changes of GOF may serve as a case in point to emphasize the necessity to interpret positional changes of genes during early embryonic development in the context of changes of the nuclear architecture at large, including complex changes in volume, shape and global chromatin organization.
Experimental Procedures
Ethics statement
No animal experiments were conducted. Oocytes for somatic cell nuclear transfer (SCNT) were recovered from ovaries of heifers and cows slaughtered for meat production.
Bovine fetal fibroblast cultures
Vigorously growing fibroblast cultures stably transfected with the Pou5f1 reporter construct GOF18-ΔPE-EGFP were generated and maintained as previously described.Citation17 The reporter construct includes the EGFP gene flanked by a 9-kb fragment of the murine Pou5f1 upstream region with a deletion in the proximal enhancer, and a 9-kb fragment containing the non-transcribed murine structural Pou5f1 gene. Pou5f1 was previously called Oct4. Hence we refer to the transgene as GOF (GFP-Oct-Four).
Cloned early bovine embryos
Procedures were carried out essentially as described.Citation17 For details see the thesis of Daniela Koehler.Citation30 Briefly, embryos were generated by SCNT using fetal fibroblasts carrying the transgene GOF described above. Donor cells frozen in small aliquots were thawed approximately one week before SCNT and grown in a 24-well plate in DMEM, supplemented with 20% fetal calf serum. They were usually confluent on the next day and kept in that state until use. After SCNT the cloned embryos were cultured in 100 μl drops of synthetic oviduct fluid supplemented with 5% (v/v) estrous cow serum at 39°C in a humidified atmosphere of 5% CO2, 5% O2, and 90% N2, covered by paraffin oil. Prior to fixation embryos were briefly washed in 1x PBS at 37°C. Embryos were fixed in 3.7% formaldehyde/1x PBS at room temperature and incubated in 0.1N HCl between 30 sec and 2 min until the zona pellucida disappeared, washed again 2 times each for 10 min in 0.05% Triton X-100/1x PBS containing 0.1% BSA, permeabilized for 60 min in 0.5% Triton X-100/1x PBS containing 0.1% BSA, washed again 2 times in 0.05% Triton X-100 in 1x PBS plus 0.1% BSA, incubated in 0.1N HCl for 2 min, washed as above and finally 2 times each for 10 min in 0.01% Triton X-100 in 2x SSC plus 0.1% BSA. Prior to 3D-FISH embryos were incubated in 50% formamide/2x SSC containing 0.1% BSA (pH = 7.0) for at least 2 days and nights.
DNA probes and labeling procedures
The pluripotency reporter gene GOF was delineated with a probe consisting of the EGFP gene flanked by a 9-kb fragment of the murine Pou5f1 upstream region with a deletion in the proximal enhancer, and a 9-kb fragment containing the non-transcribed murine structural Pou5f1 gene, as well as the neomycin resistance cassette FRT-neo-FRT.Citation18 For visualization of chromosome 13 we used either a chromosome specific paint probe for sheep (Ovis aries) chromosome 13, which is homologous to bovine chromosome 13 or a bovine chromosome 13 paint probe.Citation8,31,32 Chromosomes were sorted by fluorescence activated chromosome sorting (FACS) and their DNA was amplified using degenerate oligonucleotide-primed PCR (DOP-PCR) or a whole genome amplification kit (GE Healthcare).Citation31 An α-satellite probe for visualization of pericentromeric heterochromatin on bovine chromosomes was generated by DOP-PCR from bovine genomic DNA using sequence information for bovine satellites III and IV for the synthesis of appropriate primer pairs.Citation33,34
Satellite III primers:
5′-AAT CAW GCA GCT CAG CAG GCA RT-3′
5′-GAT CAC GTG ACT GAT CAT GCA CT-3′
Satellite IV primers:
5′-AAG CTT GTG ACA GAT AGA ACG AT-3′
5′-CAA GCT GTC TAG AAT TCA GGG A-3′
For 2- and 3-color FISH experiments probes were labeled appropriately using degenerate oligonucleotide primed polymerase chain reaction (DOP-PCR) or nick-translation protocols. The GOF probe was labeled either with TAMRA (tetramethylrhodamine)-dUTP (Bioron) or Cy3-dUTP, chromosome paint probes with DIG (digoxigenin)-11-dUTP and the α-satellite probe with DNP (dinitrophenol)-11-dUTP (PerkinElmer).
Fluorescence in situ hybridization and signal detection
FISH experiments were carried out essentially as described by Cremer et al.Citation35 with modifications described in detail by Koehler et al.Citation9,30. Hybridization mixtures contained 50% formamide, 2x SSC, 10% dextran sulfate. In 2D and 3D-FISH experiments carried out with cultured cells probe concentrations were about 20–40 ng/μl for chromosome 13 and GOF and 2 ng/μl for the α-satellite probe. In case of 3D experiments to embryos the hybridization mixture contained about 170 ng/μl of the paint and GOF probe. This high amount was important firstly, to counteract probe dilution due to medium adherent to the embryo and secondly, to overcome penetration problems. When the paint probe established from sorted bovine chromosomes 13 was used, 500 μg of bovine Cot-1 DNA was added to 1 μg of painting probe to suppress hybridization of repetitive, labeled probe sequences to repetitive DNA sequences dispersed in the entire bovine genome. In case of the paint probe derived from sheep chromosomes 13, this suppression step was not necessary because of the rapid evolutionary divergence of highly repetitive sequences. Both paint probes yielded the same results. For 3D-FISH, embryos were pipetted into a 5 μl drop of hybridization mixture placed in the middle of a metal ring (diameter approximately 2 cm, height 1 mm (Brunel Microscopes Ltd.)) sealed with Fixogum on the surface of a glass slide. For preservation of the 3D shape of embryos and nuclei care was taken to avoid any deforming pressure and to prevent embryos from drying out at any step of the following procedure. The droplet of hybridization mixture was overlaid with mineral oil to avoid air-drying. After at least 2 hours of equilibration of the hybridization mixture with the embryo in a humid environment the glass slide was put on a hot block for 3 min at 76°C to denature nuclear DNA of embryos and probe DNA simultaneously. Hybridization was performed for 2–3 days at 37°C in a humidified atmosphere. For all subsequent washing and probe detection steps, individual embryos were transferred between 1 ml wells carrying the appropriate solutions (for details see Koehler et al.Citation30). Embryos were washed twice in 2x SSC followed by stringent washings in 50% formamide/2x SSC and in 0.1% SSC, each for 10 min. After a short incubation in 4x SSC/0.02% Tween 20 (4x SSCT) embryos were placed in 4% BSA for 10 min for blocking unspecific antibody binding sites. Embryos were then incubated overnight at 4°C with monoclonal mouse-anti-digoxigenin (1:500, Sigma). After 2 washings in 4x SSCT secondary antibody solutions were applied for 90 min at room temperature: goat-anti-mouse-alexa488 highly cross adsorbed (1:200, Molecular Probes/Invitrogen) or goat-anti-mouse-Cy5 (1:100, Dianova). After 2 additional 10-min washings in 4x SSCT, embryos were transferred into 0.1 μg/ml DAPI/4x SSCT for 30 min. Embryos were then subjected to an increasing glycerol dilution series (20%, 40% and 60% in 4x SSCT), each for 5 min, and incubated in Vectashield antifade medium (Vector Laboratories) supplemented with DAPI (0.1 μg/ml) and transferred to poly-L-lysinated, 18-well “μ-slides” (Ibidi, Martinsried, Germany). Three-color FISH to metaphase spreads from transgenic BFF cultures with differentially labeled probes for GOF, pericentromeric α-satellite sequences and painting of CT 13 was performed according to standard protocols. For detection of the DNP-labeled α-satellite primary polyclonal goat-anti-DNP antibodies (1:250, Sigma) and secondary rabbit anti-goat-FITC (1:200, Sigma) were used.
3D confocal laser scanning microscopy (3D-CLSM) and 3D reconstructions
Embryos attached to μ-slides (see above) were carefully equilibrated prior to microscopy with the antifade Vectashield (Vector Laboratories). Care was taken to avoid uncontrolled changes of the refractive index of Vectashield due to dilution with solutions used for storage of embryos. Bovine embryos maintain a diameter of roughly 150–190 μm throughout their preimplantation development.Citation36 A Plan Apo 20x/0.7 objective was used for the recording of image stacks from entire embryos. It is important to note that high quality images with high aperture objectives used for quantitative analyses of chromosome territory 13 and GOF positions could only be recorded from nuclei located close to the surface of the glass slide. Light optical serial sections were obtained with a Leica TCS SP5 confocal laser scanning microscope using a Plan Apo 63x/1.4 oil immersion objective lens for high resolution image stacks from individual nuclei. Fluorochromes were excited using blue diode, Argon, and Helium-Neon lasers with 405 nm, 488 nm and 594 nm laser lines, respectively. Specimens were imaged using x/y/z voxel sizes of 30–120 nm/200 nm for high-resolution images and 400 nm/500 nm for overview images. 3D reconstructions were done using Amira 5 (Visage Imaging) software. Figures were prepared with Adobe Photoshop CS4 (http://www.adobe.com/).
Quantitative analysis of radial positions of GOF, its carrier chromosome territory 13 and non-carrier homolog
For quantitative analysis image stacks were processed using Fiji 1.45b (http://fiji.sc/). 3D radial distributions of chromosomes were measured utilizing the software eADS (enhanced absolute 3D distances to surfaces).Citation23,37 Briefly, this software measures the shortest absolute distance of each voxel of a previously segmented chromosome territory or GOF signal to the border of the corresponding segmented nucleus. The program calculates the median of all measured distances of all voxels. This median value resembles the intensity gravity center, i.e. the highest probability of residence of GOF, carrier and non-carrier chromosome territories 13, respectively. To obtain a relative position of this median (1 for localization directly at the border and 0 for a localization at the center) the distance to the closest nuclear border is measured from the center of the nucleus. This distance represents the radius of the largest possible sphere inside the nucleus and serves to determine the relative radial position. The distributions of these absolute distance medians and relative position medians was compared statistically using the Wilcoxon rank-sum test utilizing the software package R 2.15. Final graphs and combined box/scatter plots were generated using R and Microsoft Excel 2003/2007.
Authors’ contributions
VZ, EW, TC designed research; DK, VZ, AB, AW, TG, JP performed experiments; JP, DK, AB, TT analyzed data; TC, JP, VZ, EW wrote the paper.
Disclosure of Potential Conflicts of Interest
No potential conflicts of interest were disclosed.
Supplemental_Information_970107.zip
Download Zip (1.3 MB)Acknowledgments
Paint probes were kindly provided by Johannes Wienberg (Chrombios, Germany).
Funding
This study was supported by grants from the Deutsche Forschungsgemeinschaft to TC, EW and VZ (CR 59/26, FOR 1041, ZA 425/1–3). In addition, research of EW and VZ was supported by the EU grant Plurisys, HEALTH-F4–2009–223485 FP7 Health 534 project.
Supplemental Materials
Supplemental data for this article can be accessed on the publisher's website: http://www.tandfonline.com/kncl
References
- Tadros W, Lipshitz HD. The maternal-to-zygotic transition: a play in two acts. Development 2009; 136:3033-42; PMID:19700615; http://dx.doi.org/10.1242/dev.033183
- Li L, Lu X, Dean J. The maternal to zygotic transition in mammals. Mol Aspects Med 2013; 34:919-38; PMID:23352575; http://dx.doi.org/10.1016/j.mam.2013.01.003
- Graf A, Krebs S, Zakhartchenko V, Schwalb B, Blum H, Wolf E. Fine mapping of genome activation in bovine embryos by RNA sequencing. Proc Natl Acad Sci U S A 2014; 111:4139-44; PMID:24591639; http://dx.doi.org/10.1073/pnas.1321569111
- Kanka J, Kepkova K, Nemcova L. Gene expression during minor genome activation in preimplantation bovine development. Theriogenology 2009; 72:572-83; PMID:19501393; http://dx.doi.org/10.1016/j.theriogenology.2009.04.014
- Aguirre-Lavin T, Adenot P, Bonnet-Garnier A, Lehmann G, Fleurot R, Boulesteix C, Debey P, Beaujean N. 3D-FISH analysis of embryonic nuclei in mouse highlights several abrupt changes of nuclear organization during preimplantation development. BMC Dev Biol 2012; 12:30; PMID:23095683; http://dx.doi.org/10.1186/1471-213X-12-30
- Brero A, Hao R, Schieker M, Wierer M, Wolf E, Cremer T, Zakhartchenko V. Reprogramming of active and repressive histone modifications following nuclear transfer with rabbit mesenchymal stem cells and adult fibroblasts. Cloning Stem Cells 2009; 11:319-29; PMID:19508112; http://dx.doi.org/10.1089/clo.2008.0083
- Cremer T, Zakhartchenko V. Nuclear architecture in developmental biology and cell specialisation. Reprod Fertil Dev 2011; 23:94-106; PMID:21366985; http://dx.doi.org/10.1071/RD10249
- Koehler D, Zakhartchenko V, Froenicke L, Stone G, Stanyon R, Wolf E, Cremer T, Brero A. Changes of higher order chromatin arrangements during major genome activation in bovine preimplantation embryos. Exp Cell Res 2009; 315:2053-63; PMID:19254712; http://dx.doi.org/10.1016/j.yexcr.2009.02.016
- Koehler D, Zakhartchenko V, Ketterl N, Wolf E, Cremer T, Brero A. FISH on 3D preserved bovine and murine preimplantation embryos. Methods Mol Biol 2010; 659:437-45; PMID:20809333; http://dx.doi.org/10.1007/978-1-60761-789-1_34
- Merico V, Barbieri J, Zuccotti M, Joffe B, Cremer T, Redi CA, Solovei I, Garagna S. Epigenomic differentiation in mouse preimplantation nuclei of biparental, parthenote and cloned embryos. Chromosome Res 2007; 15:341-60; PMID:17447149
- Popken J, Brero A, Koehler D, Schmid VJ, Strauss A, Wuensch A, Guengoer T, Graf A, Krebs S, Blum H, et al. Reprogramming of fibroblast nuclei in cloned bovine embryos involves major structural remodeling with both striking similarities and differences to nuclear phenotypes of in vitro fertilized embryos. Nucleus 2014; 5:xx-xx. http://dx.doi.org/10.4161/19491034.2014.979712.
- Bridger JM. Chromobility: the rapid movement of chromosomes in interphase nuclei. Biochem Soc Trans 2011; 39:1747-51; PMID:22103519; http://dx.doi.org/10.1042/BST20110696
- Mehta IS, Eskiw CH, Arican HD, Kill IR, Bridger JM. Farnesyltransferase inhibitor treatment restores chromosome territory positions and active chromosome dynamics in Hutchinson-Gilford progeria syndrome cells. Genome Biol 2011; 12:R74; PMID:21838864; http://dx.doi.org/10.1186/gb-2011-12-8-r74
- Solovei I, Kreysing M, Lanctot C, Kosem S, Peichl L, Cremer T, Guck J, Joffe B. Nuclear architecture of rod photoreceptor cells adapts to vision in mammalian evolution. Cell 2009; 137:356-68; PMID:19379699; http://dx.doi.org/10.1016/j.cell.2009.01.052
- Gondor A, Ohlsson R. Chromosome crosstalk in three dimensions. Nature 2009; 461:212-7; PMID:19741702; http://dx.doi.org/10.1038/nature08453
- Shi W, Zakhartchenko V, Wolf E. Epigenetic reprogramming in mammalian nuclear transfer. Differentiation 2003; 71:91-113; PMID:12641564; http://dx.doi.org/10.1046/j.1432-0436.2003.710201.x
- Wuensch A, Habermann FA, Kurosaka S, Klose R, Zakhartchenko V, Reichenbach HD, Sinowatz F, McLaughlin KJ, Wolf E. Quantitative monitoring of pluripotency gene activation after somatic cloning in cattle. Biol Reprod 2007; 76:983-91.; PMID:17314316; http://dx.doi.org/10.1095/biolreprod.106.058776
- Niwa H, Miyazaki J, Smith AG. Quantitative expression of Oct-3/4 defines differentiation, dedifferentiation or self-renewal of ES cells. Nat Genet 2000; 24:372-6; PMID:10742100; http://dx.doi.org/10.1038/74199
- Yoshimizu T, Sugiyama N, De Felice M, Yeom YI, Ohbo K, Masuko K, Obinata M, Abe K, Scholer HR, Matsui Y. Germline-specific expression of the Oct-4/green fluorescent protein (GFP) transgene in mice. Dev Growth Differ 1999; 41:675-84; PMID:10646797; http://dx.doi.org/10.1046/j.1440-169x.1999.00474.x
- Cremer T, Cremer M. Chromosome territories. Cold Spring Harb Perspect Biol 2010; 2:a003889; PMID:20300217; http://dx.doi.org/10.1101/cshperspect.a003889
- Smeets D, Markaki Y, Schmid VJ, Kraus F, Tattermusch A, Cerase A, Sterr M, Fiedler S, Demmerle J, Popken J, et al. Three-dimensional super-resolution microscopy of the inactive X chromosome territory reveals a collapse of its active nuclear compartment harboring distinct Xist RNA foci. Epigenetics Chromatin 2014; 7:8; PMID:25057298; http://dx.doi.org/10.1186/1756-8935-7-8
- Bolzer A, Kreth G, Solovei I, Koehler D, Saracoglu K, Fauth C, Muller S, Eils R, Cremer C, Speicher MR, et al. Three-dimensional maps of all chromosomes in human male fibroblast nuclei and prometaphase rosettes. PLoS Biol 2005; 3:e157; PMID:15839726; http://dx.doi.org/10.1371/journal.pbio.0030157
- Kupper K, Kolbl A, Biener D, Dittrich S, von Hase J, Thormeyer T, Fiegler H, Carter NP, Speicher MR, Cremer T, et al. Radial chromatin positioning is shaped by local gene density, not by gene expression. Chromosoma 2007; 116:285-306; PMID:17333233; http://dx.doi.org/10.1007/s00412-007-0098-4
- Kolbl AC, Weigl D, Mulaw M, Thormeyer T, Bohlander SK, Cremer T, Dietzel S. The radial nuclear positioning of genes correlates with features of megabase-sized chromatin domains. Chromosome Res 2012; 20:735-52; PMID:23053570; http://dx.doi.org/10.1007/s10577-012-9309-9
- Demyda-Peyras S, Dorado J, Hidalgo M, Anter J, De Luca L, Genero E, Moreno-Millan M. Effects of oocyte quality, incubation time and maturation environment on the number of chromosomal abnormalities in IVF-derived early bovine embryos. Reprod Fertil Dev 2013; 25:1077-84; PMID:23182337; http://dx.doi.org/10.1071/RD12140
- Viuff D, Rickords L, Offenberg H, Hyttel P, Avery B, Greve T, Olsaker I, Williams JL, Callesen H, Thomsen PD. A high proportion of bovine blastocysts produced in vitro are mixoploid. Biol Reprod 1999; 60:1273-8; PMID:10330080; http://dx.doi.org/10.1095/biolreprod60.6.1273
- Terashita Y, Yamagata K, Tokoro M, Itoi F, Wakayama S, Li C, Sato E, Tanemura K, Wakayama T. Latrunculin A treatment prevents abnormal chromosome segregation for successful development of cloned embryos. PloS One 2013; 8:e78380; PMID:24205216; http://dx.doi.org/10.1371/journal.pone.0078380
- Mertzanidou A, Wilton L, Cheng J, Spits C, Vanneste E, Moreau Y, Vermeesch JR, Sermon K. Microarray analysis reveals abnormal chromosomal complements in over 70% of 14 normally developing human embryos. Hum Reprod 2013; 28:256-64; PMID:23054067; http://dx.doi.org/10.1093/humrep/des362
- Sawicki JA, Magnuson T, Epstein CJ. Evidence for expression of the paternal genome in the two-cell mouse embryo. Nature 1981; 294:450-1; PMID:6171732; http://dx.doi.org/10.1038/294450a0
- Koehler D. Cloning in Cattle: Nuclear architecture and epigenetic status of chromatin during reprogramming of donor cell nuclei. Munich: Ludwig-Maximilians-University; 2009. Available from http:/edoc.ub.uni-muenchen.de1487;99151487
- Burkin DJ, O'Brien PC, Broad TE, Hill DF, Jones CA, Wienberg J, Ferguson-Smith MA. Isolation of chromosome-specific paints from high-resolution flow karyotypes of the sheep (Ovis aries). Chromosome Res 1997; 5:102-8; PMID:9146913; http://dx.doi.org/10.1023/A:1018414123751
- Ansari HA, Bosma AA, Broad TE, Bunch TD, Long SE, Maher DW, Pearce PD, Popescu CP. Standard G-, Q-, and R-banded ideograms of the domestic sheep (Ovis aries): homology with cattle (Bos taurus). Report of the committee for the standardization of the sheep karyotype. Cytogenet Cell Genet 1999; 87:134-42; PMID:10640834; http://dx.doi.org/10.1159/000015380
- Singer MF. Highly repeated sequences in mammalian genomes. Int Rev Cytol 1982; 76:67-112; PMID:6749748; http://dx.doi.org/10.1016/S0074-7696(08)61789-1
- Adega F, Chaves R, Guedes-Pinto H, Heslop-Harrison JS. Physical organization of the 1.709 satellite IV DNA family in Bovini and Tragelaphini tribes of the Bovidae: sequence and chromosomal evolution. Cytogenet Genome Res 2006; 114:140-6; PMID:16825766; http://dx.doi.org/10.1159/000093330
- Cremer M, Grasser F, Lanctot C, Muller S, Neusser M, Zinner R, Solovei I, Cremer T. Multicolor 3D fluorescence in situ hybridization for imaging interphase chromosomes. Methods Mol Biol 2008; 463:205-39; PMID:18951171; http://dx.doi.org/10.1007/978-1-59745-406-3_15
- Bó G, Mapletoft R. Evaluation and classification of bovine embryos. Anim Reprod 2013; 10:344-8.
- Albiez H, Cremer M, Tiberi C, Vecchio L, Schermelleh L, Dittrich S, Kupper K, Joffe B, Thormeyer T, von Hase J, et al. Chromatin domains and the interchromatin compartment form structurally defined and functionally interacting nuclear networks. Chromosome Res 2006; 14:707-33; PMID:17115328; http://dx.doi.org/10.1007/s10577-006-1086-x