
Abstract
Advanced stages of cancer often involve multiple tumors in different locations in the body. These tumors are associated with a microenvironment that can influence tumor responses to immunotherapy. Whether tumors and their disparate microenvironment can interact together at distance in a multiple tumor setting, through a form of cross-talk, and affect their responses to immunotherapy has never been described. Our study investigated the cross-talk between two tumors with disparate microenvironments in a mouse model. We demonstrated that immunosuppressive visceral tumors could influence distant subcutaneous (SC) tumors to render them resistant to immunotherapy. We observed distinct modifications in the SC tumor microenvironment following cross-talk with kidney tumors that exhibit a type-2 macrophage-related immunosuppressive microenvironment. Indeed, when a concomitant kidney tumor was present in the mouse, the SC tumors were highly infiltrated with M2 macrophages and had a reduced T cell and NK cell effector immune profile. Finally, blocking the M2-associated chemokine CCL2 or depleting macrophages, significantly improved the effect of immunotherapy on growth of SC tumors in the presence of concomitant kidney tumors. This work emphasizes the potential negative influence that a tumor, with a strong immunosuppressive microenvironment, can exert on distant tumors that would normally be treatment-responsive. This report may lead to a new vision of the prioritization in the treatment of advanced metastatic cancer.
Introduction
Cancer develops as a primary tumor which frequently metastasizes to secondary sites including the lymph nodes and many other distant organs such as lung, liver, and bone.Citation1 Tumors in several different anatomical sites are present simultaneously in many patients. Simultaneous tumors also occur in bilateral cancer, in which two independent primary tumors arise in two symmetrical organs such as the breastsCitation2 or kidneys.Citation3
Extensive studies of tumor complexity have described the tumor mass as a multifaceted tissue comprising transformed cells surrounded by many cell types.Citation4,5 All these cells from the microenvironment can have a dual role and participate in tumor elimination or in tumor progression.Citation6 Indeed an effective immune response, involving cells such as T cells, B cells and natural killer (NK) cells can eradicate tumors.Citation7,8 However, a pro-tumoral and anti-effector immune response can also occur in the tumor microenvironment leading to immune escape and tumor progression.Citation9,10 Many cell types infiltrating the tumor have been proposed to be involved in immunosuppression including some myeloid components such as type-2 differentiated macrophages (M2) and myeloid derived suppressor cells (MDSC), as well as some lymphoid components such as T regulatory cells (Tregs).Citation11 These cells exhibit their suppressive functions through a combination of well-described mechanisms including cell-to-cell contact and secretion of soluble factors in the microenvironment.Citation12
Thus, a form of cross-talk exists between a tumor and its surrounding stroma, leading to proliferation and survival of tumoral cells.Citation13,14 Another form of cross-talk has been described that involves interactions between circulating cancer stem cells and normal cells at a potential metastatic site. This form of cross-talk has been shown to be crucial for new metastasis to seed and develop.Citation15 Other examples of interaction between multiple tumors include concomitant immunity and abscopal effects. Concomitant immunity is the phenomenon whereby the presence of a primary tumor induces an immune response that inhibits the growth of a secondary tumor subsequently injected at another site, sometimes observed in animal models.Citation16 The abscopal effect describes a relatively rare process in which irradiation of one tumor induces regression of distant non-irradiated tumors, which is thought to be largely immune-mediated.Citation17,18
However, cross-talk between two distant tumors growing in different microenvironments, that inhibit their responses to immunotherapy, has never been described to date.
In previous work, we demonstrated that orthotopic Renca renal tumors displayed a strongly immunosuppressive microenvironment, which included M2 macrophages, rendering tumors resistant to treatment with three immune agonist antibodies (Tri-mAb).Citation19 In contrast, tumors in a SC site had a less immunosuppressive microenvironment. Our results indicated that the tissue surrounding the site of tumor implantation contributes to the outcome of the response to therapy by sculpting the immune nature of the developing tumor microenvironment.
In the present study, we investigate for the first time, whether two independent tumors, growing simultaneously in two different locations and possessing two different microenvironments, could influence each other's response to therapy. To investigate this question, we used the Renca tumor model in which mice received either SC or kidney tumors alone or simultaneously. Although skin is rarely a site of kidney tumor metastasis, we utilized this location together with kidney tumors to provide two sites with disparate tumor microenvironments for proof-of-principle studies. We observed that the presence of an intrakidney (IK) tumor in the mice has a pro-tumoral impact on simultaneous distant SC tumors, reducing the response of SC tumors to Tri-mAb treatment. We demonstrate that the suppressive microenvironment of the IK tumors, strongly M2-related, could influence a distant SC tumor microenvironment to become immunosuppressive. Our results suggest for the first time that systemic cross-talk can exist between two distant tumors in the body, and that a strongly immunosuppressive tumor can influence the microenvironment of distant tumors to also become immunosuppressive and resistant to immunotherapy. This could have implications on the ability of immunotherapies to effectively target tumor metastases.
Results
Tumors with an immunosuppressive microenvironment can limit the response to treatment of concomitant SC tumors
We wanted to assess if the immunosuppressive microenvironment of an IK tumor, strongly infiltrated by M2 cells, could have an impact on a SC distant tumor, normally responsive to Tri-mAb treatment.Citation19 To address this, we injected mice with Renca renal carcinoma cells in one location (SC or IK) or in two locations SC and IK to assess the cross-talk between two tumors with disparate microenvironments. To control for tumor burden, another cohort of mice was established bearing two SC tumors on opposite flanks. As described previously,Citation19 the SC tumors responded well to Tri-mAb treatment and the majority of the mice rejected the SC tumors and survived to day 100 (). Interestingly, mice with two SC tumors responded similarly as mice with one SC tumor to the same doses of Tri-mAb and the majority of them rejected the SC tumors and survived to day 100 (). This suggests that the additional tumor burden associated with two SC tumors had no major impact on the Renca tumor response to Tri-mAb when the tumors are located subcutaneously, which favored an antitumor immune response.V However, a second tumor located IK significantly reduced the response of the concomitant SC tumors (). Consequently, mice with a second tumor located in the kidney survived significantly less than mice with one or two tumors located SC, considering that all mice bearing a SC tumor were culled when the SC tumor reached the ethically limited size of 150 mm2 ().
Figure 1. The presence of IK tumors can modify the response to Tri-mAb of distant SC tumors. (A) SC tumor growth and (B) survival of mice injected with Renca tumor cells in one location subcutaneously (SC) or intrakidney (IK) or in two locations simultaneously SC and SC (SC + SC) or SC and IK (SC + IK) and treated with Tri-mAb or PBS (Ctl). (A) The SC tumor growth averages are represented ±SEM, tumors were measured using a caliper. Statistics were calculated between SC Tri-mAb and SC + IK Tri-mAb, * p < 0.05, ** p < 0.005. (n = 6–9 mice per group, 1 representative experiment of 2 is shown), (B) * p < 0.05, ** p < 0.005. (n = 12–19 mice per group, two experiments pooled) (C) Survival of mice injected with two tumors SC and IK and treated with Tri-mAb or PBS (Ctl). Seven days after tumor inoculation some mice bearing kidney tumors were resected (res.) or not (non res.) (n = 7 mice per group) * p < 0.05 Fisher's Exact Test. (D) SC tumors growth in mice injected with Renca tumor cells in two locations: SC + SC or SC and intrahepatic (IH) (SC + IH) and treated with Tri-mAb or PBS. Bar-graph represents the average ±SEM of the SC tumor growth from the two groups that have been treated with Tri-mAb. n = 5–6 mice per group, * p < 0.05, *** p < 0.0005.
The above data suggested that a kidney tumor with an immunosuppressive microenvironment could impact on the response of a distant concomitant tumor to immunotherapy. To confirm that the continued presence of the kidney tumor was necessary for the reduced response to therapy, we tested whether the removal of IK tumors, through kidney resection, would restore the response of SC tumors to Tri-mAb. We found that a significantly greater proportion of Tri-mAb-treated mice (4 of 7) survived long term to day 100 after rejecting their SC tumors when the IK tumors were removed, while no mice survived long-term when the IK tumors were still present (p = 0.039, Fisher's Exact Test) ().
To extend our findings to another immunosuppressive tumor located in another anatomical site, we injected mice with SC tumors and a second tumor in the liver, a metastatic site for kidney cancer, which has been previously shown to be a potentially immunosuppressive site, resistant to Tri-mAb therapy.Citation19 We observed that Tri-mAb therapy had a significantly reduced effect on SC tumor growth when the second tumor was located intrahepatic (IH) (). Taken together, these results suggest that a tumor with an immunosuppressive microenvironment, resistant to an immunotherapy, could negatively impact on the outcome of a usually responsive distant SC tumor and convert it to be resistant to the same immunotherapy. Furthermore the removal of the immunosuppressive tumor could then restore the responsive phenotype of the SC tumors to the therapy. These findings suggested that a form of cross-talk existed between distant tumors that affected their individual responses to immunotherapy.
Serum transfer from IK tumor-bearing mice does not significantly reduce Tri-mAb responses of SC tumors
To gain insight into the mechanism by which IK tumors affected SC tumors, we initially investigated the role of soluble factors present in serum. We performed a protein-screening analysis for a panel of candidate immunoregulatory cytokines and chemokines present in the serum of mice bearing a SC tumor alone or concomitantly with an IK tumor. Several molecules in the screen were not detected in the serum of the tumor-bearing mice, including interleukin (IL)-1α, IL-2, IL-6, IL-10, IL-17, CCL5, CCL4, CXCL1 and IFNγ (data not shown). However, we were able to detect significant levels of granulocyte colony stimulating factor G-CSF, an important growth factor for myeloid cellsCitation20 as well as IL-6, CCL3 and CXCL1, but the concentrations in the serum from mice bearing a SC tumor alone or combined with an IK tumor were not significantly different (). Despite this lack of difference in serum levels of the candidate cytokines and chemokines, it remained possible that other soluble serum factors played a role in moderating the responsiveness of concomitant tumors. To investigate this possibility, SC tumor-bearing mice received a series of intravenous injections of serum harvested from IK tumor-bearing mice. SC tumor growth was inhibited by Tri-mAb, but the degree of inhibition was not significantly reduced by serum transfer (). Although fewer mice survived long term after Tri-mAb therapy when serum was transferred from IK tumor-bearing mice, the difference in survival was not significantly different (). These data suggested that serum factors played a relatively minor role in modulating SC tumor responses.
Figure 2. Serum-soluble factors are unlikely responsible for the cross-talk between IK and SC tumors. (A) Cytometric bead array analysis of serum from mice injected with one tumor SC and two tumors SC + IK. Serum was harvested at day 12 after tumor injection. (n = 6-7 per group). (B) SC tumor growth and (C) survival of mice injected SC with Renca cells and treated with three doses of Tri-mAb alone (Tri-mAb), PBS or Tri-mAb in combination with serum (serum + Tri-mAb). In the serum transferred group, each mouse received five injections of 300 μL of serum intravenously (IV), harvested from a pool of 33 IK-tumor-bearing mice at day 13. (n = 6-8 mice per group).
SC tumors display a reduced immune effector profile in the presence of concomitant IK tumors
To identify the components involved in the cross-talk between IK tumors and SC tumors, we performed a large screening analysis using RNA sequencing (RNAseq) on the SC tumors from mice bearing a concomitant IK tumor or not. We detected a total of 156 genes, including 89 immune-related genes, downregulated by 2-fold or more in SC tumors when a concomitant IK tumor was present in the mice compared with only SC tumor present. To simplify the analysis, we decided to highlight the 88 genes that were significantly downregulated more than 2.7 fold in SC tumors when an IK tumor was present in the mice (). A large majority of the genes encoded proteins related to a potential effector immune response. Indeed, concomitant IK tumors induced a reduction in the expression of NK cell cytotoxicity-related genes (NKG2 molecules, granzymes, perforin), as well as T cell-related genes (TCRβ, CD8+), particularly Th1-associated genes (IFNγ, T-bet, CD28), and B cell-related genes (immunoglobulins, B cell receptor (BCR)) in the SC tumors ( and ). Surprisingly and in contrast to the downregulation of 156 genes in concomitant SC tumors, only 5 genes were found to be upregulated by 2-fold or more in SC tumors when a concomitant IK tumor was present (). Interestingly, three of those genes, upregulated in response to potential cross-talk between IK and SC tumors, were related to type-2 macrophages including Arg1 that codes for an M2 specific-enzyme; arginase 1, CD163l1 that codes for CD163 membrane M2 specific-markerCitation21 and Vsig4 that codes for a B7-family related molecule recently proposed as a M2 potential markerCitation22 ( and ).
Table 1. Differential gene expression of subcutaneous (SC) tumors in the presence or absence of kidney (IK) tumors. RNAseq was used to determine gene expression in SC tumors. Genes with a change in expression of 2.7 fold or more are listed.
Figure 3. The potential cross-talk between SC and IK tumors downregulates the antitumor immune response and increases the M2 suppressive response in SC tumors. (A–D) To simplify the main finding from Table 1, gene expression determined, using RNA sequencing of various immune cells: (A) NK cells, (B) B cells, (C) T cells, and (D) type-2 macrophages (M2), was represented as histograms. Gene expression (A–C) downregulation or (D) upregulation is represented in fold change of expression in SC tumor when a concomitant IK tumor was present in the mice. (n = 6 mice per group, one experiment). Proteins corresponding to gene names are represented in Table 1. (E) Representative flow cytometry dot plots and (F) quantitative data of total macrophages representing F4/80int/CD11bhi and F4/80hi/CD11int populations that infiltrate some SC tumors when mice injected with two SC tumors (SC + SC) or one SC and one IK tumors (SC + IK). Tumors were taken for analysis at day 14 after inoculation. (n = 4 mice per group, one representative experiment of 3). *** p < 0.0005.
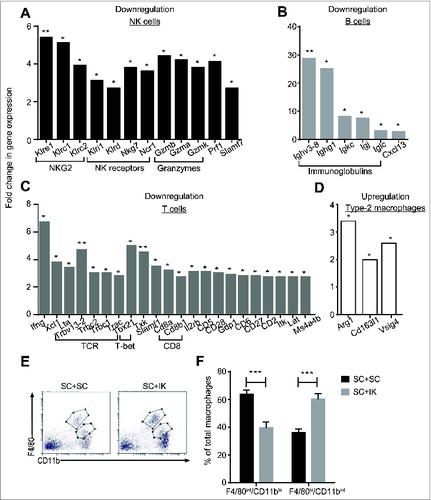
Flow cytometry analyses were performed in order to characterize the immune cell subsets involved in the suppressive effect exerted by IK tumors on SC tumors following Tri-mAb treatment. As observed in our previous study,Citation19 we detected two separated populations of macrophages infiltrating SC tumors, based on their level of F4/80 and CD11b expression (). We previously demonstrated that macrophages expressing F4/80hiCD11bint levels were differentiated to a type-2 immunosuppressive phenotype (M2) and that they infiltrated isolated SC tumors in low amountsCitation19 (). Our current observations established that a significantly increased percentage of M2 cells (F4/80hiCD11bint) infiltrated SC tumors when concomitant IK tumors were present (). We concluded at this stage of the study that IK tumors could suppress the microenvironment in distant SC tumors through the involvement of immunosuppressive macrophages M2. However, whether M2 macrophages were recruited in SC tumors from the IK tumors or were differentiated in situ in SC tumors indirectly by the kidney tumor microenvironment remains to be elucidated.
Concomitant IK tumors reduce the infiltration of NK cells and αβ T cells in SC tumors
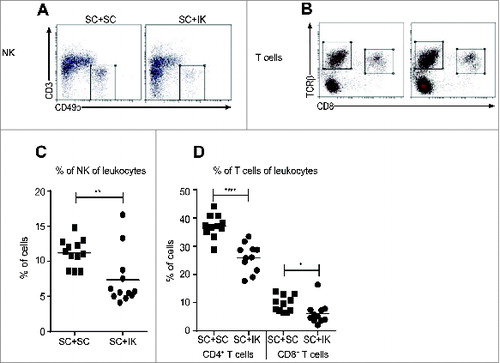
To confirm the result from RNAseq analysis that the effector immune response associated with NK cells, Th1 cells and B cells was reduced in SC tumors when a concomitant IK tumor was present (), we performed flow cytometric analyses on SC tumors. We observed that the percentage of NK cells was significantly reduced in SC tumor when an IK tumor was present (). Moreover, the percentage of CD4+ and CD8+ T cells in SC tumor was also reduced when an IK tumor was simultaneously growing in the mice ().
Figure 4. A lower percentage of NK and T cells infiltrate SC tumors when a concomitant IK tumor is present. (A and B) Representative flow cytometry dot plots and (C and D) quantitative data for the percentage of (A, C) NK cells and (B, D) CD4+ and CD8+ T cells of total leukocytes that infiltrate SC tumors from mice injected with two SC tumors (SC + SC) or one SC and one IK tumors (SC + IK). (C) n = 12 mice per group, three experiments pooled. (D) n = 11 mice per group, three experiments pooled. * p < 0.05, ** p < 0.005, **** p < 0.0001.
IK tumors dampen the activation and cytotoxic potential of NK cells and T cells in SC tumors
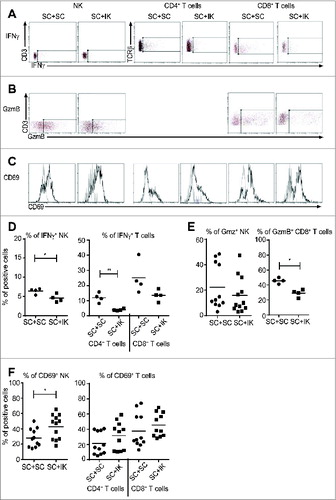
Since the percentages of infiltrating NK and T cells were decreased in SC tumors when an IK tumor was growing in the same mice, we hypothesized that those effector cells were also less active. To investigate this hypothesis, we performed flow cytometric analyses of NK cells and T cells in vitro for IFNγ, following restimulation, and in vivo for granzyme B (GzmB) expression (as a marker of cytolytic potential) and CD69 membrane expression (as a marker of early activation). NK cells and T cells from SC tumors, following restimulation in vitro, displayed a reduced potential to produce the Th1 cytokine IFNγ when IK tumors were present (). Furthermore, GzmB cytotoxic factor expression seemed to remain similar in NK cells in SC tumors from both conditions, but a decreased percentage of CD8+ T cytotoxic cells expressing GzmB was observed in SC tumors when a concomitant IK tumor was present (). Surprisingly, we observed that the percentage of CD69-expressing NK cells was significantly increased in SC tumors when growing concomitantly with IK tumors while the percentage of CD69-expressing T cells remained similar in both conditions (). Taken together, these data suggest that IK tumors inhibit the NK and T cell effector immune response in distant SC tumors.
Figure 5. A dampened NK and T cell effector immune response occurs in SC tumors when a concomitant IK tumor is present. (A–C) Representative flow cytometry dot plots and histograms (D–F), quantitative data for (A and D) interferon-γ (IFNγ), (B and E) granzyme B (GzmB) and (C and F) CD69 in NK cells, CD4+ and CD8+ T cells as depicted. (A) Representative FACS data from one experiment n = 4 mice and (B, C) from three experiments, n = 11–12 mice. (A, B) the rectangular gate represents the isotype control. (C) Black line represents anti-CD69 antibody and gray line represents isotype control antibody. (D–F) percentages (%) of positive cells were calculated of total leukocytes (CD45.2+ cells). Graphs (D) are from one experiment (n = 4), (E) left panel and (F) are from three experiments pooled (n = 11–12 mice) and (E right panel) is from one representative experiment of two (n = 4) * p < 0.05, ** p < 0.005
CCL2 blockade and macrophage depletion reduce the suppressive impact of IK tumors on SC tumors and enhance the effect of Tri-mAb therapy
We previously demonstrated that neutralizing CCL2 (a macrophage migration-related chemokine)Citation23 significantly improved the survival of IK-tumor bearing mice, supporting a role for macrophages in the immunosuppression generated in the IK tumor microenvironment.Citation19 Thus we wanted to assess the role of CCL2 and investigate further the involvement of M2 macrophages in IK tumor-mediated suppression of distant SC tumors. We observed that blocking CCL2 in vivo, using a neutralizing antibody injected systemically, significantly improved the Tri-mAb effect on SC tumor growth in the presence of concomitant IK tumors (). However, despite the survival of a greater proportion of mice following Tri-mAb treatment in the presence of CCL2 blockade, overall survival did not reach statistical significance (). The effect of CCL2 blocking was significantly enhanced when the anti-CCL2 antibody was administrated locally, intra-tumorally, in addition to the systemic IP injection (). As previously, we observed that the SC tumor growth was significantly reduced following the combined treatment of anti-CCL2 antibody and Tri-mAb (). Furthermore, blocking CCL2 locally significantly improved the survival of the Tri-mAb treated mice suggesting that an immunosuppressive effect, related to CCL2, occurs at the SC tumor site (). These data suggest that CCL2 played a role in the growth of SC tumors potentially by recruiting macrophages, a major cell subset responding to this chemokine.
Figure 6. CCL2 is involved in the resistance of SC tumors to treatment when a concomitant IK tumor is present. (A and C) SC tumor growth and (B and D) survival of mice injected with Renca cells SC + IK and treated with Tri-mAb alone (Tri-mAb) or Tri-mAb and anti-CCL2 antibody (A, B) systemically with 200 μL (0.2 mg total per dose) intraperitoneally or (C, D) systemically with 170 μL and locally (intra-tumor) with 30 μL (0.3 mg total per dose). (A, B) n = 15–16 mice/group, two experiments pooled, (C, D) n = 7–9 mice/group, one experiment (A) * p < 0.05, **** p < 0.0001 at day 24 and day 27. (C) ** p < 0.005 at day 19 and *** p < 0.0005 at day 21. (D) * p < 0.05. (E) SC tumor growth and (F) survival of mice injected with Renca cells SC + IK and treated with either PBS (Ctl), Clodrolip (Clodro), Tri-mAb alone (Tri-mAb) or Clodrolip and Tri-mAb (Clodro + TrimAb). n = 5–8 mice/group, one experiment. * p < 0.05, **** p < 0.0001. The average of SC tumor growth is represented (±SEM).
To further assess the involvement of macrophages in the immunosuppression exerted by IK tumors on distant SC tumors, we injected Tri-mAb treated mice with Clodrolip that has been previously shown to deplete macrophages in tumors.Citation24 The Clodrolip injections alone significantly reduced the SC tumor growth at day 21 (). Furthermore, the therapeutic effect of the Clodrolip on SC tumor was further enhanced when Clodrolip was combined with Tri-mAb treatment (). Depleting macrophages from the SC tumors restored the effect of Tri-mAb on tumor growth.
Discussion
We have previously demonstrated that tumors in different anatomical locations can vary in their microenvironment. In these previous studies, we also found that tumors located in various visceral sites, including kidney, liver, colon and prostate, responded relatively poorly to immunotherapy compared to tumors located subcutaneously. Furthermore, inhibition of the Th2/M2 immunosuppressive axes in the kidney tumor context could render visceral tumors more responsive to therapy.Citation19 Interestingly, in the present study, we found that visceral tumors such as IK or IH tumors, comprising a suppressive microenvironment, could convert immunotherapy-responsive concomitant SC tumors to become resistant to treatment. This study indicates, for the first time, that a form of cross-talk can occur between two tumors located in two different anatomical sites, which can affect their responses to immunotherapy.
In this study, we focused on the interaction between kidney tumors and SC tumors because we had previously determined that tumors in these sites varied dramatically in their microenvironment and responses to therapy.Citation19 In addition, we anticipated that these disparate anatomical sites would provide an opportunity to investigate the concept of cross-talk between tumors. Nevertheless, there are many varied anatomical sites in the body, and it will be of interest in future studies to determine the extent of tumor cross-talk between tumors located in sites other than the skin, kidney and liver. In this study we did not investigate in detail the mechanisms behind the impact of hepatic tumors on SC tumors. We have previously described that, similar to kidney tumors, hepatic tumors are resistant to Tri-mAb therapy when compared to SC tumors.Citation19 However, the nature of the cross-talk between hepatic and SC tumors may differ from that operating between kidney and SC tumors described herein.
Our control, in mice receiving two SC tumors and responding well to treatment, suggests that an increased tumor burden does not affect the response to therapy. However, we cannot exclude that some liver and lung metastasis could further increase the tumor burden in animals with visceral IK or IH tumors and SC tumors. Nevertheless, at day 10, when mice with IK or IH tumor received the first injection of Tri-mAb treatment, we did not observe any overt metastasis in the liver or the lung of the animals, supporting the idea that the tumor burden was comparable between mice with two concomitant SC tumors or concomitant SC and IK, SC and IH tumors.
The presence of a kidney tumor had a remarkable impact on the expression of immune-related genes in concomitant SC tumors, as seen from downregulation of many Th1-associated genes. Changes to the immune profile of SC tumors were confirmed using flow cytometry, in which reductions in the frequency of SC tumor-infiltrating T cells and NK cells were observed in the presence of a kidney tumor. The suppression induced by IK tumors also decreased the functional potential of NK cells and T cells, as illustrated by diminished Granzyme B and IFNγ production. Surprisingly, we observed an increased expression of CD69 on NK cells in the SC tumor when cross-talk existed with the IK tumor. However the exact physiological role of CD69 is still unclear and it has been shown that it could provide a negative regulation of NK cell activity.Citation25,26
Remarkably, the most profound change in SC tumors in the presence of a concomitant IK tumor was represented by significant down-regulation of gene expression related to humoral immunity, in particular genes that encode immunoglobulins or BCR components (> 20-fold downregulation for some IgG related-genes, ). Other laboratories have shown that B cells play an important role in preventing the effector immune response and promoting tumor growth.Citation27,28 The presence of tumor-infiltrating B cells and Ig κ chains within tumors has also been correlated with a good prognosis in patients affected by various malignancies.Citation29,30 However, we do not exclude that B cells can also exhibit antitumor functions through their antigen presenting cell-related role that involves the BCR and the production of tumor-specific antibodies.Citation31
Potentially, distant tumors could impact on each other through the release into the circulation of immunosuppressive factors or suppressive cells. Indeed, tumors and their microenvironment produce cytokines, chemokines and growth factors that can enter the circulation.Citation32 However, we did not identify a circulating factor, released by IK tumors and potentially involved in the reduced response of SC tumors. Furthermore, transfer of serum had a limited effect on the efficacy of the immunotherapy on SC tumors. These results suggest that the mechanism behind the cross-talk might be linked to a cell population migrating from the kidney tumors to the SC tumor, rather than solely through a circulating cytokine. However, it is important to note that the serum was collected at day 13 after tumor inoculation considering that we previously demonstrated IK tumors to exhibit a strong immunosuppressive microenvironment in a time-window around day 10–14.Citation19 At this stage, we cannot exclude that important factors, involved in the cross-talk between IK and the SC tumors, can be released at other times during the IK tumor growth.
M2 macrophages are known to be crucial participants in immunosuppression that occurs in tumors.Citation33,34 M2 suppressor macrophages infiltrating the SC tumors can impede the antitumor immune response produced by T cells, NK cells, and B cells.Citation35 We already characterized M2 as the main immunosuppressive immune cell subset infiltrating IK tumors.Citation19 In the present study, we identified the M2 subset (F4/80hi/CD11bint) as a potential candidate responsible for the immunosuppression that occurs in the SC tumor following cross-talk with an immunosuppressive kidney tumor.
The origin of these M2 macrophages in the SC tumor is yet to be clearly elucidated but may be from direct migration of M2 macrophages from the IK tumors, or by differentiation in situ from M1 macrophages. However, the reduced suppressive impact of the IK tumors that we observed when CCL2 was blocked supports the hypothesis of migration of M2 macrophages toward the SC tumors, since CCL2 is a macrophage chemoattractant molecule.Citation36 In addition, CCL2 can act as a potent factor for Th2 polarizationCitation37 and can be involved in M2 polarization,Citation38,39 so its blockade could potentially reduce the immunosuppressive effect of M2 macrophages in SC tumors. Finally, we demonstrated that depletion of macrophages blocks the immunosuppressive potential of the IK tumors and restores the effect of the immunotherapy on the SC tumors. Taken together, our results indicate that the kidney tumors exert an immunosuppressive influence on distant SC tumors through macrophage-related effects.
In patients, metastatic renal cell carcinoma (RCC) is considered a refractory cancer to standard chemotherapy,Citation40 and despite immunotherapies that have been developed and are now routinely used, RCC remains incurable in most cases.Citation41 The involvement of M2 macrophages in human RCC has been describedCitation42 and several strategies are aimed at targeting M2 macrophages by inhibiting their recruitment, depleting their number or switching them to an antitumor M1 phenotype.Citation43 At this stage, given the complexities of obtaining tumors from multiple metastatic sites in patients, it is not known whether these findings will apply to humans. Nevertheless, it is known that tumors in different sites in patients can respond differently to immunotherapy,Citation44-46 suggesting differences in immunoregulation. Our observation that surgical removal of immunosuppressive tumors can renew the responsiveness of another tumor suggests that the influence of distant tumors is not long-lasting, once removed. This raises the intriguing possibility that patients may benefit if immunosuppressive tumors could first be specifically debulked or removed entirely to realize the full potential of immunotherapy on the remaining tumors.
Materials and Methods
Mice and cell lines
BALB/C female mice were bred in the Peter MacCallum Cancer Centre animal facility. Mice 6–20 weeks of age were utilized in accordance with the Peter MacCallum Cancer Centre Animal Experimentation Ethics Committee guidelines. The Renca cell line was generated from a BALB/c mouse RCC Citation47 and maintained at 37°C and 5% CO2 in RPMI 1640 (Invitrogen, Mt Waverley, VIC, Australia), supplemented with 10% heat-inactivated fetal calf serum (FCS) (Moregate Biotech, Bulimba, QLD, Australia), 2 mM glutamine (JRH Bioscience, Brooklyn, VIC Australia), 100 U/mL penicillin, 100 μg/mL streptomycin (all from Sigma-Aldrich, Castle Hill, NSW, Australia).
In vivo experiments
2 × 10⁵ Renca cells were injected as previously describedCitation19 to establish SC, IK, and IH tumors. Mice received tumor cells injection in one site (SC, IK or IH) or in two sites simultaneously at day 0. For the Tri-mAb treatment setting, mice received a total three doses of Tri-mAb or PBS intraperitoneally (IP). Each dose was provided every 3–4 d for 10–12 d, from when the SC tumor size for all groups reached the average size of ∼20 mm2 (as measured longitudinally multiplied by the perpendicular diameter). A single dose of Tri-mAb consisted of 25 μg of anti-CD40 (clone FGK-45), 25 μg of anti-CD137 (clone 3H3) and 50 μg of anti-DR5 (clone MD5.1).
For kidney resection experiments, the whole tumor-bearing kidney from mice bearing two Renca tumors (SC + IK) was removed under anesthesia on day seven post-tumor injection. Mice were then treated with three doses of Tri-mAb or phosphate-buffered saline (PBS).
Serum transfer experiments were performed by harvesting the serum from day 13 IK tumor-bearing donor mice. Serum was then re-infused intravenously (IV) in SC tumor-bearing recipient mice. Each recipient mouse received five injections of 300 μL of serum every 2 d from day 10 after tumor injection in combination with three doses of Tri-mAb.
CCL2 blockade was performed using an anti-mouse CCL2 (clone C-1142, Janssen R&D, Radnor, PA). The anti-CCL2 antibody was injected IP 200 μL at 0.2 mg per mouse, every 2 d for five doses beginning 8 d before Tri-mAb administration in SC + IK tumor-bearing mice. In another experiment, it was injected both IP (170 μL) and locally, intra-SC-tumors (30 μL) for a total dose of 200 μL at 0.3 mg per mouse, twice weekly for seven doses beginning at day 0 (when the tumor cells were injected).
Macrophage depletion was performed using clodronate-containing liposomes (ClodrolipCitation48) injected IP (170 μL) and locally, intra-SC tumors (30 μL) for a total dose of 200 μL at 0.25 mg per mouse, twice weekly for five doses beginning at day 7 after tumor cells inoculation.
Protein analysis
Cytometric Bead Array (CBA) analysis was performed to measure the concentration of cytokines, chemokines and growth factors present in serum harvested from tumor-bearing mice. The mouse inflammation CBA kit (552364) and the CBA Flex system kit (both from BD Biosciences, Sydney, Australia) were used according to the manufacturer's instructions.
SC Renca tumors were excised from mice, lysed with protease inhibitors and protein quantification was achieved using the BCA protein assay kit (Pierce, Rockford, IL). Chemokines, cytokines and growth factors were detected in the tumor lysate using a Mouse Cytokine Array Panel A (Bioscientific, Kirrawee, Australia) according to the manufacturer's instructions.
RNA sequencing
Total RNA from SC tumors was extracted from cells using Qiagen RNeasy kit (Qiagen, Melbourne, Australia) according to the manufacturer's instructions. Illumina HiSeq2000 was used to perform Paired-end RNA sequencing on the RNA samples with read length of 51 bases. A quality trim was achieved using Cutadapt v1.2Citation49 to remove reads with a poor overall Phred score and trailing bases with poor quality. Bowtie 0.12.8Citation50 and TopHat v1.4.1Citation51 were used to align the sequences against Mus musculus reference genome MM9 for analysis.
Flow cytometry
SC tumors were excised from mice, minced finely, and dissociated for 25 min in RPMI 1640 containing 1 mg/mL collagenase type 4 (Worthington Biochemical Corp, Lakewood, NJ, USA), 30 units/mL DNase type II and 100 μg/mL hyaluronidase type V (both from Sigma Aldrich, Sydney, Australia) at 37°C with gentle agitation. For flow cytometric analysis, cells were resuspended in buffer (PBS with 2% of FCS) in the presence of 2.4G2 (anti-CD16/32, to block Fc receptors) made in-house from tissue culture supernatant. Staining was performed using anti-mouse CD45.2-FITC or APC-eF780 (clone 104), TCRβ-PerCP-Cy5.5 (clone H57-597), F4/80-PE-Cy7 (clone BM8), CD4-APC-eF780 (clone RM4-5), CD11b-APC (clone M1/70), CD19-AF647 (clone eBio1D3), CD69-FITC (clone H1.2F3), CD49b-APC or PE (clone DX5), (all from eBioscience, Kensington, Australia), CD206-APC (clone C068C2), CD3-BV650 (clone 17A2), CD8-BV711 (clone 53-6.7) (Biosearch, Karrinyup, Australia). Cells were analyzed on BD FACS CantoII (BD Biosciences). Intracellular staining was done using the Foxp3 transcription factor staining buffer kit (eBioscience) and following the manufacturer's instructions. The antibodies anti-mouse Granzyme B-APC (clone GB11, BD Biosciences), IFNγ-PE (clone XMG1.2, eBioscience) or isotype controls were used for intracellular staining. For IFNγ staining, prior to intracellular staining, dissociated cells from SC tumors were stimulated for 3 h in RPMI complete media with 1 mg/mL of phorbol 12-myristate 13-acetate (PMA), 1 μg/mL of ionomycin (Sigma Aldrich), and 1 μl/mL of GolgiPlugTM (BD Biosciences).
Statistical Analysis
Results are expressed as the mean ± standard error of the mean (SEM). The variation in tumor growth experiments were analyzed by two-way ANOVA test. The difference between different groups’ survival were analyzed using Log-rank (Mantel-Cox) test and Wilcoxon Test. The differences in numbers of surviving mice in were analyzed using Fisher's Exact Test. Other experiments were analyzed using a Mann-Whitney test. p < 0.05 considered significant.
Disclosure of Potential Conflicts of Interest
No potential conflicts of interest were disclosed.
Funding
This work was supported by funding from the Cancer Council of Victoria and the National Health and Medical Research Council of Australia (NHMRC). PAB was supported by an NBCF fellowship. MHK and PKD were supported by Senior Research Fellowships from the NHMRC.
References
- Nguyen DX, Bos PD, Massague J. Metastasis: from dissemination to organ-specific colonization. Nat Rev Cancer 2009; 9:274-84; PMID:19308067; http://dx.doi.org/10.1038/nrc2622
- Hartman M, Czene K, Reilly M, Adolfsson J, Bergh J, Adami HO, Dickman PW, Hall P. Incidence and prognosis of synchronous and metachronous bilateral breast cancer. J Clin Oncol 2007; 25:4210-6; PMID:17878475; http://dx.doi.org/10.1200/JCO.2006.10.5056
- Singer EA, Vourganti S, Lin KY, Gupta GN, Pinto PA, Rastinehad AR, Linehan WM, Bratslavsky G. Outcomes of patients with surgically treated bilateral renal masses and a minimum of 10 years of followup. J Urol 2012; 188:2084-8; PMID:23083858; http://dx.doi.org/10.1016/j.juro.2012.08.038
- Whiteside TL. The tumor microenvironment and its role in promoting tumor growth. Oncogene 2008; 27:5904-12; PMID:18836471; http://dx.doi.org/10.1038/onc.2008.271
- Hanahan D, Weinberg RA. The hallmarks of cancer. Cell 2000; 100:57-70; PMID:10647931; http://dx.doi.org/10.1016/S0092-8674(00)81683-9
- Mittal D, Gubin MM, Schreiber RD, Smyth MJ. New insights into cancer immunoediting and its three component phases-elimination, equilibrium and escape. Curr Opin Immunol 2014; 27C:16-25; http://dx.doi.org/10.1016/j.coi.2014.01.004
- Dunn GP, Old LJ, Schreiber RD. The immunobiology of cancer immunosurveillance and immunoediting. Immunity 2004; 21:137-48; PMID:15308095; http://dx.doi.org/10.1016/j.immuni.2004.07.017
- Vesely MD, Kershaw MH, Schreiber RD, Smyth MJ. Natural innate and adaptive immunity to cancer. Annu Rev Immunol 2011; 29:235-71; PMID:21219185; http://dx.doi.org/10.1146/annurev-immunol-031210-101324
- Whiteside TL. Immune suppression in cancer: effects on immune cells, mechanisms and future therapeutic intervention. Semin Cancer Biol 2006; 16:3-15; PMID:16153857; http://dx.doi.org/10.1016/j.semcancer.2005.07.008
- Hanahan D, Coussens LM. Accessories to the crime: functions of cells recruited to the tumor microenvironment. Cancer Cell 2012; 21:309-22; PMID:22439926; http://dx.doi.org/10.1016/j.ccr.2012.02.022
- Kerkar SP, Restifo NP. Cellular constituents of immune escape within the tumor microenvironment. Cancer Res 2012; 72:3125-30; PMID:22721837; http://dx.doi.org/10.1158/0008-5472.CAN-11-4094
- Poggi A, Zocchi MR. Mechanisms of tumor escape: role of tumor microenvironment in inducing apoptosis of cytolytic effector cells. Archivum Immunol Ther Exp 2006; 54:323-33; PMID:17031467; http://dx.doi.org/10.1007/s00005-006-0038-7
- Liotta LA, Kohn EC. The microenvironment of the tumour-host interface. Nature 2001; 411:375-9; PMID:11357145; http://dx.doi.org/10.1038/35077241
- Elinav E, Nowarski R, Thaiss CA, Hu B, Jin C, Flavell RA. Inflammation-induced cancer: crosstalk between tumours, immune cells and microorganisms. Nat Rev Cancer 2013; 13:759-71; PMID:24154716; http://dx.doi.org/10.1038/nrc3611
- Malanchi I, Santamaria-Martinez A, Susanto E, Peng H, Lehr HA, Delaloye JF, Huelsken J. Interactions between cancer stem cells and their niche govern metastatic colonization. Nature 2012; 481:85-9; PMID:22158103; http://dx.doi.org/10.1038/nature10694
- Lin Y-C, Chang L-Y, Huang C-T, Peng H-M, Dutta A, Chen T-C, Yeh CT, Lin CY. Effector/memory but not naive regulatory T cells are responsible for the loss of concomitant tumor immunity. J Immunol 2009; 182:6095-104; PMID:19414761; http://dx.doi.org/10.4049/jimmunol.0803829
- Postow MA, Callahan MK, Barker CA, Yamada Y, Yuan J, Kitano S, Mu Z, Rasalan T, Adamow M, Ritter E et al. Immunologic correlates of the abscopal effect in a patient with melanoma. N Engl J Med 2012; 366:925-31; PMID:22397654; http://dx.doi.org/10.1056/NEJMoa1112824
- Kroemer G, Zitvogel L. Abscopal but desirable: The contribution of immune responses to the efficacy of radiotherapy. Oncoimmunology 2012; 1:407-8; PMID:22754758; http://dx.doi.org/10.4161/onci.20074
- Devaud C, Westwood JA, John LB, Flynn JK, Paquet-Fifield S, Duong CP, Yong CS, Pegram HJ, Stacker SA, Achen MG et al. Tissues in different anatomical sites can sculpt and vary the tumor microenvironment to affect responses to therapy. Mol Ther 2014; 22:18-27; PMID:24048441; http://dx.doi.org/10.1038/mt.2013.219
- Hamilton JA, Achuthan A. Colony stimulating factors and myeloid cell biology in health and disease. Trends Immunol 2013; 34:81-9; PMID:23000011; http://dx.doi.org/10.1016/j.it.2012.08.006
- Sica A, Bronte V. Altered macrophage differentiation and immune dysfunction in tumor development. J Clin Invest 2007; 117:1155-66; PMID:17476345; http://dx.doi.org/10.1172/JCI31422
- Svensson J, Jenmalm MC, Matussek A, Geffers R, Berg G, Ernerudh J. Macrophages at the fetal-maternal interface express markers of alternative activation and are induced by M-CSF and IL-10. J Immunol 2011; 187:3671-82; PMID:21890660; http://dx.doi.org/10.4049/jimmunol.1100130
- Sica A, Larghi P, Mancino A, Rubino L, Porta C, Totaro MG, Rimoldi M, Biswas SK, Allavena P, Mantovani A. Macrophage polarization in tumour progression. Semin Cancer Biol 2008; 18:349-55; PMID:18467122; http://dx.doi.org/10.1016/j.semcancer.2008.03.004
- Zhang W, Zhu XD, Sun HC, Xiong YQ, Zhuang PY, Xu HX, Kong LQ, Wang L, Wu WZ, Tang ZY. Depletion of tumor-associated macrophages enhances the effect of sorafenib in metastatic liver cancer models by antimetastatic and antiangiogenic effects. Clin Cancer Res 2010; 16:3420-30; PMID:20570927; http://dx.doi.org/10.1158/1078-0432.CCR-09-2904
- Esplugues E, Sancho D, Vega-Ramos J, Martinez C, Syrbe U, Hamann A, Engel P, Sánchez-Madrid F, Lauzurica P. Enhanced antitumor immunity in mice deficient in CD69. J Exp Med 2003; 197:1093-106; PMID:12732655; http://dx.doi.org/10.1084/jem.20021337
- Esplugues E, Vega-Ramos J, Cartoixa D, Vazquez BN, Salaet I, Engel P, Lauzurica P. Induction of tumor NK-cell immunity by anti-CD69 antibody therapy. Blood 2005; 105:4399-406; PMID:15692061; http://dx.doi.org/10.1182/blood-2004-10-3854
- de Visser KE, Eichten A, Coussens LM. Paradoxical roles of the immune system during cancer development. Nat Rev Cancer 2006; 6:24-37; PMID:16397525; http://dx.doi.org/10.1038/nrc1782
- Tan TT, Coussens LM. Humoral immunity, inflammation and cancer. Curr Opin Immunol 2007; 19:209-16; PMID:17276050; http://dx.doi.org/10.1016/j.coi.2007.01.001
- Ladanyi A, Kiss J, Mohos A, Somlai B, Liszkay G, Gilde K, Fejös Z, Gaudi I, Dobos J, Tímár J. Prognostic impact of B-cell density in cutaneous melanoma. Cancer Immunol Immunother 2011; 60:1729-38; PMID:21779876; http://dx.doi.org/10.1007/s00262-011-1071-x
- Nielsen JS, Sahota RA, Milne K, Kost SE, Nesslinger NJ, Watson PH, Nelson BH. CD20+ tumor-infiltrating lymphocytes have an atypical CD27- memory phenotype and together with CD8+ T cells promote favorable prognosis in ovarian cancer. Clin Cancer Res 2012; 18:3281-92; PMID:22553348; http://dx.doi.org/10.1158/1078-0432.CCR-12-0234
- Fremd C, Schuetz F, Sohn C, Beckhove P, Domschke C. B cell-regulated immune responses in tumor models and cancer patients. Oncoimmunology 2013; 2:e25443; PMID:24073382
- Lippitz BE. Cytokine patterns in patients with cancer: a systematic review. Lancet Oncol 2013; 14:e218-28; PMID:23639322; http://dx.doi.org/10.1016/S1470-2045(12)70582-X
- Ruffell B, Affara NI, Coussens LM. Differential macrophage programming in the tumor microenvironment. Trends Immunol 2012; 33:119-26; PMID:22277903; http://dx.doi.org/10.1016/j.it.2011.12.001
- Allavena P, Sica A, Solinas G, Porta C, Mantovani A. The inflammatory micro-environment in tumor progression: the role of tumor-associated macrophages. Critical Rev Oncol/Hematol 2008; 66:1-9; PMID:17913510
- Murray PJ, Wynn TA. Protective and pathogenic functions of macrophage subsets. Nat Rev Immunol 2011; 11:723-37; PMID:21997792; http://dx.doi.org/10.1038/nri3073
- Deshmane SL, Kremlev S, Amini S, Sawaya BE. Monocyte chemoattractant protein-1 (MCP-1): an overview. J Interferon Cytokine Res 2009; 29:313-26; http://dx.doi.org/10.1089/jir.2008.0027
- Gu L, Tseng S, Horner RM, Tam C, Loda M, Rollins BJ. Control of TH2 polarization by the chemokine monocyte chemoattractant protein-1. Nature 2000; 404:407-11; PMID:10746730; http://dx.doi.org/10.1038/35006097
- Roca H, Varsos ZS, Sud S, Craig MJ, Ying C, Pienta KJ. CCL2 and interleukin-6 promote survival of human CD11b+ peripheral blood mononuclear cells and induce M2-type macrophage polarization. J Biol Chem 2009; 284:34342-54; PMID:19833726; http://dx.doi.org/10.1074/jbc.M109.042671
- Sierra-Filardi E, Nieto C, Dominguez-Soto A, Barroso R, Sanchez-Mateos P, Puig-Kroger A, López-Bravo M, Joven J, Ardavín C, Rodríguez-Fernández JL et al. CCL2 shapes macrophage polarization by GM-CSF and M-CSF: identification of CCL2/CCR2-dependent gene expression profile. J Immunol 2014; 192:3858-67; PMID:24639350
- Lilleby W, Fossa SD. Chemotherapy in metastatic renal cell cancer. World J Urol 2005; 23:175-9; PMID:15726382; http://dx.doi.org/10.1007/s00345-004-0469-x
- Heng DY, Xie W, Regan MM, Warren MA, Golshayan AR, Sahi C, Eigl BJ, Ruether JD, Cheng T, North S, et al. Prognostic factors for overall survival in patients with metastatic renal cell carcinoma treated with vascular endothelial growth factor-targeted agents: results from a large, multicenter study. J Clin Oncol 2009; 27:5794-9; PMID:19826129; http://dx.doi.org/10.1200/JCO.2008.21.4809
- Dannenmann SR, Thielicke J, Stockli M, Matter C, von Boehmer L, Cecconi V, Hermanns T, Hefermehl L, Schraml P, Moch H et al. Tumor-associated macrophages subvert T-cell function and correlate with reduced survival in clear cell renal cell carcinoma. Oncoimmunology 2013; 2:e23562; PMID:23687622; http://dx.doi.org/10.4161/onci.23562
- Santoni M, Massari F, Amantini C, Nabissi M, Maines F, Burattini L, Berardi R, Santoni G, Montironi R, Tortora G et al. Emerging role of tumor-associated macrophages as therapeutic targets in patients with metastatic renal cell carcinoma. Cancer Immunol Immunother 2013; 62:1757-68; PMID:24132754; http://dx.doi.org/10.1007/s00262-013-1487-6
- Chang E, Rosenberg SA. Patients with melanoma metastases at cutaneous and subcutaneous sites are highly susceptible to interleukin-2-based therapy. J Immunother 2001; 24:88-90; PMID:11211152; http://dx.doi.org/10.1097/00002371-200101000-00010
- Dudley ME, Wunderlich JR, Yang JC, Sherry RM, Topalian SL, Restifo NP, Royal RE, Kammula U, White DE, Mavroukakis SA et al. Adoptive cell transfer therapy following non-myeloablative but lymphodepleting chemotherapy for the treatment of patients with refractory metastatic melanoma. J Clin Oncol 2005; 23:2346-57; PMID:15800326; http://dx.doi.org/10.1200/JCO.2005.00.240
- Wolchok JD, Hoos A, O'Day S, Weber JS, Hamid O, Lebbe C, Maio M, Binder M, Bohnsack O, Nichol G et al. Guidelines for the evaluation of immune therapy activity in solid tumors: immune-related response criteria. Clin Cancer Res 2009; 15:7412-20; PMID:19934295; http://dx.doi.org/10.1158/1078-0432.CCR-09-1624
- Murphy GP, Hrushesky WJ. A murine renal cell carcinoma. J Natl Cancer Inst 1973; 50:1013-25; PMID:4703766
- Westwood JA, Haynes NM, Sharkey J, McLaughlin N, Pegram HJ, Schwendener RA, Smyth MJ, Darcy PK, Kershaw MH. Toll-like receptor triggering and T-cell costimulation induce potent antitumor immunity in mice. Clin Cancer Res 2009; 15:7624-33; PMID:19996209; http://dx.doi.org/10.1158/1078-0432.CCR-09-2201
- Martin M. Cutadapt removes adapter sequences from high-throughput sequencing reads. EMBnet J 2011; 17:10-12; http://dx.doi.org/10.14806/ej.17.1.200
- Langmead B, Salzberg SL. Fast gapped-read alignment with Bowtie 2. Nat Methods 2012; 9:357-9; PMID:22388286; http://dx.doi.org/10.1038/nmeth.1923
- Trapnell C, Pachter L, Salzberg SL. TopHat: discovering splice junctions with RNA-Seq. Bioinformatics 2009; 25:1105-11; PMID:19289445; http://dx.doi.org/10.1093/bioinformatics/btp120