
Abstract
Gamma delta T (γδT) cells are innate-like lymphocytes with strong, MHC-unrestricted cytotoxicity against cancer cells and show a promising prospect in adoptive cellular immunotherapy for various malignancies. However, the clinical outcome of commonly used Vγ9Vδ2 γδT (Vδ2 T) cells in adoptive immunotherapy for most solid tumors is limited. Here, we demonstrate that freshly isolated Vδ1 γδT (Vδ1 T) cells from human peripheral blood (PB) exhibit more potent cytotoxicity against adherent and sphere-forming human colon cancer cells than Vδ2 T cells in vitro. We also develop an optimized protocol to preferentially expand Vδ1 T cells isolated from PB of both healthy donors and colon cancer patients by in vitro short-term culture with phytohemagglutinin (PHA) and interleukin-7 (IL-7). Expanded Vδ1 T cells highly expressed cytotoxicity-related molecules, chemokine receptors and cytokines with enhanced cytolytic effect against adherent and sphere-forming colon cancer cells in a cell-to-cell contact dependent manner. In addition, PHA and IL-7 expanded Vδ1 T cells showed proliferation and survival advantage partly through an IL-2 signaling pathway. Furthermore, ex vivo expanded Vδ1 T cells also restrained the tumor growth and prolonged the tumor-burdened survival of human colon carcinoma xenografted mice. Our findings suggest that human PB Vδ1 T cells expanded by PHA and IL-7 are a promising candidate for anticancer adoptive immunotherapy for human solid tumors such as colon cancer.
Introduction
Human γδT cells, comprising between ∼0.5% and 16% of total CD3+ cells in PB,Citation1,2 are innate-like lymphocytes without MHC-restriction, which can be rapidly activated by conserved stressed-induced ligands.Citation3 It has been reported that Vγ9Vδ2 γδT (Vδ2 T) cells, the predominant human PB γδT cell subset (> 70%),Citation4 are capable of killing a fraction of hematological malignancies in vitro.Citation5 A decade after the first adoptive immunotherapy for lymphoid malignancies reported by Wilhelm, M. et al.,Citation6 many efforts have been made to improve Vδ2 T cell-based adoptive immunotherapy for cancer.Citation7,8 However, clinic trials of Vδ2 T cell-based adoptive immunotherapy for solid tumors show limited success.Citation9-11
In contrast to Vδ2 T cells, human Vδ1 γδT (Vδ1 T) cells primarily distribute in tissues such as gut epithelia, dermis, spleen, and liver, and constitute less than 30% of γδT cells in PB.Citation4,12 It is reported that tissue-resident Vδ1 T cells recognize antigens (Ags) expressed by epithelium-derived tumor cells.Citation13,14 As a minority subset, human PB Vδ1 T cells have received less attention than Vδ2 T cells in the past. However, recent studies report that PB Vδ1 T cells can eradicate cancer cells of both hematological malignancies Citation15,16 and solid tumors in vitro, particularly tumors of epithelium origin.Citation17,18 Therefore, we hypothesize that human PB Vδ1 T cells provide antitumor potential by recognizing cell surface Ags on tumor cells to promote cytolysis, and may potentially serve as an alternative candidate for γδT cell-based anticancer adoptive immunotherapy, particularly for tumors of epithelium origin such as colon cancer.
In this study, we found that freshly isolated human PB Vδ1 T cells had substantially better killing activity against both adherent and sphere-forming human colon cancer cells than Vδ2 T cells. Moreover, we demonstrated that human PB Vδ1 T cells derived from both healthy donors and colon cancer patients could be preferentially expanded by PHA and IL-7 with enhanced cytotoxicity. Furthermore, ex vivo expanded Vδ1 T cells were more efficient in killing adherent and sphere-forming colon cancer cells than Zoledronate (Zol) and IL-2 expanded Vδ2 T cells. Our protocol also had remarkable advantage in promoting the proliferation and survival of human PB Vδ1 T cells via cooperation of IL-2 and IL-7 signaling pathway. These expanded Vδ1 T cells also restrained tumor growth and prolonged the survival of human colon carcinoma xenografted mice. Taken together, our study suggests that human PB Vδ1 T cells are potent better cancer killer cells than Vδ2 T cells, and a novel strategy to expand Vδ1 T cells with PHA and IL-7 provides potential translation prospect of γδT cell-based adoptive immunotherapy for colon cancer.
Results
Freshly isolated human PB Vδ1 T cells are more potent cancer killing cells than Vδ2 T cells
It is reported that both human PB Vδ1 and Vδ2 T cells show cancer killing activity in vitro.Citation15,19 However, the phenotypic and cytolytic differences between these two subsets of human PB γδT cells are still unclear. We found Vδ1 T cells were about 1–10% of human PB γδT cells (). We found that fresh human PB Vδ1 T cells expressed higher level of CD69 than Vδ2 T cells (). In addition, the expression levels of CD107a, Perforin, GranzymeB, TRAIL, CD57, HLA-DR were higher on Vδ1 T cells, whereas the expression levels of DNAM-1, CD56, TNF-α, IFNγ were higher on Vδ2 T cells (). Vδ1 T cells also highly expressed chemokine receptors including CCR4, CCR6, CCR7, CXCR1, CXCR5, and CXCR7 compared to Vδ2 T cells (), implying unique trafficking profiles for Vδ1 T cells. There was no significant difference in the expression of other surface markers or cytokines (Figs. S1A–C).
Figure 1. Characteristics and cytotoxicity of freshly isolated Vδ1 and Vδ2 T cells from human PB. (A) (Left) Representative flow cytometric analysis of the percentages of CD3+ TCRγδ+ cells in PB CD45+ cells and CD45+ CD3+ TCRγδ+ TCRVδ1+ cells and CD45+ CD3+ TCRγδ+ TCRVδ2+ cells in PB CD45+ CD3+ TCRγδ+ cells. (Right) Bar diagram summarizes the percentages of CD45+ CD3+ TCRγδ+ TCRVδ1+ and CD45+ CD3+ TCRγδ+ TCRVδ2+ cells in PB CD45+ CD3+ TCRγδ+ cells. Data are shown as mean ± SEM; n = 20;*** p< 0.001. (B) (Left) Representative flow cytometric analysis of CD69 expression on fresh PB CD45+ CD3+ TCRγδ+ TCRVδ1+ and CD45+ CD3+ TCRγδ+ TCRVδ2+ cells. (Right) Bar diagram summarizes the percentage of CD69 expression on fresh PB CD45+ CD3+ TCRγδ+ TCRVδ1+ and CD45+ CD3+ TCRγδ+ TCRVδ2+ cells. Data are shown as mean ± SEM; n = 6; *** p < 0.001. (C) Expression of CD107a, Perforin, GranzymeB, TRAIL, CD57, DNAM-1, CD56, HLA-DR, TNF-α, and IFNγ on fresh PB CD45+ CD3+ TCRγδ+ TCRVδ1+ and CD45+ CD3+ TCRγδ+ TCRVδ2+ cells was assessed by FCM. Mean Fluorescence Intensity (MFI) of each molecular expression on CD45+ CD3+ TCRγδ+ TCRVδ1+ (red line) and CD45+ CD3+ TCRγδ+ TCRVδ2+ cells (blue line) was represented in each histogram. Data are representative of six independent experiments with similar results. (D) Expression of CCR4, CCR6, CCR7, CCR10, CXCR1, CXCR3, CXCR4, CXCR5, and CXCR7 on fresh PB CD45+ CD3+ TCRγδ+ TCRVδ1+ and CD45+ CD3+ TCRγδ+ TCRVδ2+ cells was assessed by FCM. MFI of each molecular expression on CD45+ CD3+ TCRγδ+ TCRVδ1+ (red line) and CD45+ CD3+ TCRγδ+ TCRVδ2+ cells (blue line) was represented in each histogram. Data are representative of six independent experiments with similar results. (E) The susceptibility of three colon cancer cell lines, HT29, HCT116, Y and counterpart sphere-forming cells to freshly isolated PB CD45+ CD3+ TCRγδ+ TCRVδ1+ and CD45+ CD3+ TCRγδ+ TCRVδ2+ cells was tested. E:T ratio was 10:1. HT29S: HT29-derived spheres; HCT116S: HCT116-derived spheres; YS: Y-derived spheres. Data are shown as mean ± SEM; n = 6; ns: no statistical significance; *, p < 0.05.
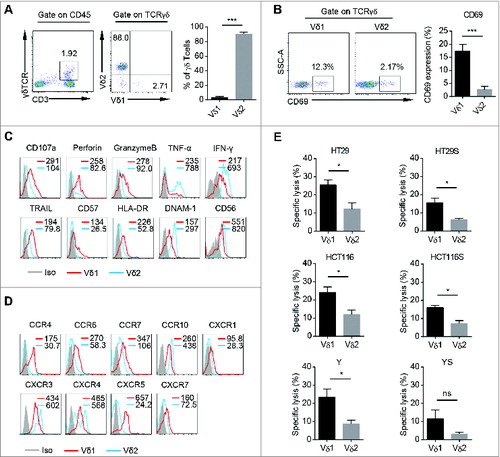
Next, we examined their killing activity against adherent and sphere-forming human colon cancer cells. Fresh Vδ1 and Vδ2 T cells were sorted from human peripheral blood mononuclear cells (PBMCs) and the purity was above 90% (Fig. S1D). The colon cancer sphere-forming cells showed cancer stem cell (CSC) properties, including sphere morphology, expression of stem cell related genes, and in vivo tumorigenicity (Fig. S1F–I). In vitro cytotoxicity assay showed that freshly isolated human PB Vδ1 T cells killed significant more cancer cells derived from three different colon cancer cell lines and counterpart sphere-forming cells than Vδ2 T cells at the same effect : target (E:T) ratio (). Moreover, fresh Vδ1 T cells from PB of colon cancer patients also show higher tumoricidal activity against colon cancer cell line HT29 than paired Vδ2 T cells (Fig. S1E). Taken together, these data indicate that human PB Vδ1 T cells are a unique γδT cell subset with specific phenotype, which have more potent killing activity against adherent and sphere-forming human colon cancer cells than Vδ2 T cells in vitro.
Vδ1 T cells are preferentially expanded by PHA and IL-7 with enhanced cytotoxicity against colon cancer
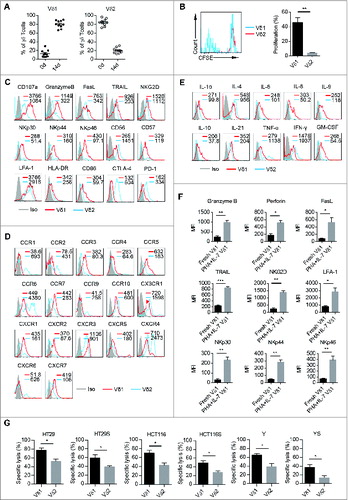
Since Vδ1 T cells show high cytotoxicity but is a minor subset of human PB γδT cells, protocols aim to achieve sufficient Vδ1 T cells number for cancer adoptive immunotherapy are needed. Upon stimulation with PHA and IL-7 for 14 d, we found that Vδ1 T cells in purified PB γδT cells (Fig. S2A) from 10 different donors were selectively enriched (average percentages from approximately 10% to 80%), but the percentages of Vδ2 T cells decreased significantly (). Next, we noted that PHA and IL-7 induced Vδ1 T cell proliferation, but not Vδ2 T cell (). In addition, we found that the expression levels of CD107a, GranzymeB, FasL, TRAIL, NKG2D, NKp30, NKp44, NKp46, CD57, LFA-1, HLA-DR, CD86, CCR3, CCR4, CCR5, CCR7, CXCR1, CXCR2, CXCR3, CXCR5, and CXCR7 were higher on expanded Vδ1 T cells than Vδ2 T cells (). However, the expression levels of CD56, CCR1, CCR2, CCR6, CX3CR1, CXCR4, and CXCR6 were higher on Vδ2 T cells (). There was no difference in the expression of Perforin, DNAM-1, CD16, and CD80 between Vδ1 and Vδ2 T cells (Fig. S2B). Interestingly, the expression levels of CTLA-4 and PD-1 were increased on PHA and IL-7 expanded Vδ2 T cells, but not Vδ1 T cells (), suggesting expanded Vδ1 T cells may be resistant to suppressive regulation. The intracellular cytokine detection showed that PHA and IL-7 expanded Vδ1 T cells produced more IL-1α, IL-6, IL-8, IL-9, IL-10, IL-21, TNF-α, and GM-CSF, while Vδ2 T cells secreted more IL-4 and IFNγ (). In contrast to our previous study on human colon cancer tissues,Citation20 neither expanded PB Vδ1 nor Vδ2 T cells produced IL-1β, IL-17, IL-22, and IL-12/23 (Fig. S2B). Noteworthily, the expression levels of GranzymeB, Perforin, FasL, TRAIL, NKG2D, LFA-1, NKp30, NKp44, and NKp46 were significantly increased on expanded Vδ1 T cells as compared to fresh Vδ1 T cells (). Moreover, these ex vivo expanded Vδ1 T cells eradicated more adherent and sphere-forming colon cancer cells than Vδ2 T cells derived from the same sample in vitro (). In addition, the cancer cell-killing capacity of expanded Vδ1 T cells against adherent and sphere-forming colon cancer cells were significantly enhanced compared with freshly isolated Vδ1 T cells (Fig. S2C). Similarly, PB Vδ1 T cells from colon cancer patients could also be induced proliferation by PHA and IL-7 efficiently (Fig. S2D). Moreover, expanded patient Vδ1 T cells also have higher cytolytic capacity against colon cancer cell line HT29 than Vδ2 T cells (Fig. S2E). These findings demonstrate that we have successfully developed an optimized protocol to preferentially promote Vδ1 T cell propagation with enhanced cytotoxicity against colon cancer in vitro.
Figure 2 (See previous page) . Expansion, characteristics, and cytotoxicity of Vδ1 T cells cultured with PHA plus IL-7. (A) Percentages of CD45+ CD3+ TCRγδ+ TCRVδ1+ and CD45+ CD3+ TCRγδ+ TCRVδ2+ cells in CD45+ CD3+ TCRγδ+ T cells cultured with PHA and IL-7 on day 0 and day 14. Bars represent the median percentage; n = 10. (B) γδT cells were sorted by MACS, labeled with CFSE and cultured with PHA and IL-7. (Left) Proliferation of CD45+ CD3+ TCRγδ+ TCRVδ1+ and CD45+ CD3+ TCRγδ+ TCRVδ2+ cells was evaluated on day 14 by FCM. (Right) Bar diagram summarizes the percentages of CD45+ CD3+ TCRγδ+ TCRVδ1+ CFSE- and CD45+ CD3+ TCRγδ+ TCRVδ2+ CFSE– cells; Data are shown as mean ± SEM; n = 6; ** p< 0.01. (C) Expression levels of CD107a, GranzymeB, FasL, TRAIL, NKG2D, NKp30, NKp44, NKp46, CD57, HLA-DR, CD56, CD86, LFA-1, CTLA-4 and PD-1 onCD45+ CD3+ TCRγδ+ TCRVδ1+ and CD45+ CD3+ TCRγδ+ TCRVδ2+ cells cultured with PHA and IL-7 for 14 d were assessed by FCM. MFI of each molecular expression on CD45+ CD3+ TCRγδ+ TCRVδ1+ (red line) and CD45+ CD3+ TCRγδ+ TCRVδ2+ cells (blue line) was represented in each histogram. Data are representative of six independent experiments with similar results. (D) Expression of CCR1, CCR2, CCR3, CCR4, CCR5, CCR6, CCR7, CCR9, CCR10, CXCR1, CXCR2, CXCR3, CXCR4, CXCR5, CXCR6, CXCR7, and CX3CR1 on CD45+ CD3+ TCRγδ+ TCRVδ1+ and CD45+ CD3+ TCRγδ+ TCRVδ2+ cells cultured with PHA plus IL-7 for 14 d was assessed by FCM. MFI of each molecular expression on CD45+ CD3+ TCRγδ+ TCRVδ1+ (red line) and CD45+ CD3+ TCRγδ+ TCRVδ2+ cells (blue line) was represented in each histogram. Data are representative of six independent experiments with similar results. (E) Intracellular expression of IL-1α, IL-6, IL-8, IL-9, IL-10, IL-21, TNF-α, GM-CSF, IL-4 and IFN-γ by CD45+ CD3+ TCRγδ+ TCRVδ1+ and CD45+ CD3+ TCRγδ+ TCRVδ2+ cells cultured with PHA plus IL-7 for 14 d was assessed by FCM. MFI of each molecular expression on CD45+ CD3+ TCRγδ+ TCRVδ1+ (red line) and CD45+ CD3+ TCRγδ+ TCRVδ2+ cells (blue line) was represented in each histogram. Data are representative of six independent experiments with similar results. (F) MFI of GranzymeB, Perforin, FasL, TRAIL, NKG2D, LFA-1, NKp30, NKp44, and NKp46 expression on day 0 (fresh) and day 14 CD45+ CD3+ TCRγδ+ TCRVδ1+ cells cultured with PHA plus IL-7. Data are shown as mean ± SEM; n = 6; *p < 0.05; **p < 0.01; ***p < 0.001. (G) The susceptibility of three colon cancer cell lines, HT29, HCT116, Y and counterpart sphere-forming cells to CD45+ CD3+ TCRγδ+ TCRVδ1+ and CD45+ CD3+ TCRγδ+ TCRVδ2+ T cells cultured with PHA plus IL-7 for 14 d was tested. E:T ratio was 10:1. Data are shown as mean ± SEM; n = 6; *p < 0.05.
Expanded Vδ1 T cell-mediated colon cancer killing requires cell-to-cell contact via cytotoxicity-related receptors
To investigate the underlying mechanism of PHA and IL-7 expanded Vδ1 T cells mediated adherent and sphere-forming colon cancer cells killing, we performed cytotoxicity assay in a transwell co-culture system. As shown in , tumor cell lysis was significantly decreased in transwell system, suggesting cell-to-cell contact is required for Vδ1 T cell-mediated tumor cell eradication. Consistent with previous reports,Citation21-23 we found Fas, Death Receptor (DR)4, DR5, MICA/B, and ICAM-1 were expressed on both adherent and sphere-forming colon cancer cells (). Moreover, we demonstrated the eradication of adherent and sphere-forming colon cancer cells by Vδ1 T cells was significantly inhibited by blocking antibodies against FasL, TRAIL, NKG2D, NKp30, and LFA-1 (), suggesting Vδ1 T cell-mediated cytotoxicity is partly dependent on these receptor-ligand interactions. These findings suggest that PHA and IL-7 expanded human PB Vδ1 T cells recognize adherent and sphere-forming colon cancer cells to eradicate them in cell-to-cell contact and cytotoxicity-related receptors dependent manner.
Figure 3. In vitro lysis of colon cancer by Vδ1 T cells requires cell-to-cell contact via cytotoxicity-related receptors. (A) The specific lysis of adherent and sphere-forming colon cancer cells by Vδ1 T cells stimulated with PHA and IL-7 in co-culture or transwell system, respectively. Data are shown as mean ± SEM; n = 6; *p< 0.05; **p < 0.01. (B) Representative flow cytometric analysis of expression levels of Fas, Death Receptor (DR)4, DR5, MICA/B, and ICAM-1 on both the adhered cells and sphere-forming cells of HT29, HCT116 and Y. Data are representative of six independent experiments with similar results. (C) In vitro tumor cytotoxicity assay performed in the presence or absence of blocking anti-FasL, TRAIL, NKG2D, NKp30, and LFA-1 antibodies with day 14 Vδ1 T cells stimulated with PHA and IL-7 as effectors and adherent and sphere-forming colon cancer cells as target cells. E:T ratio was 10:1. Data are shown as mean ± SEM; n = 3; *p < 0.05; **p < 0.01.
PHA and IL-7 expanded Vδ1 T cells exhibit greater cytotoxicity against colon cancer than Zol and IL-2 expanded Vδ2 T cells
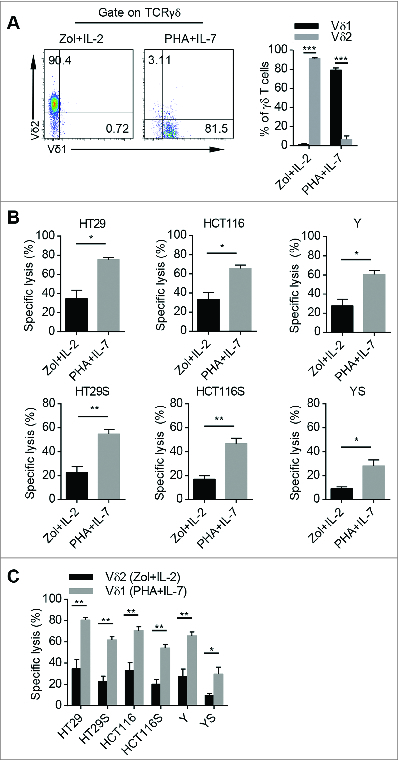
Zol and IL-2 stimulation has been reported to efficiently expand γδT cells with cancer killing activity.Citation24 Indeed, combined Zol with IL-2 preferentially enriched Vδ2 T cells while PHA with IL-7 predominantly expanded Vδ1 T cells (). We then found that total γδT cells expanded by PHA and IL-7 killed more adherent and sphere-forming colon cancer cells in vitro than that stimulated with Zol and IL-2 (). A previous study reported that PHA and IL-2 also preferentially expanded Vδ1 T cells.Citation25 We found PHA and IL-2 expanded total γδT cells also showed higher cytotoxicity than that expanded by Zol and IL-2 (Fig. S3A). Interestingly, both total γδT and Vδ1 T cells expanded by PHA and IL-7 were more efficient in killing adherent and sphere-forming colon cancer cells than those expanded by PHA and IL-2 (Fig. S3B and D). Furthermore, we found that Vδ1 T cells derived from both PHA plus IL-7 and PHA plus IL-2 protocols significantly killed more adherent and sphere-forming colon cancer cells than Vδ2 T cells derived from Zol plus IL-2 system ( and Fig. S3C). These results indicate that human PB Vδ1 T cells expanded by our protocol are better killer cells of colon cancer than Vδ2 T cells.
Figure 4. Vδ1 T cells expanded with PHA and IL-7 exhibit stronger cytolytic effect than Vδ2 T cells stimulated with Zol and IL-2. (A) (Left) Representative flow cytometric analysis of CD45+ CD3+ TCRγδ+ TCRVδ1+ and CD45+ CD3+ TCRγδ+ TCRVδ2+ cells in CD45+ CD3+ TCRγδ+ T cells cultured with Zol plus IL-2 or PHA plus IL-7 for 14 d, respectively. (Right) Bar diagram summarizes the percentages of CD45+ CD3+ TCRγδ+ TCRVδ1+ and CD45+ CD3+ TCRγδ+ TCRVδ2+ cells in CD45+ CD3+ TCRγδ+ T cells in the above culture systems. Data are shown as mean ± SEM; n = 6;*** p< 0.001. (B) The specific lysis of adherent and sphere-forming colon cancer cells by day 14 γδT cells stimulated with Zol plus IL-2 and PHA plus IL-7, respectively. E:T ratio was 10:1. Data are shown as mean ± SEM; n = 6; *, p < 0.05; **, p < 0.01. (C) The specific lysis of adherent and sphere-forming colon cancer cells by sorted Zol plus IL-2 expaned CD45+ CD3+ TCRγδ+ TCRVδ2+ cells and PHA plus IL-7 expanded CD45+ CD3+ TCRγδ+ TCRVδ1+ cells on day 14, respectively. E:T ratio was 10:1. Data are shown as mean ± SEM; n = 6; *, p < 0.05; **, p < 0.01.
Vδ1 T cells stimulated by PHA and IL-7 have higher expansion efficiency and survival advantage than those expanded by PHA and IL-2
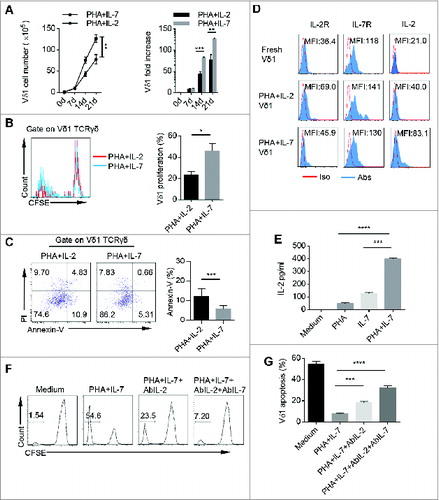
To further decode the underlying mechanism of our protocol in human PB Vδ1 T cell proliferation and survival, we dissected the effect of each component in the expansion protocols and found that PHA alone, PHA plus IL-2, or PHA plus IL-2 and IL-7 were sufficient to expand Vδ1 T cells (Fig. S4A). However, PHA and IL-7 combination gave rise to more Vδ1 T cells with less dead cells (Fig. S4). After 21 d, PHA and IL-7 stimulation preferentially expanded Vδ1 T cells from 1 × 10⁵ initiating cells up to 1.2 × 10⁷ Vδ1 T cells, which represented over 100 fold increase and was superior to previous PHA and IL-2 expansion protocol (). In addition, PHA and IL-7 were more efficient in inducing Vδ1 T cell proliferation with less cell apoptosis compared to PHA plus IL-2 (). Moreover, PHA and IL-7 expanded Vδ1 T cells secreted more IL-2 than Vδ1 T cells expanded by PHA and IL-2 (). Moreover, we found that PHA and IL-7 combination stimulated γδT cells to produce much more IL-2 than each component alone (). Blocking experiments showed that the proliferation and survival of Vδ1 T cells were significantly inhibited by IL-2 neutralizing antibody (). These results suggest that our protocol can induce γδT cells to produce IL-2 to promote the expansion and survival of Vδ1 T cells cooperated with exogenous IL-7.
Figure 5. PHA and IL-7 show more advantage in promoting Vδ1 T cell expansion and survival than PHA and IL-2. (A) The cell numbers and fold increase of CD45+ CD3+ TCRγδ+ TCRVδ1+ cells stimulated with either PHA plus IL-2 or PHA plus IL-7 at day 0, 7, 14, and 21. Data are shown as mean ± SEM; n = 6; **, p < 0.01; ***, p < 0.001. (B) γδT cells were sorted by MACS, pre-labeled with CFSE and cultured with PHA plus IL-2 or PHA plus IL-7. (Left) Proliferation of CD45+ CD3+ TCRγδ+ TCRVδ1+ cells expanded by PHA plus IL-2 or PHA plus IL-7 was evaluated on day 14 by FCM. (Right) Bar diagram summarizes the percentages of CD3+ TCRγδ+ TCRVδ1+ CFSE- cells stimulated with PHA and IL-2 and PHA and IL-7. Data are shown as mean ± SEM; n = 6; *, p < 0.05. (C) (Left) CD45+ CD3+ TCRγδ+ TCRVδ1+ Annexin-V+ cells stimulated with PHA plus IL-2 or PHA plus IL-7 were detected on day 14 by FCM. (Right) Bar diagram summarizes the percentages of CD45+ CD3+ TCRγδ+ TCRVδ1+ Annexin V+ cells stimulated with PHA plus IL-2 and PHA plus IL-7. Data are shown as mean ± SEM; n = 6; ***, p < 0.001. (D) Expression of IL-2, IL-2R and IL-7R in fresh, and PHA plus IL-2 and PHA plus IL-7 expanded CD45+ CD3+ TCRγδ+ TCRVδ1+ cells was evaluated on day 14 by FCM. Data are representative of six independent experiments with similar results. (E) γδT cells were sorted by MACS and cultured in conditioned medium (Medium, PHA, IL-7 or PHA plus IL-7) for 14 d, and then IL-2 concentration in cultural supernatants was detected by ELISA. Data are shown as mean ± SEM; n = 6; ***, p < 0.001; ****, p < 0.0001. (F) γδT cells were sorted by MACS, labeled with CFSE and cultured in conditioned medium (Medium, PHA plus IL-7, PHA plus IL-7 and AbIL-2 or PHA plus IL-7 and AbIL-2 and AbIL-7) for 14 d, and CD45+ CD3+ TCRγδ+ TCRVδ1+ CFSE– cells were detected by FCM. Data are representative of six independent experiments with similar results. (G) γδT cells were sorted by MACS and cultured in conditioned medium (Medium, PHA plus IL-7, PHA plus IL-7 and AbIL-2 or PHA plus IL-7 and AbIL-2 and AbIL-7) for 14 d, and then PI was add to the medium for another 15 min. CD45+ CD3+ TCRγδ+ TCRVδ1+ PI+ cells were detected by FCM. Data are shown as mean ± SEM; n = 6; ***, p < 0.001; ****, p < 0.0001.
Vδ1 T cells expanded by PHA and IL-7 greatly inhibit tumor growth in vivo
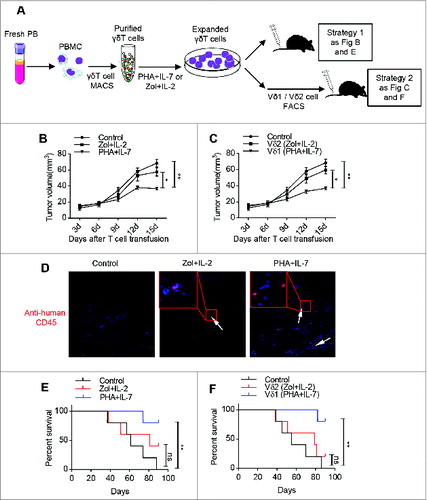
We next examined the antitumor effect of PHA and IL-7 expanded γδT and Vδ1 T cells in vivo (). To this end, a xenografted tumor model was established using human colon cancer cell line HT29. Histological examination of xenografts derived from HT29 showed similar histopathological features as human colon cancer (Fig. S4A). We found that tumor growth was significantly restrained in mice transferred with γδ T cells expanded by PHA and IL-7, but not Zol and IL-2 expanded γδ T cells (). We further sorted PHA plus IL-7 expanded Vδ1 T cells and Zol plus IL-2 expanded Vδ2 T cells for adoptive transfer into tumor-bearing mice and similar results were obtained (). We also examined the existence of human γδT cells in mouse PB, spleen, and xenograft tumor by FCM and IF ( and Fig. S4B). Human CD45+ cells were observed in mouse PB, spleen, and xenograft tumor by FCM and IF assay, suggesting that γδT cells indeed reach the tumor tissue. In addition, treatment with both PHA plus IL-7 expanded total γδT cells and Vδ1 T cells prolonged the survival of the tumor-bearing mice (). These data suggest that human PB Vδ1 T cells expanded by our protocol show more potent antitumor effect in vivo which would be an alternative candidate for colon cancer adoptive immunotherapy.
Figure 6. Human colon carcinoma xenografted mice treated with PHA and IL-7 expanded Vδ1 T cells have significantly reduced tumor growth and prolonged survival. (A) The schema of experimental design. (B) Human colon carcinoma xenografted mice (n = 5) were adoptively transferred with or without γδT cells (1 × 10⁶ cells) expanded with Zol plus IL-2 or PHA plus IL-7. Tumor growth was monitored and tumor diameter was recorded. Data are shown as mean ± SEM; *, p< 0.05; **, p < 0.01. (C) Human colon carcinoma xenografted mice (n = 5) were adoptively transferred with or without sorted Zol plus IL-2 expanded CD45+CD3+ TCRγδ+ TCRVδ2+ cells (1 × 10⁶ cells) or PHA plus IL-7 expanded CD45+CD3+ TCRγδ+ TCRVδ1+ cells (1 × 10⁶ cells). Tumor growth was monitored and tumor diameter was recorded. Data are shown as mean ± SEM; *, p < 0.05; **, p < 0.01. (D) Paraffin sections from xenografted tumors (Scale bars, 100 μm) were stained with anti-human CD45 (Red) IF staining. One of the three independent experiments is shown. (E) Kaplan–Meier survival curve of control mice treated with PBS and those treated with day 14 γδT cells (1 × 10⁶ cells) cultured with Zol plus IL-2 and PHA plus IL-7, respectively; five mice were included in each group of this experiment; ns: no statistical significance; **, p < 0.01. (F) Kaplan–Meier survival curve of control mice treated with PBS and those treated with Zol plus IL-2 expanded CD45+CD3+ TCRγδ+ TCRVδ2+ cells (1 × 10⁶ cells) and PHA plus IL-7 expanded CD45+CD3+ TCRγδ+ TCRVδ1+ cells (1 × 10⁶ cells) on day 14, respectively; five mice were included in each group of this experiment; ns: no statistical significance; **, p < 0.01.
Discussion
In this study, we find human PB Vδ1 T cells are a minor γδ T cell subset with unique phenotype and potential cytotoxicity. We also demonstrate for the first time that freshly isolated human PB Vδ1 T cells have more potent cancer killing activity against both adherent and sphere-forming human colon cancer cells than Vδ2 T cells. Furthermore, we have successfully developed an optimized ex vivo expansion protocol using PHA and IL-7 to preferentially promote the proliferation of Vδ1 T cells derived from both healthy donors and colon cancer patients with an enhanced antitumor cytotoxicity. Those expanded Vδ1 T cells are also more effective in killing adherent and sphere-forming colon cancer cells than Vδ2 T cells expanded by Zol plus IL-2. This is demonstrated by both in vitro cytotoxicity assay and an in vivo human colon cancer xenograft model. We also observe that PHA and IL-7 expanded Vδ1 T cells show more potent cancer killing ability than those expanded with PHA and IL-2. Moreover, our protocol is superior in promoting the proliferation and survival of Vδ1 T cells than PHA and IL-2, which partly due to the cooperation of IL-2 and IL-7 signaling pathway. These findings suggest that Vδ1 T cells expanded by PHA and IL-7 may provide a potential alternative approach for γδT cell-based adoptive immunotherapy for human colon cancer.
Clinical trials show improved clinical outcomes of patients received Vδ2 T cell adoptive immunotherapy in hematologic malignancies,Citation5 but not in most solid tumors.Citation9-11 Thus developing novel strategies to improve the therapeutic effect of human γδT cell-based adoptive immunotherapy for solid tumors is drastically needed. It was reported that in vitro re-activated Vδ1 T cells isolated from the tumor-infiltrating lymphocytes (TIL) of colon cancer and melanoma were cytolytic to tumor cells.Citation13,26 In contrast, other previous studies suggested that the tumor-infiltrating Vδ1 T cells of human colon cancer and breast cancer predominantly were immunosuppressive cells with limited cancer cell killing potential.Citation20,27 Thus, we propose that circulating Vδ1 T cells would be an alternative candidate for adoptive immunotherapy. There was evidence that ex vivo expanded human PB Vδ1 T cells were capable of killing CMV infected cells and intestinal epithelial tumor cells.Citation18 Moreover, ex vivo expanded human PB Vδ1 T cells also had potent cytotoxicity against a variety of malignancies such as multiple myeloma cells,Citation15 B-cell chronic lymphocytic leukemia-derived cells,Citation16 neuroblastoma,Citation28 colon cancer, Citation29 and lymphoid leukemia cells.Citation25 However, the difference between freshly isolated human PB Vδ1 and Vδ2 T cells in tumorous reactivity has never been evaluated. Here, we find fresh human PB Vδ1 T cells express higher level of CD69, CD107a, Perforin, GranzymeB, TRAIL, and CD57 than Vδ2 T cells. Interestingly, Vδ1 T cells also highly express certain chemokine receptors, which may be related to their unique in vivo trafficking profiles. Moreover, we also demonstrate that human PB Vδ1 T cells have more potent tumoricidal activity directly against three colon cancer cell lines and counterpart sphere-forming cells than Vδ2 T cells. Freshly isolated Vδ1 T cells from PB of colon cancer patients also show higher tumoricidal activity against colon cancer cells than paired Vδ2 T cells. Therefore, our study suggests that human PB Vδ1 T cells, even in low level activated state, have more potent tumor killing ability, and it might be a better candidate for adoptive γδT cell immunotherapy, especially for solid tumors such as colon cancer. However, the major challenge of Vδ1 T cell-based clinical adoptive immunotherapy is to obtain sufficient cell numbers. Two recent studies have successfully propagated polyclonal γδT cells including Vδ1, Vδ2, and Vδ1– Vδ2– subsets using artificial APCs.Citation30,31 Besides, some experimental protocols based on the mitogen stimulation with Concanavalin A (Con A) or immobilized anti-CD3 mAbs have been established for a robust propagation of both Vδ1 and Vδ2 T cells.Citation16,32,33 Previous studies have reported that mitogen can preferentially expand human PB Vδ1 T cells to eliminate hematologic malignancies in vitro.Citation15,16,25 Despite the published protocols that generate Vδ1 T cells by other investigators, we firstly demonstrate that PHA and IL-7 preferentially promote the expansion of human PB Vδ1 T cells from both healthy donors and colon cancer patients in vitro, but not Vδ2 T cells. Moreover, our protocol induces Vδ1 T cells to express elevated levels of CD107a, GranzymeB, FasL, TRAIL, NKG2D, NKp30, NKp44, NKp46, CD57, LFA-1, which are crucial for Vδ1 T cells-mediated antitumor cytotoxicity. It has been reported that γδT cells expanded by TCR with anti-CD3 antibody or anti-TCRVδ1 antibody express increased level of T cell inhibitory receptor CTLA-4.Citation34,35 HMB-PP expanded Vδ2 T cells also express high level of PD-1,Citation36 suggestive of T cell exhaustion phenotype.Citation37 These studies indicate that ex vivo expanded Vδ2 T cells show activated exhaustion. However, our protocol expanded Vδ1 T cells express low level of CTLA-4 or PD-1, suggesting high cell viability after ex vivo activation and expansion. Above all, we demonstrate that Vδ1 T cells from both healthy donors and colon cancer patients expanded by our protocol show enhanced cytolytic activity against human colon cancer cells. A previous study reported that in vitro expanded Vδ1 T cells from PB in the medium containing TGF-β had a regulatory role.Citation35 Other studies showed that tumor-infiltrating Vδ1 T cells in breast cancer had a Treg-like subset.Citation27,38 Our recent study found there was also a dominant Th17-like subset in human colon cancer infiltrating-Vδ1 T cells which could be polarized by IL-23 in vitro.Citation20 This may be due to the difference of development origins and local microenvironment between tissues and tumor types. Here, we found PHA and IL-7 expanded Vδ1 T cells just expressed low levels of regulatory-related markers and cytokines (CD25, CTLA-4, and IL-10). Taken together, PHA and IL-7 may be used as a promising expansion protocol for potential Vδ1 T cells-mediated allogeneic and autologous cancer adoptive immunotherapy.
Several studies report that activated human PB Vδ1 T cells exert potent cancer cell killing activityCitation15,16,25 but the underlying mechanism is still largely elusive. We find PHA and IL-7 expanded Vδ1 T cells express higher levels of cytotoxicity-related molecules such as FasL, TRAIL, NKG2D, NKp30, NKp44, and NKp46 than Vδ2 T cells. In addition, cytotoxicity-related receptors and ligands including Fas, DR4, DR5, MICA/B, and ICAM-1 are highly expressed on both adherent and sphere-forming colon cancer cells. Moreover, blocking antibodies of FasL, TRAIL, NKG2D, NKp30, and LFA-1 can effectively inhibit the cytotoxic effect of expanded Vδ1 T cells against adherent and sphere-forming colon cancer cells. These data suggest that Vδ1 T cells are better killers depending, at least partly, on the synergy among these molecules.
Zol and IL-2 are commonly used for ex vivo expanding human PB γδ T cells, particularly for Vδ2 T cell expansion.Citation24,39 However, Zol and IL-2 expanded γδ T cells show limited success for solid tumor therapy in clinical trials.Citation9,11 A recent study demonstrates that the cytotoxicity of Vδ2 T cells is predominantly antibody dependent against neuroblastoma whereas Vδ1 T cells show significantly antibody independent cytotoxicity,Citation31 indicating that Vδ1 T cells may be more potent in direct tumor cell killing. Consistently, although Vδ2 T cells expanded by Zol plus IL-2 for 14 d may not reach the highest cytotoxic activity, we find the direct cytolytic effect of our protocol expanded Vδ1 T cells against adherent and sphere-forming colon cancer cells is stronger than that of Zol plus IL-2 expanded Vδ2 T cells at the same day after expansion. Moreover, Vδ2 T cells show little response to CSCs without Zol pretreatment.Citation22,40 Here, we find that PHA plus IL-7 expanded Vδ1 T cells can recognize sphere-forming colon cancer cells without any pretreatment in vitro and show more potent cytotoxicity than freshly isolated Vδ1 T cells or Zol plus IL-2 expanded Vδ2 T cells. It is worth noting that human colon carcinoma xenografted mice transferred with Vδ2 T cells expanded by Zol and IL-2 show no significant therapeutic effect in tumor growth inhibition and survival improvement as previously reported,Citation41 though tumor size decreases and survival is prolonged to some extent. This may be due to low numbers of transferred cells or their inability to migrate toward tumor or different tumor models. Hence, our study suggests that PHA and IL-7 expanded Vδ1 T cells are attractive candidate effector cells for cancer adoptive immunotherapy.
It is reported that IL-7 can promote the development and survival of γδTCR+ intraepithelial lymphocytes in mice.Citation42 γδTCR+ TIL obtained from colorectal cancer could be expanded in vitro in the presence of IL-7, which significantly enriched Vδ1 T cells.Citation13 In addition, previous study showed that PHA and IL-2 could selectively expand human Vδ1 T cells.25 Compared with PHA and IL-2 expansion protocol, we find that PHA and IL-7 show more advantage in Vδ1 T cell propagation through promoting its proliferation and survival. Our study suggests that our protocol is a better strategy to preferentially expand Vδ1 T cells than other reported protocols in vitro.
In summary, we demonstrate for the first time that freshly isolated Vδ1 T cells from both healthy donors and colon cancer patients are better killer cells against human colon cancer than Vδ2 T cells. We develop an optimized protocol to selectively expand Vδ1 T cells derived from both healthy donors and colon cancer patients with enhanced cytotoxicity against colon cancer. Moreover, the cancer cell killing capacity of γδT cells expanded by PHA and IL-7 is superior to those expanded by Zol and IL-2 due to the tumor-killing advantage of expanded Vδ1 T cells. We also find PHA and IL-7 have more advantages in the cytotoxicity, proliferation, and survival of Vδ1 T cells than PHA and IL-2. Furthermore, we demonstrate PHA and IL-7 can induce Vδ1 T cells to autocrine IL-2 to promote their proliferation and survival. Above all, PHA and IL-7 expanded Vδ1 T cells inhibit the tumor growth and prolong the survival of tumor-bearing mice. Besides, PHA and IL-7 expanded Vδ1 T cells have a better sphere-forming colon cancer cells killing activity than Vδ2 T cells in vitro. Therefore, our study provides a promising approach to improve γδT cell-based antitumor adoptive immunotherapy, particularly in solid tumors such as human colon cancer.
Materials and Methods
Cell preparation and isolation
PBMCs were collected from healthy donors from the Zhejiang Blood Center, all of whom were negative for antibodies against hepatitis C virus, hepatitis B virus, HIV, and syphilis. Some PB specimens were obtained from colon cancer patients at the Second Affiliated Hospital, Zhejiang University School of Medicine. The PB specimens were layered over Ficoll-Paque (GE Healthcare) and centrifuged for 30 min at 1,500 rpm. The interface containing mononuclear cells was collected and washed in PBS for twice. For γδT cell isolation, PBMCs were labeled with γδTCR microbeads (Miltenyi Biotec) and separated (to above 90% purity) by magnetic activated cell sorting (MACS) following the manufacturer's instruction. Vδ1 and Vδ2 T cells were further purified (to above 90% purity) by fluorescence activated cell sorting (FACS) with FITC-labeled anti-Vδ1 TCR antibody (GeneTex) and PerCP/Cy5.5-labeled anti-Vδ2 TCR antibody (BioLegend).
Cell culture
Isolated γδT cells (1 × 10⁶ cells/mL) were cultured in RPMI 1640 medium (Invitrogen Gibco) containing 10% FBS, 50 mg/mL of penicillin and streptomycin (Invitrogen Gibco) at 37°C. The cells were cultured in the presence of rhIL-7 (20 ng/mL, Peprotech) and PHA (1 μg/mL, Sigma-Aldrich), rhIL-2 (100 IU/mL, R&D) and PHA (1 μg/mL), or rhIL-2 (100 IU/mL) and Zol (5 μM, Novartis Pharmaceutials) with or without IL-2 or IL-7 neutralizing antibody (2 μg/mL, Peprotech) for 14 d. Cells were washed and the conditioned medium was replaced every 2–3 d.
Colon cancer cell lines
Human colon cancer cell lines HT29 and HCT116 were purchased from the American Type Culture Collection (ATCC) and Y cell line, obtained from hepatic metastatic tissue of a colon cancer patient, was established in our laboratory as previously reported.Citation43 HT29 and HCT116 cells were cultured in McCoy's 5A medium (Invitrogen Gibco) and Y cells were cultured in RPMI 1640 medium containing 10% FBS, 50 mg/mL of penicillin and streptomycin at 37°C. All sphere-forming cells were obtained by culturing HT29, HCT116 and Y cells in DMEM/F12 medium (Invitrogen Gibco) containing 2% FBS, 50 mg/mL of penicillin and streptomycin, 10 ng/mL basic fibroblast growth factor (bFGF), 20 ng/mL epidermal growth factor (EGF), 4 μg/ml heparin, and 1.25 μg/mL amphotericin B (all from Life Technologies) in low adhesion culture plates (Corning Costar) at 37°C for 14 d.
Flow cytometry
For extracellular staining, γδT cells were pre-incubated in a mixture of PBS, 2% fetal calf serum, and 0.1% (w/v) sodium azide with FcgIII/IIR-specific antibody to block nonspecific binding and stained with different combinations of fluorochrome-coupled antibodies (Table S1). For intracellular staining, γδT cells were activated by Leukocyte Activation Cocktail (BD PharMingen) for 6 h following the manufacturer's protocol. Cells were collected on a FACSCanto II system (BD Biosciences) and data were analyzed using FlowJo software (Tree Star).
Fluorescence activated cell sorting
To sort Vδ1 and Vδ2 T cells, fresh PBMCs and expanded γδT cells by PHA plus IL-7, PHA plus IL-2, and Zol plus IL-2 were stained with anti-Vδ1 TCR and anti-Vδ2 TCR and sorted on a FACSAriaII cell sorter (BD Biosciences). The purity of sorted cells was above 90% assessed by flow cytometry (FCM).
In vitro cytotoxicity assay
The cytotoxicity of γδT cells against cancer cells was measured by using CellTrace Far Red DDAO-SE kit (1 mM, Invitrogen) following the manufacturer's instruction. γδT cells and DDAO-SE-labeled adherent or sphere-forming colon cancer cells were incubated at an effector : target (E:T) ratio of 10:1 at 37oC and 5% CO2 in a round-bottom 96 wells plate. On the 4th h, PI (1 mg/mL, BD Biosciences) was added to the medium for another 15 min and DDAO-SE+ PI+ cells were analyzed by FCM. All the expanded effector cells were cultured for 14 d in vitro and all the E:T ratio was 10:1 unless otherwise noted. The specific lysis of target cells was calculated as follows: % of specific lysis = (CT – TE) / CT × 100%, where CT indicates mean number of fluorescent target cells in control tubes without effector cells and TE indicates mean number of fluorescent cells in target plus effector cells.
RNA extraction and gene expression by qPCR
Total RNAs were extracted with the RNeasy Micro Kit (QIAGEN) and reverse transcribed into cDNA by oligo-dT primer (Invitrogen) and Superscript First Strand Synthesis System (Invitrogen). cDNA was analyzed by real-time PCR (RT-PCR) with SYBR Green I Master Mix (Invitrogen) on the StepOne Plus instrument (Applied Biosystems) for the target genes (Table S2). Data were presented as arbitrary units and calculated as 2(Ct(GAPDH–gene of interest)).
γδT cell proliferation assay
Purified γδT cells were labeled with CFSE (0.5 mM, Invitrogen) and then stimulated with different stimuli for 14 d. γδT cells were collected and the CSFE– cells were detected by FCM.
Apoptosis assay
The apoptosis of γδT cells was assessed by Annexin V-APC (BD PharMingen) and PI staining following the manufacturer's instruction. Annexin-V+ and PI+ cells were analyzed on a FACSCantoII system (BD Biosciences).
In vitro neutralizing antibody blocking experiment
To investigate the effects of FasL, TRAIL, NKG2D, NKp30, and LFA-1 in Vδ1 T cell-mediated cancer cell lysis, blocking antibodies (10 mg/mL each) against FasL, TRAIL, NKG2D, NKp30, and LFA-1 (all from BioLegend) were pre-incubated for 2 h and maintained in the co-culture medium during the killing assay. For Vδ1 T cell proliferation assay, CFSE-labeled cells were maintained in conditioned medium (Medium, PHA plus IL-7, PHA, IL-7, and anti-rhIL-2 neutralizing antibody (AbIL-2) or PHA, IL-7, AbIL-2, and AbIL-7) for 14 d, and TCRVδ1+ CFSE– cells were detected by FCM. For apoptosis assay, unlabeled cells were maintained in the conditioned medium (Medium, PHA plus IL-7, PHA, IL-7 and AbIL-2 or PHA, IL-7, AbIL-2, and AbIL-7) for 14 d respectively, and then PI was added to the medium for another 15 min. The TCRVδ1+ PI+ cells were detected by FCM. The AbIL-2, AbIL-7 and control rabbit IgG (2 μg/mL, all from Peprotech) were used in neutralizing antibody blocking experiment.
ELISA assay
To detect IL-2 production by γδT cells, sorted γδT cells were stimulated with or without PHA, IL-7 or PHA plus IL-7 for 14 d. The concentration of IL-2 in the culture supernatants was measured by ELISA kit (R&D Systems) according to the manufacturer's protocol.
Immunofluorescent staining and H&E staining
Paraffin-embedded and formalin-fixed samples were cut into 5-μm sections, which were then processed for IF staining or H&E staining. After incubation with antibodies against human CD45 (BioLegend), followed by Dylight 633-conjugated goat anti-rabbit IgG (Invitrogen), images were acquired with a confocal microscopy (Zeiss LSM 710, Carl Zeiss).
In vivo human colon carcinoma xenograft tumor model
Nonobese diabetic/severe combined immunodeficient (NOD/SCID) mice of male, 4- to 6-week old were used to determine the in vivo antitumor efficacy of the γδT cells expanded by PHA plus IL-7, and Zol plus IL-2, respectively. In brief, 5 × 10⁴ cells of human colon cancer cell line HT29 were subcutaneously injected. On the following day 3, 1 × 10⁶/100 μL γδT cells expanded with PHA plus IL-7, or Zol plus IL-2 were intravenously injected into mice (n = 5 for each group) for five times every third days. Mice injected with 100 μL PBS were used as controls (n = 5). Tumor progression was monitored by measuring tumor diameter with caliper. Tumor volume was calculated by length (mm) × width (mm) × height (mm). In some protocols, survival of tumor-bearing mice was also recorded.
Statistical analysis
Results were expressed as means ± SEM. Comparisons between groups were made by the Student's t-test, paired t-test and ANOVA as appropriate. For the survival analysis, Kalper–Meier curves were constructed and compared by log-rank test. p value < 0.05 was considered statistically significant. Prism Graph Pad version 6.1 was used for all statistical calculations.
Disclosure of Potential Conflicts of Interest
No potential conflicts of interest were disclosed.
Supplemental Material
Supplemental data for this article can be accessed on the publisher's website.
992749_Supplementary_Materials.zip
Download Zip (768 KB)Acknowledgments
The authors thank the technical assistance of Hao Wu.
Funding
This work was supported by grants from the Science and Technology Department of Zhejiang Province (2011c13034∼1, JH), the Ministry of Health of Zhejiang Province (2012ZDA021, JH), Natural Science Foundation of Zhejiang Province (Y2110034, FMQ; Y2100414, ZT; Z2100366, JH, LY14H160031 and Y2090386, XGW) and the NIH (R01CA150947 and P01CA163223, JY). This work was also funded by the Zhejiang Provincial Program for the Cultivation of High-level Innovative Health Talents (JH), the Zhejiang Province Key Discipline of Traditional Chinese Medicine (2012-XK-A27, JH) and Key Innovation Discipline of Medicine (2011-CX11, JH). This work was also supported by the National Natural Science Foundation of China (NSFC 81472640) and the Qianjiang Talent Program of Zhejiang Province (2013R10053).
References
- Chien YH, Meyer C, Bonneville M. gammadelta T cells: first line of defense and beyond. Annu Rev Immunol 2014;32:121-55; PMID:24387714; http://dx.doi.org/10.1146/annurev-immunol-032713-120216
- Groh V, Porcelli S, Fabbi M, Lanier LL, Picker LJ, Anderson T, Warnke RA, Bhan AK, Strominger JL, Brenner MB. Human lymphocytes bearing T cell receptor gamma/delta are phenotypically diverse and evenly distributed throughout the lymphoid system. J Exp Med 1989;169:1277-94; PMID:2564416; http://dx.doi.org/10.1084/jem.169.4.1277
- Hayday AC. ; gamma; delta cells: a right time and a right place for a conserved third way of protection. Annu Rev Immunol 2000;18:975-1026; PMID:10837080; http://dx.doi.org/10.1146/annurev.immunol.18.1.975
- Bottino C, Tambussi G, Ferrini S, Ciccone E, Varese P, Mingari MC, Moretta L, Moretta A. Two subsets of human T lymphocytes expressing gamma/delta antigen receptor are identifiable by monoclonal antibodies directed to two distinct molecular forms of the receptor. J Exp Med 1988;168:491-505; PMID:2970517; http://dx.doi.org/10.1084/jem.168.2.491
- Castella B, Vitale C, Coscia M, Massaia M. Vgamma9Vdelta2 T cell-based immunotherapy in hematological malignancies: from bench to bedside. Cell Mol Life Sci 2011;68:2419-32; PMID:21584812; http://dx.doi.org/10.1007/s00018-011-0704-8
- Wilhelm M, Kunzmann V, Eckstein S, Reimer P, Weissinger F, Ruediger T, Tony HP. Gammadelta T cells for immune therapy of patients with lymphoid malignancies. Blood 2003;102:200-6; PMID:12623838; http://dx.doi.org/10.1182/blood-2002-12-3665
- Gomes AQ, Martins DS, Silva-Santos B. Targeting gammadelta T lymphocytes for cancer immunotherapy: from novel mechanistic insight to clinical application. Cancer Res 2010;70:10024-7; PMID:21159627; http://dx.doi.org/10.1158/0008-5472.CAN-10-3236
- Braza MS, Klein B. Anti-tumour immunotherapy with Vgamma9Vdelta2 T lymphocytes: from the bench to the bedside. Br J Haematol 2013;160:123-32; PMID:23061882; http://dx.doi.org/10.1111/bjh.12090
- Nicol AJ, Tokuyama H, Mattarollo SR, Hagi T, Suzuki K, Yokokawa K, Nieda M. Clinical evaluation of autologous gamma delta T cell-based immunotherapy for metastatic solid tumours. Br J Cancer 2011;105:778-86; PMID:21847128; http://dx.doi.org/10.1038/bjc.2011.293
- Kunzmann V, Smetak M, Kimmel B, Weigang-Koehler K, Goebeler M, Birkmann J, Becker J, Schmidt-Wolf IG, Einsele H, Wilhelm M. Tumor-promoting versus tumor-antagonizing roles of gammadelta T cells in cancer immunotherapy: results from a prospective phase I/II trial. J Immunother 2012;35:205-13; PMID:22306909; http://dx.doi.org/10.1097/CJI.0b013e318245bb1e
- Noguchi A, Kaneko T, Kamigaki T, Fujimoto K, Ozawa M, Saito M, Ariyoshi N, Goto S. Zoledronate-activated Vgamma9gammadelta T cell-based immunotherapy is feasible and restores the impairment of gammadelta T cells in patients with solid tumors. Cytotherapy 2011;13:92-7; PMID:20831354; http://dx.doi.org/10.3109/14653249.2010.515581
- Bonneville M, O'Brien RL, Born WK. Gammadelta T cell effector functions: a blend of innate programming and acquired plasticity. Nat Rev Immunol 2010;10:467-78; PMID:20539306; http://dx.doi.org/10.1038/nri2781
- Maeurer MJ, Martin D, Walter W, Liu K, Zitvogel L, Halusczcak K, Rabinowich H, Duquesnoy R, Storkus W, Lotze MT. Human intestinal Vdelta1+ lymphocytes recognize tumor cells of epithelial origin. J Exp Med 1996;183:1681-96; PMID:8666926; http://dx.doi.org/10.1084/jem.183.4.1681
- Groh V, Rhinehart R, Secrist H, Bauer S, Grabstein KH, Spies T. Broad tumor-associated expression and recognition by tumor-derived gamma delta T cells of MICA and MICB. Proc Natl Acad Sci U S A 1999;96:6879-84; PMID:10359807; http://dx.doi.org/10.1073/pnas.96.12.6879
- Knight A, Mackinnon S, Lowdell MW. Human Vdelta1 gamma-delta T cells exert potent specific cytotoxicity against primary multiple myeloma cells. Cytotherapy 2012;14:1110-8; PMID:22800570; http://dx.doi.org/10.3109/14653249.2012.700766
- Siegers GM, Dhamko H, Wang XH, Mathieson AM, Kosaka Y, Felizardo TC, Medin JA, Tohda S, Schueler J, Fisch P et al. Human Vdelta1 gammadelta T cells expanded from peripheral blood exhibit specific cytotoxicity against B-cell chronic lymphocytic leukemia-derived cells. Cytotherapy 2011;13:753-64; PMID:21314241; http://dx.doi.org/10.3109/14653249.2011.553595
- Knight A, Arnouk H, Britt W, Gillespie GY, Cloud GA, Harkins L, Su Y, Lowdell MW, Lamb LS. CMV-independent lysis of glioblastoma by ex vivo expanded/activated Vdelta1+ gammadelta T cells. PLoS One 2013;8:e68729; PMID:23950874; http://dx.doi.org/10.1371/journal.pone.0068729
- Halary F, Pitard V, Dlubek D, Krzysiek R, de la Salle H, Merville P, Dromer C, Emilie D, Moreau JF, Dechanet-Merville J. Shared reactivity of V{delta}2(neg) {gamma}{delta} T cells against cytomegalovirus-infected cells and tumor intestinal epithelial cells. J Exp Med 2005;201:1567-78; PMID:15897274; http://dx.doi.org/10.1084/jem.20041851
- Benzaid I, Monkkonen H, Bonnelye E, Monkkonen J, Clezardin P. In vivo phosphoantigen levels in bisphosphonate-treated human breast tumors trigger Vgamma9Vdelta2 T-cell antitumor cytotoxicity through ICAM-1 engagement. Clin Cancer Res 2012;18:6249-59; PMID:23032740; http://dx.doi.org/10.1158/1078-0432.CCR-12-0918
- Wu P, Wu D, Ni C, Ye J, Chen W, Hu G, Wang Z, Wang C, Zhang Z, Xia W et al. gammadeltaT17 cells promote the accumulation and expansion of myeloid-derived suppressor cells in human colorectal cancer. Immunity 2014;40:785-800; PMID:24816404; http://dx.doi.org/10.1016/j.immuni.2014.03.013
- Delmas D, Rebe C, Micheau O, Athias A, Gambert P, Grazide S, Laurent G, Latruffe N, Solary E. Redistribution of CD95, DR4 and DR5 in rafts accounts for the synergistic toxicity of resveratrol and death receptor ligands in colon carcinoma cells. Oncogene 2004;23:8979-86; PMID:15480430; http://dx.doi.org/10.1038/sj.onc.1208086
- Todaro M, D'Asaro M, Caccamo N, Iovino F, Francipane MG, Meraviglia S, Orlando V, La Mendola C, Gulotta G, Salerno A et al. Efficient killing of human colon cancer stem cells by gammadelta T lymphocytes. J Immunol 2009;182:7287-96; PMID:19454726; http://dx.doi.org/10.4049/jimmunol.0804288
- Dippold W, Wittig B, Schwaeble W, Mayet W, Meyer zum Buschenfelde KH. Expression of intercellular adhesion molecule 1 (ICAM-1, CD54) in colonic epithelial cells. Gut 1993;34:1593-7; PMID:7902311; http://dx.doi.org/10.1136/gut.34.11.1593
- Kondo M, Izumi T, Fujieda N, Kondo A, Morishita T, Matsushita H, Kakimi K. Expansion of human peripheral blood gammadelta T cells using zoledronate. J Vis Exp 2011; 55:3182; PMID:21931292; http://dx.doi.org/10.3791/3182
- Correia DV, Fogli M, Hudspeth K, da Silva MG, Mavilio D, Silva-Santos B. Differentiation of human peripheral blood Vdelta1+ T cells expressing the natural cytotoxicity receptor NKp30 for recognition of lymphoid leukemia cells. Blood 2011;118:992-1001; PMID:21633088; http://dx.doi.org/10.1182/blood-2011-02-339135
- Donia M, Ellebaek E, Andersen MH, Straten PT, Svane IM. Analysis of Vdelta1 T cells in clinical grade melanoma-infiltrating lymphocytes. Oncoimmunology 2012;1:1297-304; PMID:23243593; http://dx.doi.org/10.4161/onci.21659
- Peng G, Wang HY, Peng W, Kiniwa Y, Seo KH, Wang RF. Tumor-infiltrating gammadelta T cells suppress T and dendritic cell function via mechanisms controlled by a unique toll-like receptor signaling pathway. Immunity 2007;27:334-48; PMID:17656116; http://dx.doi.org/10.1016/j.immuni.2007.05.020
- Schilbach K, Frommer K, Meier S, Handgretinger R, Eyrich M. Immune response of human propagated gammadelta-T-cells to neuroblastoma recommend the Vdelta1+ subset for gammadelta-T-cell-based immunotherapy. J Immunother 2008;31:896-905; PMID:18832998; http://dx.doi.org/10.1097/CJI.0b013e31818955ad
- Maeurer M, Zitvogel L, Elder E, Storkus WJ, Lotze MT. Human intestinal V delta 1+ T cells obtained from patients with colon cancer respond exclusively to SEB but not to SEA. Nat Immun 1995;14:188-97; PMID:8696008
- Deniger DC, Maiti S, Mi T, Switzer K, Ramachandran V, Hurton LV, Ang S, Olivares S, Rabinovich BA, Huls H et al. Activating and propagating polyclonal gamma delta T cells with broad specificity for malignancies. Clin Cancer Res 2014; 20(22):5708-19; PMID:24833662; http://dx.doi.org/10.1158/1078-0432
- Fisher J, Yan M, Heuijerjans J, Carter L, Abolhassani A, Frosch J, Wallace R, Flutter B, Hubank M, Klein N et al. Neuroblastoma killing properties of V-delta 2 and V-delta2 negative gamma delta T cells following expansion by artificial antigen presenting cells. Clin Cancer Res 2014; 20(22):5720-32; http://dx.doi.org/10.1158/1078-0432
- Siegers GM, Ribot EJ, Keating A, Foster PJ. Extensive expansion of primary human gamma delta T cells generates cytotoxic effector memory cells that can be labeled with Feraheme for cellular MRI. Cancer Immunol Immunother 2013;62:571-83; PMID:23100099; http://dx.doi.org/10.1007/s00262-012-1353-y
- Dokouhaki P, Han M, Joe B, Li M, Johnston MR, Tsao MS, Zhang L. Adoptive immunotherapy of cancer using ex vivo expanded human gammadelta T cells: A new approach. Cancer Lett 2010;297:126-36; PMID:20537791; http://dx.doi.org/10.1016/j.canlet.2010.05.005
- Peters C, Oberg HH, Kabelitz D, Wesch D. Phenotype and regulation of immunosuppressive Vdelta2-expressing gammadelta T cells. Cell Mol Life Sci 2014;71:1943-60; PMID:24091816; http://dx.doi.org/10.1007/s00018-013-1467-1
- Hua F, Kang N, Gao YA, Cui LX, Ba DN, He W. Potential regulatory role of in vitro-expanded Vdelta1 T cells from human peripheral blood. Immunol Res 2013;56:172-80; PMID:23532670; http://dx.doi.org/10.1007/s12026-013-8390-2
- Iwasaki M, Tanaka Y, Kobayashi H, Murata-Hirai K, Miyabe H, Sugie T, Toi M, Minato N. Expression and function of PD-1 in human gammadelta T cells that recognize phosphoantigens. Eur J Immunol 2011;41:345-55; PMID:21268005; http://dx.doi.org/10.1002/eji.201040959
- Utzschneider DT, Legat A, Fuertes Marraco SA, Carrie L, Luescher I, Speiser DE, Zehn D. T cells maintain an exhausted phenotype after antigen withdrawal and population reexpansion. Nat Immunol 2013;14:603-10; PMID:23644506; http://dx.doi.org/10.1038/ni.2606
- Ye J, Ma C, Hsueh EC, Eickhoff CS, Zhang Y, Varvares MA, Hoft DF, Peng G. Tumor-derived gammadelta regulatory T cells suppress innate and adaptive immunity through the induction of immunosenescence. J Immunol 2013;190:2403-14; PMID:23355732; http://dx.doi.org/10.4049/jimmunol.1202369
- Kondo M, Sakuta K, Noguchi A, Ariyoshi N, Sato K, Sato S, Sato K, Hosoi A, Nakajima J, Yoshida Y et al. Zoledronate facilitates large-scale ex vivo expansion of functional gammadelta T cells from cancer patients for use in adoptive immunotherapy. Cytotherapy 2008;10:842-56; PMID:19016372; http://dx.doi.org/10.1080/14653240802419328
- Nishio N, Fujita M, Tanaka Y, Maki H, Zhang R, Hirosawa T, Demachi-Okamura A, Uemura Y, Taguchi O, Takahashi Y et al. Zoledronate sensitizes neuroblastoma-derived tumor-initiating cells to cytolysis mediated by human gammadelta T cells. J Immunother 2012;35:598-606; PMID:22996365; http://dx.doi.org/10.1097/CJI.0b013e31826a745a
- Devaud C, Bilhere E, Loizon S, Pitard V, Behr C, Moreau JF, Dechanet-Merville J, Capone M. Antitumor activity of gammadelta T cells reactive against cytomegalovirus-infected cells in a mouse xenograft tumor model. Cancer Res 2009;69:3971-8; PMID:19383918; http://dx.doi.org/10.1158/0008-5472.CAN-08-3037
- Shitara S, Hara T, Liang B, Wagatsuma K, Zuklys S, Hollander GA, Nakase H, Chiba T, Tani-ichi S, Ikuta K. IL-7 produced by thymic epithelial cells plays a major role in the development of thymocytes and TCRgammadelta+ intraepithelial lymphocytes. J Immunol 2013;190:6173-9; PMID:23686483; http://dx.doi.org/10.4049/jimmunol.1202573
- Wang YK, Zhu YL, Qiu FM, Zhang T, Chen ZG, Zheng S, Huang J. Activation of Akt and MAPK pathways enhances the tumorigenicity of CD133+ primary colon cancer cells. Carcinogenesis 2010;31:1376-80; PMID:20530554; http://dx.doi.org/10.1093/carcin/bgq120