
Abstract
Lipopolysaccharide (LPS)-induced activation of TLR4 (toll-like receptor 4) is followed by a subsequent overwhelming inflammatory response, a hallmark of the first phase of sepsis. Therefore, counteracting excessive innate immunity by autophagy is important to contribute to the termination of inflammation. However, the exact molecular details of this interplay are only poorly understood. Here, we show that PELI3/Pellino3 (pellino E3 ubiquitin protein ligase family member 3), which is an E3 ubiquitin ligase and scaffold protein in TLR4-signaling, is impacted by autophagy in macrophages (MΦ) after LPS stimulation. We noticed an attenuated mRNA expression of proinflammatory Il1b (interleukin 1, β) in Peli3 knockdown murine MΦ in response to LPS treatment. The autophagy adaptor protein SQSTM1/p62 (sequestosome 1) emerged as a potential PELI3 binding partner in TLR4-signaling. siRNA targeting Sqstm1 and Atg7 (autophagy related 7), pharmacological inhibition of autophagy by wortmannin as well as blocking the lysosomal vacuolar-type H+-ATPase by bafilomycin A1 augmented PELI3 protein levels, while inhibition of the proteasome had no effect. Consistently, treatment to induce autophagy by MTOR (mechanistic target of rapamycin (serine/threonine kinase)) inhibition or starvation enhanced PELI3 degradation and reduced proinflammatory Il1b expression. PELI3 was found to be ubiquitinated upon LPS stimulation and point mutation of PELI3-lysine residue 316 (Lys316Arg) attenuated Torin2-dependent degradation of PELI3. Immunofluorescence analysis revealed that PELI3 colocalized with the typical autophagy markers MAP1LC3B/LC3B (microtubule-associated protein 1 light chain 3 β) and LAMP2 (lysosomal-associated membrane protein 2). Our observations suggest that autophagy causes PELI3 degradation during TLR4-signaling, thereby impairing the hyperinflammatory phase during sepsis.
Abbreviations:
- ACTB, actin, beta
- ATG7, autophagy-related 7
- Baf A1, bafilomycin A1
- BECN1, Beclin 1, autophagy related
- CHX, cycloheximide
- Epoxo, epoxomycin
- HBSS, Hank's balanced salt solution
- IL1B, interleukin 1, beta
- IRAKs, interleukin-1 receptor-associated kinases
- LAMP2, lysosomal-associated membrane protein 2
- LPS, lipopolysaccharide
- MAP3K7, mitogen-activated protein kinase kinase kinase 7
- MAP3K14, mitogen-activated protein kinase kinase kinase 14
- MAP1LC3B, microtubule-associated protein 1 light chain 3 beta
- MAPK1/3, mitogen-activated protein kinase 1/3
- MAPK8/9, mitogen-activated protein kinase 8/9
- MAPK14, mitogen-activated protein kinase 14
- MΦ, macrophages
- MTOR, mechanistic target of rapamycin (serine/threonine kinase)
- MYD88, myeloid differentiation primary response 88
- NFE2L2, nuclear factor, erythroid 2-like 2
- NFKB, nuclear factor of kappa light polypeptide gene enhancer in B-cells
- NLRP3, NLR family, pyrin domain containing 3
- PELI3, pellino E3 ubiquitin protein ligase family member 3
- PRRs, pattern recognition receptors
- Rapa, rapamycin
- RIPK1, receptor (TNFRSF)-interacting serine-threonine kinase 1
- SQSTM1, sequestosome 1
- TABs, TGF-beta activated kinase 1/MAP3K7 binding protein 1/2/3
- TBK1, TANK-binding kinase 1
- TICAM1, toll-like receptor adaptor molecule 1
- TLRs, toll-like receptors
- TNF, tumor necrosis factor
- TRAF6, TNF receptor-associated factor 6, E3 ubiquitin protein ligase
- TUBB, tubulin, beta class I
- UBB, ubiquitin B
- Wortm, wortmannin
- WT, wildtype
Introduction
The immune system is characterized by a host defense against invading pathogens and can be divided into the innate and the adaptive arm. In contrast to the acquired immunity, the innate system reacts immediately by docking highly conserved pathogen structures, termed pathogen-associated molecular patterns, to a restricted number of pattern recognition receptors (PRRs).Citation1 These PRRs, expressed especially on antigen-presenting cells like macrophages (MΦ), dendritic cells, and B cells, trigger a PRR-dependent signaling cascade and finally constitute a proinflammatory response.Citation2 Among these PRRs, the TLRs (toll-like-receptors) are one of the major receptor families. Up to now 11 TLRs have been identified in mammals.Citation3 TLR4, as one prominent family member, recognizes lipopolysaccharide (LPS), which is part of the outer membrane of gram-negative bacteria. MYD88 (myeloid differentiation primary response 88) and TICAM1/TRIF (toll-like receptor adaptor molecule 1) are the 2 key adaptor proteins for LPS-TLR4 signal transduction. MYD88 activates adaptor molecules like the family of IRAKs (interleukin-1 receptor-associated kinases), TRAF6 (TNF receptor-associated factor 6, E3 ubiquitin protein ligase), as well as MAP3K7/TAK1 (mitogen-activated protein kinase kinase kinase 7) and the TABs (TGF-β activated kinase 1/MAP3K7 binding protein 1/2/3). This conserved process activates the transcription factors NFKB (nuclear factor of kappa light polypeptide gene enhancer in B-cells) and AP-1 (activator protein-1) via activation of IKBKB/IKK (inhibitor of kappa light polypeptide gene enhancer in B-cells, kinase β) and mitogen-activated protein kinase (MAPK) cascades, respectively. Both NFKB and AP-1 activate proinflammatory cytokine expression e.g., Il1b (interleukin 1, β) and Tnf (tumor necrosis factor).Citation4 Further, TICAM1-dependent signaling is mediated by the adaptor and effector proteins TBK1 (TANK-binding kinase 1), TRAF6, and RIPK1 (receptor (TNFRSF)-interacting serine-threonine kinase 1) controlling IFNA1 (interferon, α 1) as well as proinflammatory cytokine expression induced by activation of IRF3 (interferon regulatory factor 3) and NFKB.Citation5,6
Sepsis is a serious clinical disease triggered by the immune system and the TLR signaling cascade in response to a systemic reaction against infectious pathogens.Citation7 Sepsis is characterized by a misbalance of pro- and antiinflammatory responses, causing an excessive inflammation with high levels of proinflammatory cytokines essential to kill pathogens and later on limiting inflammatory events, which lead to an immunosuppressive phenomenon.Citation8,9 The pattern-recognition system as well as proinflammatory mediators are considered to be potential therapeutic targets in sepsis.Citation9 To combine characteristics of hyperinflammation in sepsis with the innate immune system, we examined the regulatory potential of PELI3/Pellino3 (pellino E3 ubiquitin protein ligase family member 3) in the TLR4 signaling pathway. The E3 ubiquitin ligase and scaffold protein PELI3 belongs to a new family of evolutionary conserved proteins in the TLR signaling cascade.Citation10,11 So far, PELI3 is implicated as activator of MAPK14/p38α, MAPK8/JNK1-MAPK9/JNK2, and MAPK1/ERK2-MAPK3/ERK1 signaling cascades of TLR/IL1R pathways.Citation12-15 Furthermore, PELI3′s really interesting new gene (RING) domain, responsible for its E3 ubiquitin ligase activity, is necessary for IRAK1 ubiquitination and therefore promotes signal transduction.Citation16 Interestingly, TLR signaling is also connected to autophagy-dependent processes by recruiting BECN1/Beclin1 (Beclin 1, autophagy related), one of the key factors in autophagosome formation.Citation17 Autophagy is a fundamental immunological process within the cell, essential for elimination of microorganisms, control of inflammation, and secretion of immune mediators but also has an impact on adaptive immunity.Citation18 Autophagy dampens excessive inflammation in TLR signaling and acts as a negative modulator in the innate immune system.Citation19 It has been shown that autophagy deficiency in septic-conditioned mice augments proinflammatory responses.Citation20 Therefore, we focused our interest on the TLR signaling component PELI3 and its potential role in autophagy, following LPS-induced TLR4-activation to mimic septic conditions.
Results
Peli3 knockdown inhibits LPS-dependent proinflammatory cytokine expression
PELI3 has been discovered as a protein upstream of the MAPK14 that is essential for a proinflammatory cytokine response and autophagy is known to play a pivotal role in inflammatory processes especially the regulation of proinflammatory cytokines.Citation13,21,22 To elucidate the role of PELI3 in regulating Il1b and Tnf expression pattern, we generated a stable lentiviral-mediated knockdown of Peli3 in RAW264.7 cells and BMDMΦ. In RAW264.7 cells, protein and mRNA levels of silenced Peli3 in untreated and LPS-treated conditions were reduced by 70% (A and C) and also primary macrophages showed a significant decline of Peli3 mRNA expression (G). Transient depletion of Peli3 in J774A.1 cells using siRNA was similarly effective on protein and mRNA expression (B and D). The classical proinflammatory cytokines Il1b and Tnf are known to be upregulated following LPS stimulation.Citation23 In Peli3-depleted cells, Il1b mRNA was significantly downregulated after 6 h LPS treatment (E, F, and H). This mRNA decline was also evident for PRO-IL1B protein in J774A.1 MΦ deficient for Peli3 compared with control-transfected cells (B). Similar results were obtained for Tnf mRNA expression (Fig. S1). Thus, PELI3 impacts on LPS-dependent proinflammatory Il1b and Tnf expression.
Figure 1. Peli3 knockdown inhibits LPS-dependent proinflammatory cytokine expression. RAW264.7 cells (A, C, and E) and BMDMΦ (G and H) stably transduced with shPeli3 or shctrl and J774A.1 cells (B, D, and F) transiently transfected with siPeli3 or sictrl were incubated with LPS for 6 h or remained as controls. (A and B) Functional Peli3 knockdown was determined on protein level by western blot analysis. (B) PRO-IL1B protein expression in Peli3-deficient J774A.1 cells was analyzed. RNA was isolated and mRNA expression of Peli3 (C, D, and G) and Il1b (E, F, and H) were analyzed using qPCR. mRNA levels were normalized to Tbp mRNA levels. Data represent the mean ± SEM of at least 3 individual experiments (*P < 0.05; **P < 0.01 vs. stimulated shctrl or sictrl).
LPS stimulation induces PELI3 binding to the autophagy adaptor protein SQSTM1
Given PELI3's function in IL1β regulation, we examined PELI3 binding partners upon LPS stimulation using immunoprecipitation (IP) coupled to mass spectrometry (IP-MS). Using RAW264.7 cells stably expressing FLAG-tagged PELI3, we identified a peptide matching to SQSTM1/p62 (sequestosome 1) in PELI3 immune complexes derived from cells treated with LPS for 6 h (Fig. S2; Table S1). To verify our MS result, we performed immunoblot analysis of IP and total lysate (TL) samples. Protein abundance of FLAG-tagged PELI3 and SQSTM1 as well as their association increased gradually in a time-dependent manner in response to LPS treatment (A and B). In cells, PELI3 was significantly found to partially colocalize in puncta with SQSTM1 upon LPS stimulation (D).
Figure 2. LPS stimulation induces PELI3 binding to the autophagy adaptor protein SQSTM1. (A and B) RAW264.7 cells stably overexpressing FLAG-tagged PELI3 were stimulated with LPS for 3 h and 6 h or remained untreated as control. After cell lysis IP of FLAG-tagged PELI3 (A) was performed with FLAG-antibody and Dynabeads® and for SQSTM1-IP (B) Dynabeads® were coupled with SQSTM1-antibody. (A) SQSTM1 to FLAG-PELI3 IP-interaction (SQSTM1/FLAG) is shown in the densitometric quantification, representing the mean ± SEM of at least 3 individual experiments (*P < 0.05 vs. unstimulated sample). (C and D) Immunofluorescence analysis of PELI3 colocalization with autophagy markers. RAW264.7 cells overexpressing FLAG-tagged PELI3 were subjected to 6 h LPS treatment, fixed and stained with an anti-FLAG antibody and antibodies against endogenous MAP1LC3B (C) and SQSTM1 (D), respectively. Nuclei were counterstained by Hoechst 33342. Representative images of at least 3 individual experiments are shown. Arrows indicate colocalization of FLAG-tagged PELI3 and MAP1LC3B or SQSTM1. Scale bars: 5 μm. (D) Colocalization of FLAG-PELI3 with SQSTM1 is quantified by the Pearsons correlation coefficient (FLAG/SQSTM1) and represents the mean ± SEM of at least 3 individual experiments (***P < 0.001 vs. unstimulated sample).
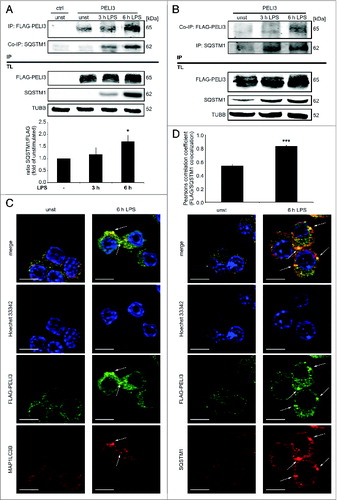
Furthermore, in connection with SQSTM1's function as autophagy receptor, we examined the localization of the autophagosome marker MAP1LC3B upon LPS stimulation. Similar to SQSTM1, FLAG-tagged PELI3 colocalized in puncta with MAP1LC3B in LPS-treated cells (C). Based on these results, we suggest a connection between PELI3 and autophagy.
Autophagy inhibition stabilizes PELI3 protein
Since SQSTM1 is a key player connecting both autophagosomal and proteasomal degradation, we sought to understand how these 2 pathways affect PELI3 protein stability upon LPS stimulation using the lysosomal ATPase inhibitor bafilomycin A1 (Baf A1) and the proteasomal inhibitor MG-132, respectively.Citation24-26 Pretreatment with Baf A1 was performed 30 min before 6 h LPS treatment and MG-132 was added to the LPS stimulation for 4 h prior harvesting, in each case according to the literature.Citation27,28 LPS-induced PELI3 protein levels in RAW264.7 cells increased further in the presence of Baf A1, whereas MG-132 did not alter LPS-induced PELI3 abundance (A, upper panel).
Figure 3 (See previous page). Autophagy inhibition stabilizes PELI3 protein. (A) RAW264.7 cells were treated with LPS for 6 h in combination with the lysosomal V-ATPase inhibitor bafilomycin A1 (Baf A1), the proteasomal inhibitor MG-132 or DMSO as a control. Protein abundance of SQSTM1, PELI3 and MAP1LC3B was analyzed by western blot. Densitometric quantification of PELI3 is shown and represents the mean ± SEM of at least 3 individual experiments (*P < 0.05; ***P < 0.001 vs. corresponding control). (B) RAW264.7 cells were treated with LPS for 6 h in combination with the specific proteasomal inhibitor epoxomicin (Epoxo) or DMSO as a control. Densitometric quantification of PELI3 protein level is shown and represents the mean ± SEM of at least 3 individual experiments (fold of 6 h LPS + DMSO). (C) PELI3 protein expression was analyzed by western blot in RAW264.7 cells treated with LPS and the autophagy inhibitor wortmannin (Wortm) or DMSO control. Densitometric quantification is provided and represents the mean ± SEM of at least 3 individual experiments (*P < 0.05 vs. DMSO + 6 h LPS). (D) Immunofluorescence staining of endogenous MAP1LC3B and overexpressed FLAG-tagged PELI3 in RAW264.7 cells was determined for unstimulated as well as LPS plus DMSO and Baf A1 treatments, respectively, as described before. Nuclei were counterstained by Hoechst 33342. Representative images of at least 3 individual experiments are shown. Arrows indicate colocalization of FLAG-tagged PELI3 and MAP1LC3B. Scale bars: 5 μm. RAW264.7 cells were transiently transfected with sictrl or 2 siRNA targeting Sqstm1 (E) or Atg7 (F) prior to LPS or mock treatment. Analysis of PELI3 and the correspondent siRNA target at protein levels.
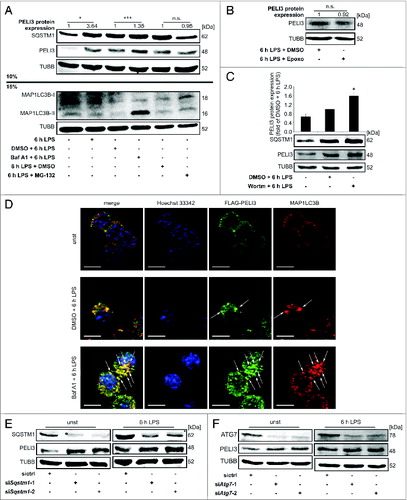
Although MG-132 is a potent proteasome inhibitor, new and more specific proteasome inhibitors such as epoxomicin (Epoxo) with selective and irreversible properties are available.Citation29 Thus, we performed an experiment similar to the MG-132 setting by adding Epoxo for 4 h after 2 h LPS stimulation. Comparable to MG-132, blocking the proteasome irreversible with Epoxo showed no significant change in PELI3 protein expression (B).
As autophagy inhibition by blocking lysosomal activity with Baf A1 does not ultimately demonstrate an involvement of autophagy, we performed experiments in RAW264.7 cells with wortmannin (Wortm). Wortm is a specific inhibitor of autophagy by blocking phosphatidylinositol 3-kinase (PtdIns3K), the kinase involved in the nucleation step of autophagosome formation.Citation19,30 We observed a significant increase in PELI3 protein expression in macrophages after pretreatment with Wortm 30 min and additional 6 h LPS stimulation compared with DMSO-LPS control treatment (C).
Similar to the endogenous PELI3 expression in A, immunofluorescence analysis of LPS-stimulated RAW264.7 cells treated with Baf A1 revealed an increase in overexpressed FLAG-tagged PELI3, which was found increasingly colocalized with MAP1LC3B (D). In line with the MAP1LC3B colocalization study, macrophage stimulation with Baf A1 and LPS showed an accumulation of MAP1LC3B-II protein (A, lower panel).
Moreover, we investigated the impact of Sqstm1 knockdown on PELI3 protein stability (E). Knockdown of Sqstm1 was present for all treatments. We observed a stabilization of PELI3 protein in Sqstm1-depleted cells in the absence of LPS and a marginal effect after LPS-treatment. To further investigate PELI3 stabilization by inhibition of autophagy, we established a knockdown of Atg7 (autophagy-related 7), an essential Atg gene, which is known to enhance IL1B secretion in LPS-induced MΦ.Citation31 In Atg7-silenced conditions, PELI3 protein levels were elevated in untreated cells and slightly increased following LPS stimulation (F). In summary, these data support our hypothesis of an autophagy-mediated PELI3 regulation.
Autophagy destabilizes PELI3 protein
Next, we monitored PELI3 upon autophagy induction by distinct treatments. First we used Torin2, a catalytic inhibitor of MTOR (mechanistic target of rapamycin [serine/threonine kinase]) that negatively regulates autophagy.Citation32,33 RAW264.7 cells were subjected to a 30 min pretreatment with Torin2 prior to 6 h LPS stimulation. As expected, following Torin2 treatment, PELI3 protein levels were significantly diminished (A). To monitor autophagy, we checked MAP1LC3B abundance by western blot and immunofluorescence experiments. To measure the autophagic flux in RAW264.7 cells, we performed our standard 6 h LPS treatments with Torin2 and DMSO controls and then additionally inhibited the formation of the autolysosome with Baf A1 2 h prior to harvest. We observed a significant accumulation of MAP1LC3B-II in Baf A1-treated autophagy-activated cells, whereas without lysosomal protease inhibitor MAP1LC3B-II partially degraded (Fig. S3A). Concomitantly, immunofluorescence studies revealed a distinctive increase in MAP1LC3B puncta upon Torin2 treatment compared with LPS stimulation alone, which could be strengthened by Baf A1 supplementation (Fig. S3B). Furthermore, rapamycin (Rapa), an allosteric MTOR inhibitor, is also prominent for autophagy induction.Citation34 In line with the Torin2-mediated autophagy induction, Rapa also demonstrated a significant downregulation of PELI3 (B). Autophagy can also be stimulated by a period of starvation with Hank's balanced salt solution (HBSS).Citation35 Thus, we subjected the cells for 1 and 3 h to HBSS or the corresponding standard medium for RAW264.7 cells. Consistently with the 2 other autophagy inducers, starvation showed a significant decline of PELI3 protein expression in RAW264.7 MΦ (C).
Figure 4 (See previous page). Autophagy destabilizes PELI3 protein. (A–D) RAW264.7 cells were incubated with LPS for 6 h or remained untreated as controls. In addition, cells were stimulated with distinct inducers of autophagy. (A) Lysates of cells treated with Torin2 were analyzed for the protein levels of PELI3 and SQSTM1. Densitometric quantification of PELI3 represents the mean ± SEM of at least 3 individual experiments (**P < 0.01 vs. DMSO + 6 h LPS). (B) Autophagy induction with Rapamycin (Rapa) was performed and cell lysates were analyzed for the protein expression of PELI3 and SQSTM1. Densitometric quantification of PELI3 represents the mean ± SEM of at least 3 individual experiments (*P < 0.05 vs. DMSO + 6 h LPS). (C) RAW264.7 cells were starved for 1 and 3 h with HBSS and protein expression of PELI3 and SQSTM1 was analyzed by western blot analysis. The graph shows the densitometric analysis of PELI3 and represents the mean ± SEM of at least 3 individual experiments (*P < 0.05 vs. corresponding (corr) HBSS control M). (D) The lysosomal marker LAMP2 and overexpressed FLAG-tagged PELI3 were stained for immunofluorescence as before. Representative images of at least 3 individual experiments are shown. Arrows indicate colocalization of FLAG-tagged PELI3 and LAMP2. Scale bars: 5 μm. LPS-dependent PELI3 stability was examined by western blot in RAW264.7 cells treated with cycloheximide (CHX) at 5 h after LPS stimulation alone (E) and combined with chemicals altering autophagy (F–H). (F) PELI3 protein level was checked for autophagy activation by Torin2 additional to CHX stimulation. (G) A further control experiment consisted of a neutralization mix of Torin2 and Wortm in addition to CHX treatment at 5 h after LPS treatment. (H) Supplemental stimulation of Torin2 combined with proteasomeal inhibition by Epoxo was added together with CHX. All parts (E–H) are illustrated in densitometric quantifications of PELI3 and represent the mean ± SEM of at least 3 individual experiments (**P < 0.01; ***P < 0.001 vs. LPS w/o CHX).
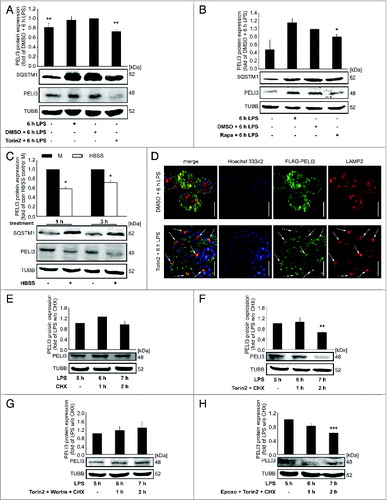
To check if Torin2-dependent PELI3 degradation is in fact due to autophagy, we analyzed colocalization of PELI3 and the lysosomal marker LAMP2 (lysosomal-associated membrane protein 2) by immunofluorescence. We observed a partial colocalization of both proteins after LPS treatment. However, upon autophagy induction by Torin2, PELI3 was strongly reduced and only appeared as small central dots, matching with the lysosomal membrane marker LAMP2 (D).
As PELI3 protein is reduced by autophagy activation and augmented upon autophagy inhibition we performed a cycloheximide (CHX)-chase assay to further examine PELI3 stability. Remarkably, PELI3 protein was stable with CHX after 5 h LPS treatment (E), whereas PELI3 is reduced upon MTOR inhibition by Torin2 (F). As expected, a combined neutralizing treatment of autophagy induction and inhibition with Torin2 and Wortm showed no alteration in PELI3 protein stability (G). In contrast, proteasomal inhibition by Epoxo did not prevent Torin2-dependent PELI3 downregulation (H). Based on these experiments, we conclude that autophagy induction leads to PELI3 destabilization.
Autophagy attenuates PELI3-dependent PRO-IL1B expression
As PELI3 abundance declined upon Torin2 as well as HBSS starvation, we examined whether Torin2 and HBSS treatment affects proinflammatory Il1b expression similarly to PELI3 deficiency. Interestingly, Il1b mRNA expression was significantly attenuated after Torin2 (A) and HBSS starvation strinkingly revealed reduced Il1b mRNA expression levels increasing with the time of starvation (B). To investigate the mechanism underlying the autophagy-induced degradation of PELI3 protein and Il1b mRNA expression, we established transient depletion of Peli3 in J774A.1 cells and activated autophagy by Torin2 treatment. We demonstrated a reduction of PRO-IL1B upon Torin2 plus 6 h LPS stimulation in control as well as Peli3-depleted cells, though degradation of PRO-IL1B upon autophagy induction was not altered by Peli3 deficiency (C). To elucidate whether autophagic regulation of PELI3 affects MAPKs and consequently proinflammatory cytokine expression, we analyzed protein abundance of phosphorylated MAPKs. Supporting evidence for that experimental setup came from attenuated Il1b and Tnf mRNA expression by pharmacological inhibition of these MAPKs 1 h prior to LPS stimulation (Fig. S4A and S4B). Upon autophagy activation PELI3 degradation demonstrated a significant decline in phosphorylated MAPK14 and a slight reduction for MAPK8/9 phosporylation, whereas phosphorylation status of MAPK1/3 remained unchanged (Fig. S4C–S4E). This phenomenon correlates with previous data about the phosphorylation of distinct MAPKs in Peli3-deficient cells.Citation14
Figure 5. Autophagy attenuates PELI3-dependent PRO-IL1B expression. (A) RNA of Torin2-treated cells was isolated and mRNA expression of Il1b was analyzed using qPCR. mRNA levels were normalized to Tbp mRNA levels. DMSO plus LPS-treated sample is set as 1. Data represent the mean ± SEM of at least 3 individual experiments (**P < 0.01 vs. DMSO + 6 h LPS). (B) RNA of HBSS-starved cells was isolated and mRNA expression of Il1b was analyzed using qPCR. The mRNA levels were normalized to Tbp mRNA levels. Corresponding HBSS control M is set as 1. Data represent the mean ± SEM of at least 3 individual experiments (*P < 0.05 vs. corresponding (corr) HBSS control M). (C) J774A.1 cells transiently transfected with siPeli3 or sictrl were incubated with DMSO plus 6 h LPS, Torin2 plus 6 h LPS or remained as control. Protein abundance of PELI3 and PRO-IL1B were examined by western analysis. The graph shows the densitometric analysis of PRO-IL1B and represents the mean ± SEM of at least 3 independent experiments. sictrl with DMSO plus LPS-treated sample is set as 1 (**P < 0.01; ***P < 0.001 vs. sictrl and DMSO + 6 h LPS).
Lys316 contributes to Torin2-dependent PELI3 degradation
Ubiquitination is used in selective autophagy as a targeting signal for autophagy substrates to bind specific autophagy receptors.Citation36 SQSTM1 targets ubiquitinated proteins to autophagosomes for degradation via its ubiquitin-associated (UBA) domain.Citation37 Thus, we examined whether PELI3 is subjected to ubiquitination upon LPS stimulation. Thereto, we performed pull-down assays under denaturating conditions to detect covalently bound UBB on PELI3. Immunoblot analysis of pull-down fractions revealed that UBB was indeed conjugated to PELI3 in response to LPS treatment, which identifies a LPS-specific ubiquitination (A). As Torin2 induces PELI3 degradation, we were sought to identify which lysine residue of PELI3 is responsible for its ubiquitin-dependent autophagosomal degradation. Thus, RAW264.7 MΦ as well as J774A.1 cells transduced with wild-type (WT) PELI3 as well as PELI3 variants carrying a single lysine to arginine replacement at positions 23, 43, 222, 279 and 316 were pretreated for 30 min with Torin2 prior to 6 h LPS stimulation. Cells expressing FLAG-tagged WT PELI3, pretreated with DMSO prior to LPS stimulation served as negative control. After Torin2 treatment, we found a significant stabilization of PELI3 variants in RAW264.7 cells with a substitution at position 43, 279, and 316 compared with WT PELI3. Notably, these 3 variants were expressed at similar levels as WT PELI3 in DMSO-treated conditions (B). Concerning the lysine studies in the J774A.1 cells, the result for FLAG-PELI3 protein expression was more obvious demonstrating a strong and significant stabilization of the lysine mutation 316 (D). To link PELI3 stabilization to IL1B expression, we analyzed PRO-IL1B expression in both macrophage cell lines. Comparing the 3 potential stabilizing single PELI3 mutants (K43R, K279R and K316R) with WT PELI3 in RAW264.7 cells following Torin2 treatment, only the K316R mutant rescued Torin2-dependent PRO-IL1B degradation (C). In line with the outcome of PRO-IL1B protein expression in RAW264.7 MФ, J774A.1 cells also showed a rescue effect of the IL1B pro-form only in the 316 lysine mutation construct after Torin2 treatment compared with WT PELI3 overexpression (D). We further validated the PRO-IL1B data at mRNA expression level in cells expressing WT PELI3 and lysine mutants, respectively. Intriguingly, replacement of lysine at position 316 in both cell lines rescued Il1b expression after Torin2 treatment similar to the DMSO control (E and F). In addition, we checked the interaction of the FLAG-PELI3K316R mutant with SQSTM1 upon 6 h LPS stimulation (Fig. S5) and showed no altered binding properties to SQSTM1 compared with the WT FLAG-PELI3 overexpression construct.
Figure 6 (See previous page). Lys316 contributes to Torin2-dependent PELI3 degradation. (A) Pull down assays in WT PELI3 overexpressing RAW264.7 cells were performed under denaturing conditions to detect ubiquitin conjugates on PELI3 after 6 h LPS or mock stimulation. Generation of RAW264.7 cells (B, C, and E) and J774A.1 cells (D and F) stably overexpressing either FLAG-tagged WT PELI3 or FLAG-tagged PELI3 mutant variants (K23R, K43R, K222R, K279R and K316R). These cells were stimulated with LPS for 6 h in combination with Torin2. To display the rescue effect of lysine replacement constructs, WT PELI3 was treated additionally with DMSO as control. (B) Western blot analysis of FLAG-tagged PELI3 in RAW264.7 cells was performed. The graph shows the densitometric analysis and represents the mean ± SEM of at least 3 individual experiments. Torin2 plus LPS-treated sample is set as 1 (*P < 0.05; **P < 0.01 vs. WT and Torin2 + 6 h LPS). (C) Western analysis of PRO-IL1β in RAW264.7 cells with a stable overexpression of FLAG-tagged WT PELI3 and the 3 shortlisted lysine-arginine replacement constructs (K43R, K279R and K316R). (D) Besides analysis of FLAG-PELI3 protein expression in J774A.1 cells, western analysis of PRO-IL1β was performed. Densitometric quantification of FLAG-PELI3 is provided and represents the mean ± SEM of at least 3 individual experiments (*P < 0.05 vs. WT and Torin2 + 6 h LPS). (E and F) RNA was isolated and Il1b mRNA expression was analyzed using qPCR. The mRNA levels were normalized to Tbp mRNA levels. DMSO plus LPS-treated sample is set as 1. Data represent the mean ± SEM of at least 3 individual experiments (*P < 0.05; **P < 0.01; ***P < 0.001 vs. WT and DMSO + 6 h LPS).
These results suggest that ubiquitination of PELI3 at Lys316 is required for its autophagy-dependent degradation.
Discussion
The first discovery of PELI3 in Drosophila 1999 was the starting point for further attendance and research of the protein in the field of innate immunity and TLR signaling.Citation38 The innate immune system is a highly conserved and structured process, which can be triggered by a variety of PRRs to defend the host against invaded pathogens. LPS as one possible pathogen-associated molecular pattern stimulates the TLR4 signaling cascade in which PELI3 impacts the outcome of the signaling.
Here, we describe the regulation of PELI3 in innate immunity. Peli3 silencing by lentiviral shRNA resulted in reduced levels of the proinflammatory cytokines Il1b (E, F, and H) and Tnf (Fig. S1) in murine MΦ, which are predestined biomarkers reflecting the hyperinflammatory phase of sepsis. Sepsis is a disease with an initial overwhelming proinflammatory response due to infection and a delayed onset of immune paralysis with suppression of immune cells.Citation8 Based on previous studies, which characterized PELI3 as a scaffold protein and interacting partner of TRAF6, MAP3K7, NFKB-inducing kinase MAP3K14/NIK (mitogen-activated protein kinase kinase kinase 14), and IRAK1, our aim was to identify potent binding partners essential for LPS-regulated processes.Citation10,12
The discovery of SQSTM1 as a novel PELI3-binding partner by MS as well as by western blot and immunofluorescence analysis (; Fig. S2) provides new insights into the field of autophagy. SQSTM1 has a multitude of properties as it is a multidomain protein adaptor and thus acts as a key player for autophagy and apoptosis and is also implicated in cancer.Citation39 Further investigations will be needed to characterize the domain in SQSTM1 that is responsible for PELI3 binding. A hallmark of SQSTM1 is its ability to bind ubiquitinated proteins and organelles for selective autophagy and subsequent degradation as well as acting as a signal hub in distinct pathways like NFKB and NFE2L2/Nrf2 (nuclear factor, erythroid 2-like 2) signaling.Citation40 Although SQSTM1 is an autophagy-specific substrate, it can also affect the ubiquitin proteasome system.Citation41,42 Thus, we employed inhibitors that block autophagosome formation, autophagosome-lysosome fusion and proteasomal degradation to probe by which pathway PELI3 is targeted (). Autophagy is tightly connected with intermediate metabolism and the PtdIns3K signaling pathway, all together controlling cell homeostasis.Citation43 Autophagy inhibition by the PtdIns3K signaling inhibitor Wortm strikingly revealed PELI3 accumulation (C). Nevertheless, suppression of the PtdIns3K signaling complex MTOR by Torin2 and subsequent autophagy induction is one factor in the complex network of cell homeostasis. It could also be that targeting PtdIns3K might alter cell metabolism, growth, and proliferation.Citation43 Further, Baf A1 treatment inhibits the lysosomal degradation of ubiquitinated PELI3, thus leading to its stabilization. In contrast, blocking the proteasome with MG-132 or Epoxo, a more specific inhibitor, did not significantly alter PELI3 protein levels. Recent studies show that knockout of Atg7, which is an essential Atg gene, and Sqstm1 leads to the formation of ubiquitinated protein aggregates.Citation44-46 We found that PELI3 accumulated in RAW264.7 MФ upon depletion of Sqstm1 (E) and Atg7 (F) implicating autophagy in the regulation of PELI3 stability.
Moreover, we found that increased autophagic activity induced by Torin2 and Rapa treatment as well as starvation significantly reduced PELI3 protein levels (A–C). CHX experiments pointed out that under LPS-control conditions PELI3 is stable, whereas it is destabilized following autophagy induction. This destabilization phenomenon cannot be rescued by proteasome inhibition. Although CHX has been described to block starvation-induced autophagy, it is also established that Torin-dependent autophagy induction is not altered by CHX treatment and thus suitable for monitoring PELI3 stability.Citation47,48 Furthermore, the PELI3 decline can also be triggered by Torin2 stimulation in an LPS-independent manner (Fig. S6). Consistent with autophagosomal engulfment of PELI3, we observed a strong colocalization of PELI3 with the lysosomal membrane marker LAMP2 after Torin2 treatment. Duran et al. have identified SQSTM1 colocalization with LAMP2 and thus our hypothesis of a PELI3-autophagy connection is confirmed from distinct points of view.Citation49
MTOR inhibitors show well-established immunosuppressive activity and thus we checked the impact of Torin2 as well as starvation-induced autophagy on proinflammatory Il1b mRNA expression to find a potential connection with the reduced cytokine levels in Peli3 knockdown cells. The mRNA expression of Il1b was significantly reduced which correlates well with the work of Harris et al. that autophagy induction controls IL1B secretion, targets PRO-IL1B for lysosomal degradation and regulates the activation of the NLRP3 inflammasome.Citation50 Moreover, inflammation-mediated autophagy induction goes along with lysosomal degradation of ubiquitinated NLRP3 to limit an excessive proinflammatory IL1B response.Citation51,52 Our observation that PELI3 downregulation in response to autophagy induction does not alter PRO-IL1B degradation but inhibits PRO-IL1B expression (C) further strengthens our concept of reduced proinflammatory cytokine expression upon autophagy induction. Thus, we suggest that in cells undergoing autophagy PELI3 is an essential factor in regulating PRO-IL1B expression.
The cytosolic precursor PRO-IL1B is impacted by the inflammasome and cleaved by enzyme apoptosis-associated speck-like protein containing a C-terminal caspase-recruitment domain (ASC) into an active form.Citation53 As RAW264.7 MΦ lack the proteolytic activity of endogenous ASC, the secreted and bioactive form of IL1B cannot be detected in the supernatants of these cells.Citation54 Thus, we used a second murine MΦ cell line, J774A.1 with proteolytic active ASC to measure IL1B secretion level. Though the setting in our work is based in general on 6 h LPS stimulation which is too short to allow intense IL1B secretion, we analyzed IL1B release in J774A.1 MΦ (Figs. S7 and S8). In correlation with the results from Saitoh et al. in atg7 knockout MΦ after long-term LPS stimulation, our data showed increased IL1B release in Atg7-deficient J774A.1 MΦ (Fig. S7).Citation31 But as expected, differences in IL1B secretion were not significant. Therefore, we believe that following shorter stimulation times, e.g., 6 h LPS treatment, analysis of the IL1B pro-form is more meaningful.
Ubiquitinated protein aggregates can be degraded by lysosomes as autophagic cargo.Citation55 Thus, we performed an analysis for prediction of ubiquitination sites of PELI3 with www.ubpred.org. This program suggested that 5 out of 10 lysine residues in PELI3 are potential ubiquitination sites. It is currently state-of-the-art to substitute the lysine residue against the amino acid arginine to investigate its impact on autophagy and ubiquitination. In line, the work from Xia et al. shows that a single lysine 437 mutation of BECN1 is efficient to abrogate its ubiquitination and autophagy activity.Citation56 Subsequently, we investigated the influence of single lysine mutations on PELI3 stability under Torin2 stimulation. Our work in RAW264.7 cells revealed that 3 replacement constructs show PELI3 expressions comparable to basal levels without Torin2 treatment thus characterizing lysine sites, which impede the autophagic lysosomal degradation. However, only the lysine-to-arginine substitution at site 316 in stable PELI3 overexpressing RAW264.7 and J774A.1 cells was able to rescue extenuated Il1b mRNA, PRO-IL1B protein expression as well as IL1B secretion in J774A.1 cells (Fig. S8) and hence displayed functionality.
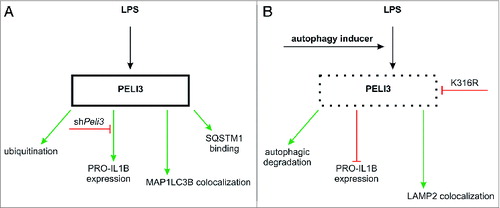
In the context of LPS-induced TLR4 signaling, we characterized PELI3 as a protein, which is altered and controlled by autophagy (). We provide evidence that autophagy induction affects PELI3 stability by lysosomal degradation of ubiquitinated PELI3. This implicates changes in IL1B expression and consequently alters TLR4 signaling as in detail a significant decline in phosphorylated MAPK14 in corroboration with established data.Citation14 Since an overwhelming proinflammatory response in early stages of sepsis causes serious problems, targeting PELI3 by considering the knowledge of autophagy induction should be approached and extended in future as therapy regime.
Figure 7. Proposed schema summarizing PELI3 regulation. (A) LPS treatment induces PELI3 protein expression as well as its subsequent ubiquitination, promotes binding to SQSTM1, and MAP1LC3B colocalization. Silencing Peli3 attenuates PRO-IL1B expression. (B) Autophagy activation degrades PELI3 protein as well as inhibits PRO-IL1B expression.
Materials and Methods
Antibodies and reagents
Primary antibodies were used against PELI3/Pellino3 (Santa Cruz Biotechnology, K-14, sc-31622), MAP1LC3B/LC3B (MBL, PM036), MULTI UBB/Multiubiquitin (MBL, D058-3), SQSTM1/p62 (MBL, PM045), FLAG-tag (Sigma-Aldrich, F1804), TUBB/Tubulin, β class I (Sigma-Aldrich, T4026), ACTB/actin, beta (Sigma-Aldrich, A2066), LAMP2 (abcam, ab37024), 6× HIS-tag (abcam, ab14923), ATG7 (Cell Signaling Technology, 2631), p-MAPK14/p-p38α (Cell Signaling Technology, 4511), MAPK14/p38α (Cell Signaling Technology, 9212), p-MAPK1/ERK2-p-MAPK3/ERK1 (Cell Signaling Technology, 9106), MAPK1/ERK2-MAPK3/ERK1 (Cell Signaling Technology, 4696), p-MAPK8/JNK1-p-MAPK9/JNK2 (Cell Signaling Technology, 9255), MAPK8/JNK1 (Santa Cruz Biotechnology, FL, sc-571) and HA.11 (Covance, MMS-101P). PRO-IL1B antibody was a kind gift from the NCI (Bethesda, MD, USA). For western blot detection with Odyssey Infrared Imaging System, IRDye 680LT Donkey anti-mouse/anti-rabbit (926-68022/-68023) and IRDye 800CW Donkey anti-mouse/anti-rabbit (926-32212/-32213) were used from Li-Cor. For detection with enhanced chemiluminescence (ECL), Amersham ECL HRP-linked secondary antibodies (NA934V, NA931V) were obtained from GE Healthcare Life Science. For immunofluorescence experiments, Hoechst 33342 (H21492), Alexa Fluor® 488 goat anti-mouse IgG (H+L) *highly cross-adsorbed* *2 mg/ml* (A11029) and Alexa Fluor® 546 goat anti-rabbit IgG (H+L) *highly cross-adsorbed* *2 mg/ml* (A11035) were ordered from Invitrogen. For distinct treatment conditions, 1 μg/ml LPS (Sigma-Aldrich, L4516), 50 nM bafilomycin A1 (Sigma-Aldrich, B1793), 10 μM MG-132 (Sigma-Aldrich, C2211), 100 nM rapamycin (Cell Signaling Technology, 9904), 100 nM wortmannin (Sigma-Aldrich, W1628), 1 μM epoxomicin (Sigma-Aldrich, E3652), 50 μg/ml cycloheximide (Sigma-Aldrich, C7698), HBSS (Sigma-Aldrich, H8264), 10 μM SB203580 (Sigma-Aldrich, S8307), 10 μM SP600125 (Sigma-Aldrich, S5567), 50 μM PD98059 (Sigma-Aldrich, P215) and 100 nM Torin2 (Sellekchem, S2817) were used. For immunoprecipitation (IP) experiments, Dynabeads® Protein G (Invitrogen, 10004D) and Ni-NTA-agarose (Qiagen, 30210), respectively, were used.
Cell culture
RAW264.7 MΦ were maintained with DMEM high glucose (4.5 g/L) medium, J774A.1 MΦ were maintained with RPMI 1640 medium and both were supplemented with 100 U/ml penicillin, 100 μg/ml streptomycin and 10% heat-inactivated fetal calf serum (FCS). All cell culture reagents were from PAA Laboratories. Cells were cultured at 37°C in a humidified atmosphere with 5% CO2. For positive selection of stable, lentiviral transduced RAW264.7 or J774A.1 cells, medium was additionally supplemented with 2 μg/ml puromycin dihydrochloride (AppliChem, A2856). Cells were spread 3 times a week and medium was changed prior to experiments.
Generation of murine bone marrow-derived macrophages (BMDMΦ)
Bone marrow from femur and tibia was collected by flushing bone shaft with 2 to 3 ml Dulbecco's phosphate-buffered saline (PBS, Sigma-Aldrich, D5652) supplemented with 1% penicillin/streptomycin using a syringe and a 26 G needle into a 50 ml falcon. Cells were pooled, passed through a 100-μm pre-rinsed nylon cell-strainer and centrifuged at 300 g for 10 min at RT. Cell pellet was resuspended in a proper volume of RPMI 1640 medium and cells were counted for seeding on 6-well plates. Up to 1 × 10⁸ cells per mouse were expected by bone marrow extraction. Seeded bone marrow was differentiated with 20 ng/ml of M-CSF (Peprotech, 315-02) to macrophages for 7 d prior to experiments.
Lentiviral transduction
To knock down Peli3, we ordered Mission™ short hairpin (shRNA) against Peli3 from Sigma-Aldrich (Clone ID TRCN0000198813). For stable lentiviral overexpression of a FLAG-tagged PELI3 plasmid (kindly provided by Liselotte Jensen, Temple University Philadelphia, USA), we generated the lentiviral vector construct by using Clone-it™ enzyme free lentivectors (SBI, LF521A-1) according to the manufacturer's protocol. Site-directed mutagenesis for generation of point mutation within the WT PELI3 overexpression construct, the following lysines residues 23, 43, 222, 279, and 316 were replaced against arginine (KxR) by using the QuikChange® II XL site-directed mutagenesis kit according to the manufacturer's protocol. For generation of lentiviral particles, 3 × 10⁶ HEK293T cells were seeded in 10 ml complete DMEM high medium. The next day HEK293T were transfected with 2 μg shRNA plasmid or lentiviral cDNA, 26 μl Mission™ lentiviral packaging plasmid mix (Sigma-Aldrich, SHP001) and 8 μl JetPRIME transfection reagent (Peqlab, 13-114) according to distributor instructions. Medium was replaced 15 h after transfection and 72 h afterwards, the supernatant fraction containing infectious lentiviral particles was harvested. The supernatant fraction was centrifuged (5 min, 2800 g, RT) and filtered through a 0.45-μm sterile filter. To concentrate infectious lentiviral particles 100-fold, the clarified supernatant fraction was combined with the Lenti-X™ Concentrator (Clontech, 631232) in a ratio of 1 to 3, mixed by gentle inversion and incubated for 2 h at 4°C. Thereafter, the mix was centrifuged (45 min, 1,500 g, 4°C) and the off-white pellet was resuspended in an appropriate volume of cell culture medium. For transduction of RAW264.7 cells and J774A.1 cells, 50 μl of 100-fold lentivirus was dropped onto seeded cells and 24 h later medium was changed for the first time including 2 μg/ml puromycin dihydrochloride for positive selection. For 2 wk, twice a day, the medium was replaced before starting the experiments. For transduction of BMDMΦ, 25 μl of 100-fold lentivirus was dropped onto bone marrow cells at d 3 and 4 after isolation and starting differentiation with M-CSF.
Transient transfection
siRNAs against Sqstm1 (Qiagen, siSqstm1-1: Mm_Sqstm1_4 and siSqstm1-2: Mm_Sqstm1_5) or Atg7 (Qiagen, siAtg7-1: Mm_Apg7I_1, siAtg7-2: Mm_Apg7I_2) were transiently transfected into 1 × 10⁶ RAW264.7 cells using HiPerFect Transfection Reagent (Qiagen, 301707) according to the manufacturer's protocol. siRNA against Peli3 (Qiagen, siPeli3: Mm_6030441F14Rik_1) was transiently transfected into 1 × 10⁶ J774A.1 cells using HiPerFect according to the manufacturer's protocol. 32 h after transfection, RAW264.7 or J774A.1 cells were stimulated with LPS as indicated. Sqstm1, Peli3, and Atg7 knockdown efficiencies were compared with siControl (sictrl) (AllStars Neg. Control siRNA, Qiagen, SI03650318) transfected cells and confirmed by western analysis or in addition for siPeli3 by quantitative PCR.
Quantitative PCR
Total RNA from 5 × 10⁵ RAW264.7 or J774A.1 cells was isolated by using peqGOLD RNAPure Kit (Peqlab, 30-1020) as instructed by the manufacturer's protocol. Total RNA from BMDMΦ was isolated by using RNeasy Mini Kit (Qiagen, 74104) following the manufacturer's protocol. Two μg RNA were reverse transcribed into cDNA (cDNA) with the iScript™ cDNA Synthesis kit (Bio-Rad, 170-8890). Quantitative PCR (qPCR) was performed with the iQ™ SYBR® Green Supermix (Bio-Rad, 170-8880) according to the distributor's instructions. qPCR measurement and data analysis were performed with the CFX real-time PCR system from Bio-Rad. The following primer pairs (Biomers) against murine targets were selected: Tbp (NM_013684.3) forward: 5′-CTGACCACTG CACCGTTGCC A-3′, Tbp reverse: 5′-GACTGCAGCA AATCGCTTGG GA-3′; Peli3 (NM_172835.3) forward: 5′-ATGTTCCAGA TTGGCCGCTC TACT-3′, Peli3 reverse: 5′-GCATCAAAGC CAGCAGCGTA GATT-3′; Il1b (NM_008361.3) forward: 5′-GACCTTCCAG GATGAGGACA-3′, Il1b reverse: 5′-AGGCCACAGG TATTTTGTCG-3′. Tnf (NM_001278601.1) forward: 5′-CCATTCCTGA GTTCTGCAAA GG-3′, Tnf reverse: 5′-AGGTAGGAAG GCCTGAGATC TTATC-3′. Values were normalized to Tbp mRNA.
Western blot analysis
1 × 10⁶ RAW264.7 or J774A.1 cells were grown in 6-cm plates, treated with LPS and the appropriate reagents for distinct times and subsequently harvested in 200 μl Nonidet P40 (NP-40) lysis buffer (50 mM Tris, pH 7.4, 250 mM NaCl, 5 mM EDTA, 50 mM NaF, 1 mM Na3VO4, 1% NP40 [Sigma-Aldrich, 74385-1L], 0.02% NaN3; supplemented prior to use with 1 mM PMSF, 1 mM DTT, 2 mM 1,10-phenanthroline [Sigma-Aldrich, P9375] and 1× PIM). The lysis was continued by shaking (1 h, 1,000 rpm, 4°C), centrifugation (10 min, 20,000 g, 4°C) and protein content determination by Lowry. 50 μg protein was added to 4× SDS-PAGE sample buffer (0.5 M TRIS-HCl, pH 6.8, 10% SDS [Sigma-Aldrich, 74255], 40% glycerol, 0.002% bromophenol blue, 10% β-mercaptoethanol), boiled for 10 min, loaded onto SDS-polyacrylamide gels and separated by gel electrophoresis (SDS-PAGE). Afterwards, the SDS-gel was blotted onto Hybond nitrocellulose membrane (GE Healthcare Life Science, RPN303D) following standard procedures. Nonspecific binding sites were blocked with Rockland Blocking Buffer (Rockland, MB-070) for 1 h. The primary antibodies (listed above) were added to the membrane for overnight incubation. After washing with TTBS, TBS and PBS for 10 min in each case, the membrane was incubated with the secondary antibody (listed above) for 45 min and after a further washing procedure, the detection of proteins was performed with the Odyssey Infrared Imaging System (LI-COR Biotechnology, Bad Homburg, Germany) and the ECL detection method, respectively.
Immunoprecipitation (IP)
For analysis of PELI3 binding proteins, 3 × 10⁶ RAW264.7 cells stable expressing FLAG-HIS-tagged WT PELI3 or the K316R mutant were seeded on 10-cm plates and stimulated with LPS for distinct times and harvested (see above western analysis). 2.5 μg mouse anti-FLAG antibody or anti-SQSTM1 antibody (2 μl/300 μl lysate) were incubated with 1.5 mg Dynabeads® Protein G for 30 min. One milligram protein was added to the Dynabeads®-antibody-complex and incubated overnight at 4°C. Prior to the elution step from the Dynabeads®, the complex was washed 4 times with PBS. The IP samples were eluted from the beads by heating with SDS sample buffer.
Analysis by mass spectrometry (MS)
Coimmunoprecipitated proteins were separated by SDS-PAGE and gels were incubated in fixing solution (50% methanol, 10% acetic acid, 10 mM ammonium acetate), stained with Coomassie (0.025% Coomassie brilliant blue G250 in 10% acetic acid), destained in 10% acetic acid and intensively washed with water. Each lane was divided into 8 pieces, mashed and transfered into a filter microtiter plate followed by several washing steps (50% methanol, 50 mM ammonium hydrogen carbonate). Samples were reduced with 5 mM DTT in 50 mM ammonium hydrogen carbonate (AHC), incubated with 30 mM iodoacetamide and finally digested with 5 ng/μl trypsin in AHC overnight at 37°C. Resulting tryptic peptides were subjected to LC-MS/MS analysis on an Orbitrap XL mass spectrometer (Thermo Fisher Scientific, Dreieich, Germany) coupled to a nano-HPLC system (Agilent Technologies, Böblingen, Germany). Peptides were separated on a 10.5 cm × 75 μm-ID column filled with 3 μm C18 reversed phase silica in 60 min runs using 30 min gradients of 5% to 50% acetonitrile in water with 0.1% formic acid, followed by column wash and re-equilibration steps for 15 min each and eluting peptides subjected to MS/MS analysis. MS data was collected by a Data DependentTM acquisition method consisting of a full MS scan with a mass resolution of 30,000 at 400 m/z with following collision-induced dissociation of 10 most abundant precursor ions with charge states of 2 and greater in the linear ion trap at 35% normalized collision energy. Evaluation of MS/MS spectra was performed in the Proteome Discoverer 1.3 environment (Thermo Fisher Scientific, Dreieich, Germany) with Mascot server 2.2 as database search engine. Database search parameters were: 10 ppm deviation on the precursor and 0.8 Da on fragment masses, fixed carbamidomethylation of cysteine, variable oxidation of methionine and trypsin as protease (full tryptic with one missed cleavage). Spectra were matched against a reviewed species-specific (Mus musculus) protein database containing 16,625 sequences downloaded from www.uniprot.org (August 2013). Individual peptide matches were filtered by a decoy database search with a target false discovery rate set to 0.05 (Table S1).
HIS-Ni-NTA immunoprecipitation
To detect ubiquitination of PELI3, 3 × 10⁶ RAW264.7 cells stable expressing FLAG-HIS-tagged PELI3 were seeded on 10-cm plates, stimulated and underwent denaturating lysis conditions by performing HIS-nickel-affinity-IP. The resin was washed 3 times in buffer A (6 M guanidine-HCl, 0.1 M Na2HPO4/NaH2PO4, 10 mM imidazole, pH 8.0) and resuspended in buffer A. The cells were washed and finally harvested in PBS. The cell pellet was resuspended in PBS again and vortexed. Twenty microliters of the total lysate was combined with 50 μl 2× Laemmli buffer (1 M TRIS-HCl, pH 6.8, 10% SDS, 20% glycerol, 6.7% DTT and 0.0067% bromophenol blue) and boiled for 10 min. The remaining cells were resuspended in buffer A following sonification. Finally, 50 μl of equilibrated Ni-NTA-agarose resin was added to the sample and rotated for 3 h at room temperature. The resin was collected and washed twice in buffer A, 2 times in buffer A/TI (1 volume buffer A and 3 volume buffer TI: 25 mM TRIS-HCl, 20 mM imidazole, pH 6.8) and once in buffer TI. For the final step, all the liquid was removed by plunging a 26 G needle directly into the resin, which then was resuspended in 100 μl of 2× Laemmli buffer containing 250 mM imidazole and boiled for 10 min. 35 μl of TL (pre-Ni-NTA-agarose sample) and 40 μl of IP lysate (post-Ni-NTA-agarose sample) were separated by SDS-PAGE and examined by western analysis.
Immunofluorescence staining
To analyze colocalization of FLAG-tagged PELI3 with autophagy markers (MAP1LC3B, SQSTM1, LAMP2), 5 × 10⁵ RAW264.7 cells were seeded on a sterile coverslip (Menzel) in a 6-well plate. Cultivation and treatment conditions ended up in harvest by washing with PBS and cell fixation with 4% paraformaldehyde for 10 min. Coverslips were washed twice with PBS before cell permeabilization with 0.25% Triton X-100 (Sigma-Aldrich, X100) in PBS. Subsequently cells were washed again with PBS and blocked with 10% BSA in PBS (30 min, 37°C). Primary antibody incubation (MAP1LC3B, SQSTM1, LAMP2, FLAG) in 3% BSA in PBS was performed overnight at 4°C, followed by 2 PBS washing steps at d 2 and secondary antibody incubation (listed above) in 3% BSA in PBS for 45 min at 37°C. Coverslips were washed twice and mounted on microscope slides using VECTASHIELD® Mounting Medium (H-1000) from Vector Laboratories. For image acquisition, the AxioVert 200 M fluorescence microscope (Carl Zeiss, Göttingen, Germany) equipped with the ApoTome (Carl Zeiss, Göttingen, Germany) and a Plan-Apochromat objective (63×/1.40 oil lens, Carl Zeiss, Göttingen, Germany) as well as a charge-coupled device (CCD) camera (Carl Zeiss, Göttingen, Germany) and the AxioVision software were used (Carl Zeiss, Göttingen, Germany).
Cytometric bead array (CBA)
IL1B was measured in the supernatant fractions of J774A.1 cells treated for 6 h with LPS and additionally with 200 μg/ml aluminum hydroxide for activation of the NLRP3 (NLR family, pyrin domain containing 3) inflammasome.Citation57,58 The assay was performed by FACS analysis using the CBA Flex Set for murine IL1B (BD Biosiences, 560232). In brief, 25 μl supernatant fraction and standards were incubated with 25 μl IL1B-coated beads and then labeled with a PE detection reagent. Each incubation procedure was performed for 1 h. Samples were washed with 1 ml FACS flow, centrifuged (200 g, 5 min) and resuspended in 300 μl FACS flow for measurement. Samples were acquired with the LSR Fortessa flow cytometer (BD Biosciences, Heidelberg, Germany) and analyzed with BD Biosciences FCAP software.
Statistical analysis
Each experiment was performed at least 3 times. Statistical analysis was performed using the paired Student t test. We considered P values < 0.05 as significant. Otherwise representative data are shown.
Disclosure of Potential Conflicts of Interest
No potential conflicts of interest needed to be disclosed.
Supplemental Material
Supplemental data for this article can be accessed on the publisher's website.
Supplemental Material.pdf
Download PDF (651.2 KB)Acknowledgments
We thank Nadja Wallner for generation of the lentiviral WT PELI3 overexpression construct and Mirco Steger for sample preparation of mass spectrometry experiments.
Funding
This research was supported by grants from the Deutsche Forschungsgemeinschaft (KN493/9-2, SFB 815 TP3 and Z1 as well as BE 4685/1-1) and the European Research Council (282333).
References
- Medzhitov R, Janeway C Jr. Innate immunity. N Engl J Med 2000; 343:338-44; PMID:10922424; http://dx.doi.org/10.1056/NEJM200008033430506
- Mogensen TH. Pathogen recognition and inflammatory signaling in innate immune defenses. Clin Microbiol Rev 2009; 22:240-73; PMID:19366914; http://dx.doi.org/10.1128/CMR.00046-08
- Akira S, Takeda K. Toll-like receptor signalling. Nat Rev Immunol 2004; 4:499-511; PMID:15229469; http://dx.doi.org/10.1038/nri1391
- Pandey S, Agrawal DK. Immunobiology of Toll-like receptors: emerging trends. Immunol Cell Biol 2006; 84:333-41; PMID:16834572; http://dx.doi.org/10.1111/j.1440-1711.2006.01444.x
- O’Neill LA, Bowie AG. The family of five: TIR-domain-containing adaptors in Toll-like receptor signalling. Nat Rev Immunol 2007; 7:353-64; PMID:17457343; http://dx.doi.org/10.1038/nri2079
- Kawai T, Akira S. The role of pattern-recognition receptors in innate immunity: update on Toll-like receptors. Nat Immunol 2010; 11:373-84; PMID:20404851; http://dx.doi.org/10.1038/ni.1863
- Ward PA. New approaches to the study of sepsis. EMBO Mol Med 2012; 4:1234-43; PMID:23208733; http://dx.doi.org/10.1002/emmm.201201375
- van der Poll T, van Zoelen MA, Wiersinga WJ. Regulation of pro-and anti-inflammatory host responses. Contrib Microbiol 2011; 17:125-36; PMID:21659750; http://dx.doi.org/10.1159/000324026
- Rittirsch D, Flierl MA, Ward PA. Harmful molecular mechanisms in sepsis. Nat Rev Immunol 2008; 8:776-87; PMID:18802444; http://dx.doi.org/10.1038/nri2402
- Shaw AS, Filbert EL. Scaffold proteins and immune-cell signalling. Nat Rev Immunol 2009; 9:47-56; PMID:19104498; http://dx.doi.org/10.1038/nri2473
- Moynagh PN. The Pellino family: IRAK E3 ligases with emerging roles in innate immune signalling. Trends Immunol 2009; 30:33-42; PMID:19022706; http://dx.doi.org/10.1016/j.it.2008.10.001
- Jensen LE, Whitehead AS. Pellino3, a novel member of the Pellino protein family, promotes activation of c-Jun and Elk-1 and may act as a scaffolding protein. J Immunol 2003; 171:1500-6; PMID:12874243; http://dx.doi.org/10.4049/jimmunol.171.3.1500
- Butler MP, Hanly JA, Moynagh PN. Pellino3 is a novel upstream regulator of p38 MAPK and activates CREB in a p38-dependent manner. J Biol Chem 2005; 280:27759-68; PMID:15917247; http://dx.doi.org/10.1074/jbc.M500756200
- Yang S, Wang B, Tang LS, Siednienko J, Callanan JJ, Moynagh PN. Pellino3 targets RIP1 and regulates the pro-apoptotic effects of TNF-α. Nat Commun 2013; 4:2583; PMID:24113711; http://dx.doi.org/10.1038/ncomms3583
- Mellett M, Atzei P, Jackson R, O’Neill LA, Moynagh PN. Mal mediates TLR-induced activation of CREB and expression of IL-10. J Immunol 2011; 186:4925-35; PMID:21398611; http://dx.doi.org/10.4049/jimmunol.1002739
- Schauvliege R, Janssens S, Beyaert R. Pellino proteins are more than scaffold proteins in TLR/IL-1R signalling: a role as novel RING E3-ubiquitin-ligases. FEBS Lett 2006; 580:4697-702; PMID:16884718; http://dx.doi.org/10.1016/j.febslet.2006.07.046
- Shi CS, Kehrl JH. MyD88 and Trif target Beclin 1 to trigger autophagy in macrophages. J Biol Chem 2008; 283:33175-82; PMID:18772134; http://dx.doi.org/10.1074/jbc.M804478200
- Deretic V, Saitoh T, Akira S. Autophagy in infection, inflammation and immunity. Nat Rev Immunol 2013; 13:722-37; PMID:24064518; http://dx.doi.org/10.1038/nri3532
- Levine B, Mizushima N, Virgin HW. Autophagy in immunity and inflammation. Nature 2011; 469:323-35; PMID:21248839; http://dx.doi.org/10.1038/nature09782
- Ryter SW, Nakahira K, Haspel JA, Choi AM. Autophagy in pulmonary diseases. Annu Rev Physiol 2012; 74:377-401; PMID:22035347; http://dx.doi.org/10.1146/annurev-physiol-020911-153348
- Kumar S, Boehm J, Lee JC. p38 MAP kinases: key signalling molecules as therapeutic targets for inflammatory diseases. Nat Rev Drug Discov 2003; 2:717-26; PMID:12951578; http://dx.doi.org/10.1038/nrd1177
- Harris J. Autophagy and IL-1 Family Cytokines. Front Immunol 2013; 4:83; PMID:23577011; http://dx.doi.org/10.3389/fimmu.2013.00083
- Huang YH, Tsai PS, Huang CJ. Bupivacaine inhibits COX-2 expression, PGE2, and cytokine production in endotoxin-activated macrophages. Acta Anaesthesiol Scand 2008; 52:530-5; PMID:18339158; http://dx.doi.org/10.1111/j.1399-6576.2008.01590.x
- Myeku N, Figueiredo-Pereira ME. Dynamics of the degradation of ubiquitinated proteins by proteasomes and autophagy: association with sequestosome 1/p62. J Biol Chem 2011; 286:22426-40; PMID:21536669; http://dx.doi.org/10.1074/jbc.M110.149252
- Shacka JJ, Klocke BJ, Roth KA. Autophagy, bafilomycin and cell death: the “a-B-cs” of plecomacrolide-induced neuroprotection. Autophagy 2006; 2:228-30; PMID:16874105; http://dx.doi.org/10.4161/auto.2703
- Lee DH, Goldberg AL. Proteasome inhibitors: valuable new tools for cell biologists. Trends Cell Biol 1998; 8:397-403; PMID:9789328; http://dx.doi.org/10.1016/S0962-8924(98)01346-4
- Allam US, Krishna MG, Sen M, Thomas R, Lahiri A, Gnanadhas DP, Chakravortty D. Acidic pH induced STM1485 gene is essential for intracellular replication of Salmonella. Virulence 2012; 3:122-35; PMID:22460643; http://dx.doi.org/10.4161/viru.19029
- Nishiya T, Matsumoto K, Maekawa S, Kajita E, Horinouchi T, Fujimuro M, Ogasawara K, Uehara T, Miwa S. Regulation of inducible nitric-oxide synthase by the SPRY domain- and SOCS box-containing proteins. J Biol Chem 2011; 286:9009-19; PMID:21199876; http://dx.doi.org/10.1074/jbc.M110.190678
- Meng L, Mohan R, Kwok BH, Elofsson M, Sin N, Crews CM. Epoxomicin, a potent and selective proteasome inhibitor, exhibits in vivo antiinflammatory activity. Proc Natl Acad Sci U S A 1999; 96:10403-8; PMID:10468620; http://dx.doi.org/10.1073/pnas.96.18.10403
- Blommaart EF, Krause U, Schellens JP, Vreeling-Sindelárová H, Meijer AJ. The phosphatidylinositol 3-kinase inhibitors wortmannin and LY294002 inhibit autophagy in isolated rat hepatocytes. Eur J Biochem 1997; 243:240-6; PMID:9030745; http://dx.doi.org/10.1111/j.1432-1033.1997.0240a.x
- Saitoh T, Fujita N, Jang MH, Uematsu S, Yang BG, Satoh T, Omori H, Noda T, Yamamoto N, Komatsu M, et al. Loss of the autophagy protein Atg16L1 enhances endotoxin-induced IL-1beta production. Nature 2008; 456:264-8; PMID:18849965; http://dx.doi.org/10.1038/nature07383
- Liu Q, Xu C, Kirubakaran S, Zhang X, Hur W, Liu Y, Kwiatkowski NP, Wang J, Westover KD, Gao P, et al. Characterization of Torin2, an ATP-competitive inhibitor of mTOR, ATM, and ATR. Cancer Res 2013; 73:2574-86; PMID:23436801; http://dx.doi.org/10.1158/0008-5472.CAN-12-1702
- Jung CH, Ro SH, Cao J, Otto NM, Kim DH. mTOR regulation of autophagy. FEBS Lett 2010; 584:1287-95; PMID:20083114; http://dx.doi.org/10.1016/j.febslet.2010.01.017
- Benjamin D, Colombi M, Moroni C, Hall MN. Rapamycin passes the torch: a new generation of mTOR inhibitors. Nat Rev Drug Discov 2011; 10:868-80; PMID:22037041; http://dx.doi.org/10.1038/nrd3531
- Tang D, Kang R, Livesey KM, Cheh CW, Farkas A, Loughran P, Hoppe G, Bianchi ME, Tracey KJ, Zeh HJ 3rd, et al. Endogenous HMGB1 regulates autophagy. J Cell Biol 2010; 190:881-92; PMID:20819940; http://dx.doi.org/10.1083/jcb.200911078
- Shaid S, Brandts CH, Serve H, Dikic I. Ubiquitination and selective autophagy. Cell Death Differ 2013; 20:21-30; PMID:22722335; http://dx.doi.org/10.1038/cdd.2012.72
- Behrends C, Fulda S. Receptor proteins in selective autophagy. Int J Cell Biol 2012; 2012:673290; PMID:22536250; http://dx.doi.org/10.1155/2012/673290
- Grosshans J, Schnorrer F, Nüsslein-Volhard C. Oligomerisation of Tube and Pelle leads to nuclear localisation of dorsal. Mech Dev 1999; 81:127-38; PMID:10330490; http://dx.doi.org/10.1016/S0925-4773(98)00236-6
- Moscat J, Diaz-Meco MT. p62 at the crossroads of autophagy, apoptosis, and cancer. Cell 2009; 137:1001-4; PMID:19524504; http://dx.doi.org/10.1016/j.cell.2009.05.023
- Komatsu M, Kageyama S, Ichimura Y. p62/SQSTM1/A170: physiology and pathology. Pharmacol Res 2012; 66:457-62; PMID:22841931; http://dx.doi.org/10.1016/j.phrs.2012.07.004
- Komatsu M, Ichimura Y. Physiological significance of selective degradation of p62 by autophagy. FEBS Lett 2010; 584:1374-8; PMID:20153326; http://dx.doi.org/10.1016/j.febslet.2010.02.017
- Korolchuk VI, Menzies FM, Rubinsztein DC. Mechanisms of cross-talk between the ubiquitin-proteasome and autophagy-lysosome systems. FEBS Lett 2010; 584:1393-8; PMID:20040365; http://dx.doi.org/10.1016/j.febslet.2009.12.047
- Shanware NP, Bray K, Abraham RT. The PI3K, metabolic, and autophagy networks: interactive partners in cellular health and disease. Annu Rev Pharmacol Toxicol 2013; 53:89-106; PMID:23294306; http://dx.doi.org/10.1146/annurev-pharmtox-010611-134717
- Komatsu M, Waguri S, Ueno T, Iwata J, Murata S, Tanida I, Ezaki J, Mizushima N, Ohsumi Y, Uchiyama Y, et al. Impairment of starvation-induced and constitutive autophagy in Atg7-deficient mice. J Cell Biol 2005; 169:425-34; PMID:15866887; http://dx.doi.org/10.1083/jcb.200412022
- Wooten MW, Geetha T, Babu JR, Seibenhener ML, Peng J, Cox N, Diaz-Meco MT, Moscat J. Essential role of sequestosome 1/p62 in regulating accumulation of Lys63-ubiquitinated proteins. J Biol Chem 2008; 283:6783-9; PMID:18174161; http://dx.doi.org/10.1074/jbc.M709496200
- Johansen T, Lamark T. Selective autophagy mediated by autophagic adapter proteins. Autophagy 2011; 7:279-96; PMID:21189453; http://dx.doi.org/10.4161/auto.7.3.14487
- Watanabe-Asano T, Kuma A, Mizushima N. Cycloheximide inhibits starvation-induced autophagy through mTORC1 activation. Biochem Biophys Res Commun 2014; 445:334-9; PMID:24525133; http://dx.doi.org/10.1016/j.bbrc.2014.01.180
- Sahani MH, Itakura E, Mizushima N. Expression of the autophagy substrate SQSTM1/p62 is restored during prolonged starvation depending on transcriptional upregulation and autophagy-derived amino acids. Autophagy 2014; 10:431-41; PMID:24394643; http://dx.doi.org/10.4161/auto.27344
- Duran A, Amanchy R, Linares JF, Joshi J, Abu-Baker S, Porollo A, Hansen M, Moscat J, Diaz-Meco MT. p62 is a key regulator of nutrient sensing in the mTORC1 pathway. Mol Cell 2011; 44:134-46; PMID:21981924; http://dx.doi.org/10.1016/j.molcel.2011.06.038
- Harris J, Hartman M, Roche C, Zeng SG, O’Shea A, Sharp FA, Lambe EM, Creagh EM, Golenbock DT, Tschopp J, et al. Autophagy controls IL-1beta secretion by targeting pro-IL-1beta for degradation. J Biol Chem 2011; 286:9587-97; PMID:21228274; http://dx.doi.org/10.1074/jbc.M110.202911
- Shi CS, Shenderov K, Huang NN, Kabat J, Abu-Asab M, Fitzgerald KA, Sher A, Kehrl JH. Activation of autophagy by inflammatory signals limits IL-1β production by targeting ubiquitinated inflammasomes for destruction. Nat Immunol 2012; 13:255-63; PMID:22286270; http://dx.doi.org/10.1038/ni.2215
- Lopez-Castejon G, Luheshi NM, Compan V, High S, Whitehead RC, Flitsch S, Kirov A, Prudovsky I, Swanton E, Brough D. Deubiquitinases regulate the activity of caspase-1 and interleukin-1β secretion via assembly of the inflammasome. J Biol Chem 2013; 288:2721-33; PMID:23209292; http://dx.doi.org/10.1074/jbc.M112.422238
- Barker BR, Taxman DJ, Ting JPY. Cross-regulation between the IL-1β/IL-18 processing inflammasome and other inflammatory cytokines. Curr Opin Immunol 2011; 23:591-7; PMID:21839623; http://dx.doi.org/10.1016/j.coi.2011.07.005
- Bryan NB, Dorfleutner A, Kramer SJ, Yun C, Rojanasakul Y, Stehlik C. Differential splicing of the apoptosis-associated speck like protein containing a caspase recruitment domain (ASC) regulates inflammasomes. J Inflamm (Lond) 2010; 7:23; PMID:20482797; http://dx.doi.org/10.1186/1476-9255-7-23
- Eskelinen EL, Saftig P. Autophagy: a lysosomal degradation pathway with a central role in health and disease. Biochim Biophys Acta 2009; 1793:664-73; PMID:18706940; http://dx.doi.org/10.1016/j.bbamcr.2008.07.014
- Xia P, Wang S, Du Y, Zhao Z, Shi L, Sun L, Huang G, Ye B, Li C, Dai Z, et al. WASH inhibits autophagy through suppression of Beclin 1 ubiquitination. EMBO J 2013; 32:2685-96; PMID:23974797; http://dx.doi.org/10.1038/emboj.2013.189
- Li H, Willingham SB, Ting JP, Re F. Cutting edge: inflammasome activation by alum and alum's adjuvant effect are mediated by NLRP3. J Immunol 2008; 181:17-21; PMID:18566365; http://dx.doi.org/10.4049/jimmunol.181.1.17
- Abdul-Sater AA, Tattoli I, Jin L, Grajkowski A, Levi A, Koller BH, Allen IC, Beaucage SL, Fitzgerald KA, Ting JP, et al. Cyclic-di-GMP and cyclic-di-AMP activate the NLRP3 inflammasome. EMBO Rep 2013; 14:900-6; PMID:24008845; http://dx.doi.org/10.1038/embor.2013.132