
Abstract
Autophagic dysregulation has been suggested in a broad range of neurodegenerative diseases including age-related macular degeneration (AMD). To test whether the autophagy pathway plays a critical role to protect retinal pigmented epithelial (RPE) cells against oxidative stress, we exposed ARPE-19 and primary cultured human RPE cells to both acute (3 and 24 h) and chronic (14 d) oxidative stress and monitored autophagy by western blot, PCR, and autophagosome counts in the presence or absence of autophagy modulators. Acute oxidative stress led to a marked increase in autophagy in the RPE, whereas autophagy was reduced under chronic oxidative stress. Upregulation of autophagy by rapamycin decreased oxidative stress-induced generation of reactive oxygen species (ROS), whereas inhibition of autophagy by 3-methyladenine (3-MA) or by knockdown of ATG7 or BECN1 increased ROS generation, exacerbated oxidative stress-induced reduction of mitochondrial activity, reduced cell viability, and increased lipofuscin. Examination of control human donor specimens and mice demonstrated an age-related increase in autophagosome numbers and expression of autophagy proteins. However, autophagy proteins, autophagosomes, and autophagy flux were significantly reduced in tissue from human donor AMD eyes and 2 animal models of AMD. In conclusion, our data confirm that autophagy plays an important role in protection of the RPE against oxidative stress and lipofuscin accumulation and that impairment of autophagy is likely to exacerbate oxidative stress and contribute to the pathogenesis of AMD.
Abbreviations:
- 3-MA, 3-methyladenine
- ACTB, β-actin
- AMD, age-related macular degeneration
- APOE4, apolipoprotein E4
- FACS, fluorescence-activated cell sorting
- FBS, fetal bovine serum
- GFP, green fluorescent protein
- GSH, glutathione, reduced
- GSSG, glutathione, oxidized
- HFC, high fat, cholesterol-enriched diet
- H2O2, hydrogen peroxide
- LC3, microtubule-associated protein 1 light chain 3
- MMP, mitochondrial membrane potential
- MTT, 3-(4 5-dimethylthiazol-3-yl)-2, 5-diphenyl tetrazolium bromide
- ND, normal (rodent) diet
- POS, photoreceptor outer segments
- ROS, reactive oxygen species
- RPE, retinal pigmented epithelium
- SOD2/MnSOD, superoxide dismutase 2, mitochondrial
- UPS, ubiquitin-proteasome system
Introduction
There are 2 major pathways for the degradation of cellular components in eukaryotic cells: the ubiquitin-proteasome system (UPS) and autophagy-lysosome pathway.Citation1,2 Autophagy can be subdivided into chaperone mediated, microautophagy, and macroautophagy, but it is only the latter that has the capacity for degrading entire organelles and large protein aggregates.Citation3-5 Autophagy is a multistep process whereby the cytoplasmic cargo is sequestered by double-membrane autophagosomes, which fuse with lysosomes resulting in the cargo being degraded.Citation1,2,5 In most cells autophagy occurs at basal levels to remove damaged organelles and protein aggregates as part of a cellular repair process. However, in response to oxidative stress, autophagy is significantly increased in an attempt to remove oxidatively damaged organelles such as mitochondria.Citation6 There is accumulating evidence linking autophagic impairment with a range of age-related neurodegenerative diseases including age-related macular degeneration.Citation7-9
The retinal pigmented epithelium (RPE) is a monolayer of pigmented cells located between the neural retina and choroid. The RPE is essential for the maintenance and survival of overlying photoreceptor cells as it performs a number of critical functions, i.e. formation of the outer blood retinal barrier, transepithelial transport, maintenance of the retinoid cycle, phagocytosis, and degradation of photoreceptor outer segment tips, and protection against light and oxidative stress.Citation10 The RPE is particularly susceptible to oxidative damage since it is extremely metabolically active, highly oxygenated, and exposed to photosensitizers such as the age-pigment, lipofuscin.Citation10 This sensitivity leads to a variety of age-related changes that culminate in reduced RPE function and increased susceptibility to cell death. Oxidative stress is a recognized risk factor for AMD in which changes to the RPE and areas of focal loss result in photoreceptor degeneration and loss of central vision.Citation11 Increased mitochondrial damage and generation of reactive oxygen species (ROS) are associated with AMD, suggesting that damaged mitochondria and other oxidatively modified components are not efficiently removed by the aged-RPE cell.Citation11,12 Autophagy is especially crucial in the maintenance of homeostasis of the RPE since these cells are exposed to sustained oxidative stress.Citation6 A number of studies have reported that autophagy occurs in the RPE.Citation13-16 However, insufficient digestion due to impaired autophagy or lysosomal degradation in the RPE is reported to lead to an accumulation of damaged organelles, toxic proteins including lipofuscin, and extracellular drusen deposits, all of which can contribute to RPE dysfunction or death and have been associated with the pathogenesis of AMD.Citation7,10,17 To better understand the role of the autophagy-lysosome pathway for RPE homeostasis, aging, and AMD, we studied the autophagic process and the cellular and molecular pathways under oxidative stress. This study shows that acute exposure to oxidative stress increases autophagy while chronic oxidative exposure reduces autophagy. We observed that the autophagic clearance system is significantly enhanced in both early-onset AMD mouse models and AMD patient samples, but it was reduced in late AMD. In addition, we observed that downregulating the autophagic pathway rendered the RPE more susceptible to oxidative stress while increased autophagic flux protected the RPE from oxidative damage.
Results
Acute H2O2 treatment increases autophagy flux in the RPE
We first wished to determine the effect of a single exposure to sublethal oxidative stress on autophagy in RPE cells. Exposure of ARPE-19 cells to either 200 or 400 μM H2O2 resulted in transient oxidative damage as seen by an increase in carbonylated protein content but did not result in loss of cell viability (). We next examined the effects of H2O2 exposure on the autophagic pathway in RPE cells. We first detected the autophagic response by determining the change in expression of MAP1LC3/LC3 (microtubule-associated protein 1 light chain 3). LC3-I, a cytosolic protein, undergoes lipidation to form LC3-II, which is involved in formation of the autophagosome.Citation18 The ratio of LC3-II to LC3-I is widely regarded as a critical indicator of autophagic activation. Western blot analysis with an anti-LC3 antibody showed that LC3-II and the ratio of LC3-II/-I was significantly increased at 3 h after treatment of ARPE-19 cells with H2O2 and that the increase was greatest at the highest dose of H2O2 tested (), thus demonstrating that acute exposure to H2O2 leads to autophagic activation. By 24 h the autophagic response was dampened and only apparent at 400 μM H2O2. Blocking autophagosome-lysosome fusion with bafilomycin A1, which prevents autophagosomal cargo degradation, can be used to rule out the possibility that the accumulation of LC3-II is due to lysosomal disruption.Citation18 We show that H2O2 exposure also increased LC3-II protein level and the ratio of LC3-II/-I even when the lysosomes were disturbed by bafilomycin A1, confirming that LC3-II accumulation was not due to impaired lysosomal degradation (). We also confirmed that the autophagic response was not specific to the ARPE-19 cell line since the LC3-II/-I ratio was similar in hRPE cells exposed to H2O2 (). In both cell types, the autophagic induction was more robust at 3 h following H2O2 exposure compared to 24 h, suggesting that autophagy was reduced as oxidatively damaged material was removed. Formation of autophagosome puncta containing LC3 has been regarded as a hallmark of autophagic activation.Citation18 To evaluate the formation of autophagosomes we traced the formation of autophagic puncta at different time points (3 or 24 h) after oxidative challenge by immunostaining for LC3. In control ARPE-19 cells, LC3 fluorescence was predominantly dispersed throughout the cytoplasm with only a few baseline autophagosomes present while, in contrast, in H2O2-treated cells, the number of characteristic punctate fluorescent autophagosomes significantly increased (). To assess the expression levels of some key proteins we evaluated the levels of BECN1, ATG7, and ATG9 at 3 h and 24 h by protein gel blot. However, no significant changes were observed for these proteins at these time-points ().
Figure 1. Acute H2O2 treatment increases autophagy flux in the RPE. ARPE-19 (A, B, C, E) and hRPE (D) cells were subjected to sublethal levels of H2O2 (200 or 400 μM) for up to 24 h. (A) Protein carbonyl levels and (B) cell viability and mitochondrial respiration following exposure to H2O2. (C, D) Autophagic flux was monitored in the presence or absence of bafilomycin A1 (Baf A1; 75 nM) by LC3-II/-I conversion with anti-LC3 antibody. Anti-ACTB antibody was used as an internal control. A representative protein gel blot is shown together with densitometric quantification of the LC3-II/-I ratio from a mean of 3 experiments. Differences between groups were considered statistically significant when P < 0.05. (E) Autophagosome counts in ARPE-19 cells were obtained following immunostaining with LC3 antibody to identify autophagic puncta. A representative set of photomicrographs is shown for control cells and those exposed to H2O2. Autophagosome numbers were counted in a minimum of 3 experiments and statistical significance between the control group and each treatment group was determined by ANOVA. Differences between groups were considered statistically significant when P < 0.05.
Figure 2. The effect of H2O2 on the expression of the autophagy-related proteins BECN1, ATG7, and ATG9 in ARPE-19 cells was determined by western blot. ACTB was used as an internal control. A representative protein gel blot is shown together with densitometric quantification from a mean of 3 experiments. Differences between groups were considered statistically significant when P < 0.05.
To confirm that the enhancement of autophagic flux is a common event in the RPE in response to acute oxidative stress, we examined the autophagic response following treatment with rotenone, which is an inhibitor of mitochondria complex I, and leads to increased superoxide generation.Citation19 ARPE-19 cells treated with 1 or 10 μM rotenone for 24 h did not demonstrate any significant loss of cell viability by the crystal violet assay but did show a small (<14 %), but significant, reduction in mitochondrial respiration (). ARPE-19 cells treated with rotenone demonstrated a significant increase in LC3-II expression and the ratio of LC3-II/-I (). A similar response was observed when cells were immunostained for endogenous LC3, with an increased number of autophagosomes in rotenone-treated cells compared to untreated control (). Cell starvation, a common positive control in autophagy experiments, showed a dramatic increase in the LC3-II/-I ratio (). Western blot analysis for expression of the autophagy proteins ATG7, ATG9, and BECN1 () revealed similar results to that achieved with H2O2, in that there were no significant changes in protein levels.
Figure 3. Acute rotenone treatment increases autophagy flux in the RPE. ARPE-19 cells were exposed to 1 or 10 μM rotenone for 6 or 24 h. (A) Cell viability and mitochondrial respiration following exposure to rotenone. (B) Autophagic flux was monitored by LC3-II/-I conversion using western blot with anti-LC3 antibody. ACTB was used as an internal control. A representative protein gel blot is shown together with densitometric quantification of the LC3-II/-I ratio from a mean of 3 experiments. Differences between groups were considered statistically significant when P < 0.05. (C) Autophagosome counts in ARPE-19 cells exposed to 0, 1, or 10 uM rotenone for 24 h were obtained following immunostaining with LC3 antibody to identify autophagic puncta. Statistical significance between the control group and each treatment group was determined by ANOVA. (D) The effect of rotenone on the expression of the autophagy-related proteins BECN1, ATG7, and ATG9 was determined by western blot. ACTB was used as an internal control. A representative protein gel blot is shown together with densitometric quantification from a mean of 3 experiments. Differences between groups were considered statistically significant when P < 0.05.
Chronic H2O2 treatment reduces autophagic flux and the expression of autophagic factors in the RPE
We next investigated whether chronic oxidative stress, which has been implicated in the pathogenesis of AMD and other neurogenerative diseases,Citation11,20 affected autophagy in cultured RPE cells in a similar fashion to a single acute exposure. ARPE-19 cells received repeated exposure to H2O2 (200 μM or 400 μM) every 24 h for up to 14 d. The level of damage as measured by protein carbonyl content in cells challenged by oxidative stress continued to be higher than in untreated control (), but was lower than that for acute exposure (). Chronic stress with 200 or 400 μM H2O2 did not lead to a loss in cell viability () or a change in cell morphology (), but cell death was observed at 600 μM and higher (data not shown). Interestingly, we noticed a significant reduction in mitochondrial respiration for ARPE-19 cells at the 14 d time-point (). Western blot analysis demonstrated that the ratio of LC3-II/-I dramatically decreased in ARPE-19 cells upon prolonged exposure to H2O2 (). A similar response was observed for hRPE cells exposed to oxidative stress () and treatment of both cell types with bafilomycin A1 led to an increase in LC3-II. We next assessed expression of key autophagic proteins ATG7, ATG9, and BECN1. The levels of BECN1 and ATG9 were significantly reduced in ARPE-19 cells treated with chronic oxidative stress at all concentrations while the level of ATG7 was reduced at 400 μM hydrogen peroxide only (). Together, these results demonstrate that repeated exposure to H2O2 caused a reduction in autophagic flux in RPE cells.
Figure 4. Chronic exposure to hydrogen peroxide reduces autophagic response in the RPE. ARPE-19 (A–D, F) and hRPE cells (E) were treated with 200 or 400 μM H2O2 daily for 14 d. Control cells received vehicle alone. (A) Protein carbonyl levels and cell viability following exposure to H2O2. (B) Cell viability and mitochondrial respiration following exposure to H2O2. (C) Phase contrast images of ARPE-19 cells either untreated or exposed daily to H2O2. Scale bar: 100 μm. (D,E) Autophagic flux was monitored in the presence or absence of bafilomycin A1 (Baf A1; 75 nM) by LC3-II/-I conversion with anti-LC3 antibody. ACTB was used as an internal control. Representative western blots are shown together with densitometric quantification of the LC3-II/-I ratio from a mean of 3 experiments, Differences between groups were considered statistically significant when P < 0.05. (F) The effect of H2O2 on the expression of the autophagy-related proteins BECN1, ATG7, and ATG9 was determined by protein gel blot. ACTB was used as an internal control. A representative western blot is shown together with densitometric quantification from a mean of 3 experiments. Differences between groups were considered statistically significant when P < 0.05.
Modulation of autophagy regulates oxidative stress-induced ROS generation, mitochondria activity, and cell viability in ARPE-19 cells
To further examine the role of autophagy in oxidative stress-induced cell toxicity in RPE cells, we assessed the cellular response to exogenous H2O2 after stimulation or inhibition of autophagy by rapamycin or 3-methyladenine (3MA), respectively.
We first confirmed that 3-MA inhibited autophagy whereas rapamycin promoted autophagy under oxidative stress by counting the number of LC3-positive puncta/autophagosomes (). Moreover the mitochondrial activity measured by the MTT assay was significantly reduced in 3-MA and H2O2 co-treated cells compared to cell treated with H2O2 alone (). Treatment with rapamycin protected ARPE-19 cells from a lethal dose of H2O2 (1.5 mM), whereas 3-MA treated cells showed decreased viability in response to H2O2 (). To confirm that the loss of cell viability and increased ROS production was not due to nonspecific effects of 3-MA, we used lentiviral shRNA to knock down BECN1 and ATG7 expression in the ARPE-19 cells (). The loss of autophagic activity was confirmed by fluorescent autophagosome counting and LC3 lipidation (data not shown). As expected, both gene knockdowns caused RPE cells to show higher susceptibility to H2O2 exposure ().
Figure 5. Reduced autophagy renders ARPE-19 cells more susceptible to oxidative stress while increased autophagy protects cells against oxidative stress. (A) Autophagosome counts in ARPE-19 cells treated for 12 h with 3-MA (10 mM) or rapamycin (100 nM) and treated with H2O2 (400 μM) for 3 h were obtained following immunostaining with LC3 antibody to identify autophagic puncta. (B) ARPE-19 cells were pretreated for 12 h with 3-MA (10 mM) or rapamycin (100 nM) and treated with H2O2 (400 μM) for 3 h after which mitochondrial respiratory activity was determined using the MTT assay. Differences between means were considered statistically significant from 4 independent experiments when P < 0.05 using one-way ANOVA. (C) The crystal violet assay was performed on 3-MA and rapamycin pretreated RPE cells and subsequently exposed to 0.8 and 1.5 mM H2O2. Differences between means were considered statistically significant from 4 independent experiments when P < 0.05 using one-way ANOVA. (D) BECN1 and ATG7 knockdown by lentiviral shRNAs in RPE was confirmed by protein gel blot. Knockdown was considered statistically significant when P < 0.01 from at least 3 independent experiments (E) The MTT assay was performed on ARPE-19 cells with BECN1 or ATG7 knockdown to assess the cell viability in response to increasing concentrations of H2O2. Differences between means were considered statistically significant from 4 independent experiments when P < 0.05 or 0.01 using one-way ANOVA.
A reduction in mitochondrial membrane potential (MMP) is frequently observed in cells under oxidative stress.Citation21 We therefore wanted to evaluate whether autophagy in the RPE protects against loss of MMP. We assessed MMP using JC-1 dye and measuring the red/green ratio. A decrease in MMP in ARPE-19 cells was observed 3 h following exposure to 200 and 400 μM H2O2 (), which was not apparent at 24 h (data not shown), indicating the ability of the RPE mitochondria to recover from acute oxidative stress over a longer 24-h period. Pretreatment with rapamycin rescued the cells from the loss of MMP (). We next investigated whether a similar response was obtained if ARPE-19 cells were treated with rotenone as the stressor. As expected rotenone prevented this decrease in MMP (). To further test whether inhibition of basal autophagy sensitizes the mitochondria to oxidative stress, we compared the MMP of stable ATG7 shRNA-transfected ARPE-19 cells to scrambled shRNA transfected cells. ATG7 knockdown itself did not affect MMP. However, MMP was significantly decreased in ATG7 knockdown ARPE-19 cells 24 h after exposure to 200 and 400 μM H2O2 (). Interestingly, loss of MMP was also observed to occur at lower concentrations of H2O2 indicating that inhibiting autophagy increased susceptibility to mitochondrial damage. Although at 24 h we saw a recovery trend of MMP in ARPE-19 cells treated with 200 and 400 μM H2O2 (data not shown), chronic exposure showed dramatic reduction of MMP ().
Figure 6. The effect of oxidative stress on mitochondrial membrane potential and glutathione levels in ARPE-19 cells. (A) Cells were pretreated with rapamycin for 3 h and then exposed to H2O2 (200 and 400 μM) for 3 h. Cells were assessed for mitochondrial membrane potential using the JC-1 dye. (B, C) Cells were treated with rotenone (1 and 10 μM) for 24 h and mitochondrial membrane potential determined using the JC-1 dye. (B) Representative photomicrographs showing JCI staining. (C) Quantitation of JC-1 staining using a fluorometric plate reader. (D,E) Stable ATG7 knockdown and scrambled control ARPE-19 cells were treated with H2O2 for 24 h and assessed for mitochondrial membrane potential using JC-1 dye. (D) Representative photomicrographs showing JC-1 staining. (E) Quantification of JC-1 staining using a fluorometric plate reader. (F) Mitochondrial membrane potential was measured using JC-1 dye on cells treated for 14 d with H2O2 (200 and 400 μM). (G) ARPE-19 cells were incubated with H2O2 (200 μM) for 24 h and the intracellular GSH:GSSG ratio was determined by the glutathione assay kit. (H) Mitochondrial mass was compared following exposure to 200 μM H2O2 for 24 h in ARPE-19 cells either pretreated or not treated with rapamycin (100 nM) for 3 h. Data were analyzed using one-way ANOVA and differences between means were considered statistically significant when P < 0.05.
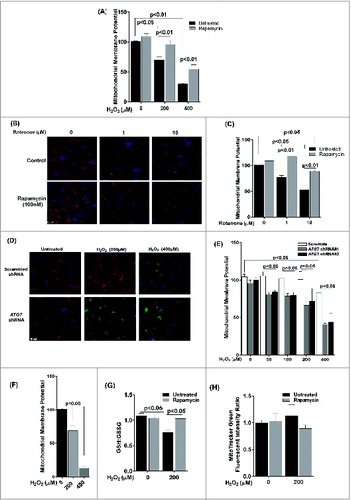
Glutathione (GSH) is established as a protective cellular component against oxidative damage caused by ROS. We have previously shown that oxidative stress with H2O2 reduces the ratio of reduced to oxidized glutathione (GSH:GSSG) in ARPE-19 cells.Citation22 We therefore evaluated whether the GSH:GSSG ratios are modulated by autophagy in ARPE-19 cells. Rapamycin treatment did not increase the GSH:GSSG ratio in untreated cells (). However, the decrease in GSH:GSSG ratio following H2O2 treatment was attenuated when cells were treated with rapamycin. In order to verify if changes in mitochondrial density are associated with changes in mitochondrial respiration and ROS generation in ARPE-19 cells, we used MitoTracker Green dye to stain the mitochondria and measured the fluorescence intensity in rapamycin-treated cells by flow cytometry. There was no significant difference between rapamycin-treated and untreated cells () indicating that rapamycin did not cause significant changes to the overall mitochondrial mass.
Exposure of ARPE-19 cells to chronic H2O2 (200 μM for up to 14 d) resulted in an increase in ROS generation, which was increased by 30% in RPE cells treated with both H2O2 and 3-MA compared to H2O2-treated cells (). Moreover, chronic treatment with H2O2 together with the autophagy inhibitor 3-MA significantly reduced mitochondria respiration compared to H2O2 treatment alone ().
Figure 7. Decreased autophagy increases the generation of reactive oxygen species (ROS) and accumulation of lipofuscin-like granules in the RPE. After daily exposure of ARPE-19 cells to 200 μM H2O2 for 14 d 3-MA or rapamycin was added 12 h before assaying for: (A) ROS in RPE by the H2DCFDA assay, (B) mitochondria respiration using the MTT assay and (C) RPE cells maintained in basal medium with daily exposure to leupeptin (100 μM), rapamycin (50 nM), 3-MA (10 mM), or vehicle control for up to 14 d. The accumulation of autofluorescence granules was determined at 7 and 14 d by FACS analysis. (D) RPE cells were fed 2 × 10⁷ photoreceptor outer segments (POS)/ml daily either alone or in combination with 3-MA or rapamycin in basal media. Autofluorescent granule accumulation was determined at 7 and 14 d by FACS analysis. For each experiment, differences between means were considered statistically significant from 3 independent experiment when P < 0.05.
Excessive lipofuscin accumulation in the RPE has a strong association with the pathogenesis of AMD.Citation17 In vivo, RPE lipofuscin is derived from the incomplete lysosomal degradation of phagocytosed photoreceptor outer segments and damaged intracellular organelles.Citation17 We found that treatment of RPE cells with 3-MA or leupeptin to block the autophagic pathway resulted in an increase in lipofuscin formation over baseline, whereas treatment with rapamycin to enhance autophagy caused a small, but significant, reduction in the baseline level of autofluorescence (). Since lipofuscin formation in the RPE is a byproduct of photoreceptor phagocytosis we also examined whether modulating autophagy affected the accumulation of lipofuscin after feeding the RPE cells with photoreceptor outer segments. Treatment with rapamycin reduced autofluorescence by >20 % in cells fed with photoreceptor outer segments, but both 3-MA and leupeptin enhanced lipofuscin accumulation () suggesting a crosstalk between autophagy and phagocytosis. These observations demonstrate that autophagy is an adaptive early response to oxidative stress that reduces cytotoxicity and lipofuscin accumulation in ROS-challenged RPE cells.
Autophagy increases in aging and AMD
We next wanted to evaluate how autophagy changes as a function of age as well as in AMD using 2 mouse models of AMD and human donor specimens from AMD patients and age-matched controls (, ). Increasing age in both C57BL6 mice and humans resulted in a greater than 100% increase in the number of autophagosomes in the RPE (). We elected to use 2 complementary and well-characterized mouse models of AMD for this study; the Sod2 knockdown modelCitation23 and the APOE4-HFC model (aged over 14 mo and fed an HFC diet for 2 mo)Citation24 to investigate the spatial and temporal changes in the expression levels of autophagy proteins. We noticed that the expression of LC3, ATG7, and ATG9 was dramatically increased in the retina 1 mo after Sod2 knockdown compared to control. Increased expression of these autophagy proteins was observed in all retinal layers including the RPE. However, at later time-points, with more advanced AMD phenotype, the expression of these proteins was reduced suggesting that the autophagic response is increased in the early stages of the disease in this model, but that at the later stages autophagy may be impaired (). Similarly, in the APOE4-HFC model we noticed an increase in the levels of LC3 and ATG7 as well as ATG9A across the retina, but most predominantly in the RPE for ATG7 (). The fractional volumes of both autophagosomes and autolysosomes in the RPE were measured using morphometric analyses of electron micrographs. Measurement of the fractional volumes of autophagic vacuoles from electron micrographs in the RPE of our AMD animal models demonstrated an increase in both models compared to control although with longer duration of disease in the Sod2 knockdown model autophagosomes appeared to be reduced compared to early disease (). Western blot of autophagy proteins in the RPE/choroid/sclera demonstrated a significant increase in ATG7, ATG9A, and SQSTM1/p62 in the RPE/choroid/sclera, and a small but significant increase in LC3-II/-I ().
Figure 8. Expression of autophagy proteins and autophagosome volume in 2 rodent models of AMD. (A) Sod2 knockdown in C57BL6 mice was achieved with subretinal AAV1-Rz-SOD2 (AAV1 containing inactive ribozyme acted as a control). Animals were sacrificed at 1 mo and 3 mo (early AMD) and 6 mo (late AMD) following Sod2 knockdown (n = 6 per group). (A) Retinas were fixed in paraformaldehyde, paraffin embedded, and immunostained for LC3, ATG7 and ATG9 (red), and DAPI was used to visualize the nuclei (blue). Representative photomicrographs are shown for Sod2 knockdown and control animals. (B) APOE4 mice at the age of 15 mo were fed a high fat, cholesterol-enriched (HFC) diet for a period of 2 mo (n = 6 per group). Age-matched control APOE4s were maintained on a normal diet (ND). Retinas were fixed in paraformaldehyde, wax embedded and immunostained for LC3, ATG7, or ATG9 (red), and DAPI was used to visualize the nuclei (blue), Representative photomicrographs are shown for APOE4-HFC and APOE4-ND control animals. (C) Autophagosome fractional volume in the RPE of 6-mo- and 12-mo-old WT mice, Sod2 knockdown mice at 6 and 12 mo following Sod2 knockdown and APOE4 mice on normal (ND) and high fat cholesterol-enriched (HFC) diets (n = 6 per group). (D) Representative electron micrographs showing autophagosomes (arrows) in SOD2 knockdown and control animals. Scale bar: 1 μm. (E) RPE/choroid/sclera lysates from APOE4-HFC (black bars) and APOE4-ND (grey bars) mice (n = 6 per group) were assessed for the level of autophagic proteins by western blot and densitometric quantification. Expression was normalized to ACTB as internal control. Differences between means were considered statistically significant when P < 0.05.
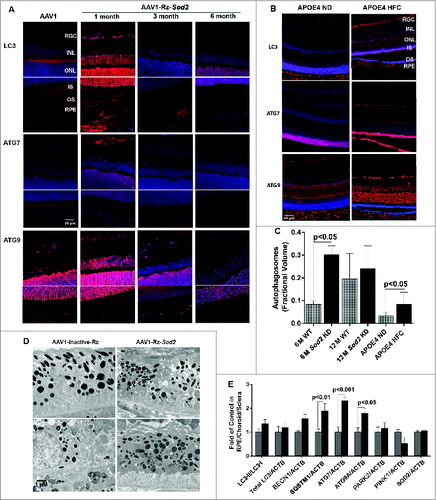
Figure 9. Expression of autophagy proteins and autophagosome volume in human retinas from normal and AMD donors. (A) Representative photomicrographs from human donor retinas from young, old, early AMD and late AMD. Retinas were fixed in paraformaldehyde, paraffin embedded, and immunostained for LC3, ATG7 or ATG9 (red), and DAPI was used to visualize the nuclei (blue). Each group had n = 4 specimens for analysis. (B) Omission of primary antibody. (C) Fractional volumes of autophagosomes in the RPE of human donor retinas from young, old, early AMD, and late AMD determined from electron micrographs (n = 5 per group), P < 0.05.
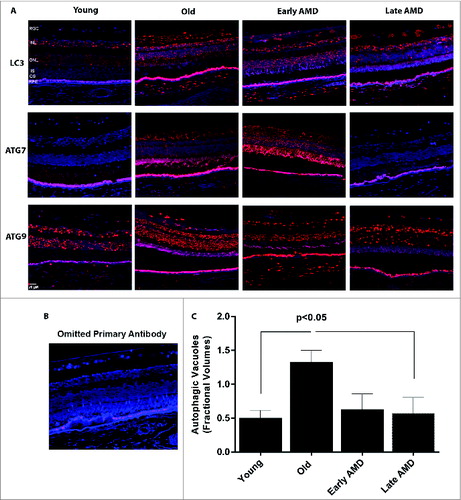
Semiquantitative analysis of tissue sections from AMD donors and age-matched controls demonstrated an upregulation of the LC3, ATG7, and ATG9 protein levels in the RPE and also across the retina of the older non-AMD donors when compared to those of the younger non-AMD donors (). Age-matched AMD patient retinas showed higher levels of ATG7 and ATG9A, whereas the level of LC3 was reduced in the early AMD stages. However, the late AMD patient retinas exhibited a substantial reduction of the protein levels when compared to the non-AMD and early-AMD specimens. On further comparison of autophagosome fractional volumes in the RPE of donors, we observed that although there is a significant increase in the older donors compared to young, the fractional volume was substantially lower in both early and late AMD donor RPE compared to age-matched controls ().
Discussion
Our study identifies that 1) autophagy is dysregulated in the RPE and neural retina of human AMD specimens and rodent models with an AMD phenotype, 2) oxidative stress significantly alters the autophagic response and 3) increasing autophagy protects against oxidative stress.
Reports on autophagy in the retina include retinal degeneration following acute light exposureCitation25,26 or retinal ganglion cells following optic nerve transectionCitation27 and regulation of autophagy for RPE cells.Citation13,14,Citation28-31 Recent studies from our laboratory and others indicate a potential role of autophagy in lipofuscin accumulation, drusen formation, and AMD pathogenesis.Citation14,22,31 We found that with aging there seemed to be a dramatic increase in LC3, ATG7, and ATG9 in the RPE as well as other retinal layers of non-AMD human donors and our rodent models. It has been reported that autophagic flux increases during aging due to the ROS-induced intracellular burden of damaged organelles and accumulated macromolecules.Citation32 Impaired or insufficient autophagy activity in aged cells is implicated in numerous diseases, including inflammatory diseases, neurodegenerative diseases, heart diseases, and cancer.Citation2,8,9 This increase was also true for the retinas of patients showing signs of early AMD. However, with late-stage AMD the abundance of these proteins seemed to be reduced. These data were corroborated by our analysis of electron micrographs, which demonstrated a decrease in autophagosomes in the diseased state when compared to the age-matched, nondisease donors. Both the mouse models for AMD showed a similar dramatic increase in the earliest disease stages, whereas in the latter stages of the disease the Sod2 knockdown model showed loss of autophagy markers. There was, however, still a significantly higher number of autophagosomes in the RPE at the 6 mo post-injection stage for this model compared to the nondiseased RPE, whereas 12 mo post-injection, the number appeared to recede. We speculate that this increased autophagosome number at a stage when protein markers have already started to diminish (6 mo post-injection) is a result of reduced lysosomal efficiency to degrade the autophagosomes, which has been implicated in the mechanism of development of AMD.Citation7,14 While the SOD2/MnSOD disease model gave us the opportunity to observe autophagic phenomena at multiple stages after SOD2 knockdown, the APOE4-HFC mouse model of AMD was studied only at a single time-point and showed an increase in the autophagic markers with increased autophagic fractional volumes. A possible explanation for this observation is the requirement of autophagy in lipid catabolism that is encountered in this model due to the inability in maintaining cholesterol homeostasis.Citation24 It is quite possible that during the 2-mo time period of HFC diet autophagy continues to be stimulated to relieve the lipid burden.Citation24,33,34 It will be interesting to assess the effect of a longer duration of HFC diet on the APOE4 model and to measure the levels of the markers in order to completely assess the fate of autophagy. We think that this increase in autophagy is protective since pharmacological upregulation of autophagy in this model has shown a better survival of RPE (data not shown). Our findings, based on the mouse models and the human disease, suggest that while all mouse models of AMD reproduce the characteristics of the disease, subtle differences remain in the molecular mechanisms that may set them apart from the actual human disease. Based on our current knowledge of aging and the risk factors for AMD we conclude that overall autophagic capacity is increased in aging and early stage AMD to compensate for increasing oxidative stress and damage to intracellular organelles.Citation7,14 However, we would anticipate that in more advanced AMD, the autophagic system becomes overloaded and is unable to cope with the increase in damaged intracellular organelles and aggregates. Thus, it is likely that changes in autophagy begin as a consequence of aging and AMD but, later the autophagic process becomes impaired and thus contributes to the progression of later-stage AMD.
In the present study, we show a dynamic alteration of autophagic flux in cultured RPE cells under oxidative stress: acute (short-term) exposure to oxidative stress increases autophagy activity while, in contrast, chronic (long-term) exposure to oxidative stress induces dramatic autophagy reduction. We have also shown that the activation of autophagy in response to oxidative stress is inhibited by 3-MA, suggesting that the oxidative stress is acting through the class III phosphatidylinositol 3-kinase regulator of autophagy. Furthermore, we systematically demonstrated that increasing autophagic flux protects the RPE from oxidative damage and death whereas downregulating the autophagic pathway renders the RPE cells more susceptible to oxidative stress. Our data suggest that the association between autophagy and oxidative stress may be under 2-way regulation since oxidative stress promotes autophagy and increased autophagy reduces oxidative damage and increases antioxidant capacity thus decreasing the oxidative stimulus. Surprisingly, we showed that autophagy activity increased during aging in the RPE of rodents, which is in contrast with other tissues in which autophagic activity has been reported to decrease with age.Citation35 However, we also show that autophagy capacity appears to be reduced by >25 % in AMD donors compared to age-matched controls.
A growing body of evidence from cell culture and animal models indicates that oxidative stress is a key mediator of RPE cell death during aging and the development of age-related macular degeneration.Citation11,36 Oxidative stress in the RPE is largely derived from (1) ROS generation from mitochondria and photo-oxidation but also partially from NADPH oxidase, and (2) a reduction in the ability to repair/remove oxidatively damaged proteins and organelles.Citation11,36 In the present study we exposed RPE cells to sublethal concentrations of oxidative stress, but sufficient to induce oxidation of intracellular organelles and macromolecules. Our in vitro data on protein carbonylation in ARPE-19 cells is in agreement with values reported previously in these cellsCitation37 and oxidized protein levels at 2 nM/mg protein have been reported in neurons in the substantia nigra, which is within the range in our study.Citation38 We observed that exposure of naïve cells to a single dose of sublethal oxidative stress resulted in increased autophagy, whereas repeated daily exposure to multiple chronic stress decreased autophagy compared to the control. There is a wide variability in the reported response of cultured RPE cells to H2O2 which range from 50 μM to 15 mMCitation39,40 with Kurz and colleagues reporting that RPE cells are highly resistant to oxidative stress and can survive up to 15 mM H2O2.Citation40 The variation between studies is due to a wide variety of factors: whether the cells are proliferating or confluent, the degree of differentiation, the density of the cells (i.e., the greater the cell number the less effective the oxidative stressor will be),Citation41 and the culture media. In essence, a proliferating undifferentiated low-density culture will be much more sensitive to H2O2 than a confluent, nondividing, differentiated, high-density culture such as we have used. The concentration of H2O2 used in this study falls within the published range and has been well validated in publications from this lab.Citation11,42,43 However, to what extent these H2O2 concentrations recapitulate those that occur in vivo is unclear due to a paucity of data in this area. Studies suggest that physiological H2O2 levels reach around 100 μM in the vitreousCitation44 and there is reported to be a burst of H2O2 generation in the RPE following phagocytosis of photoreceptor outer segments.Citation45 The increase in autophagy in response to oxidative stress is as expected and reported for other cell types. However, the decrease in autophagy in response to daily chronic oxidative stress can be explained in a number of ways. First, cells located in inherently oxidizing microenvironments use the adaptive response as an important antioxidant defense, and we have previously shown that chronic oxidative stress leads to an increase in CAT/catalase, SOD1/CuZnSOD and glutathione peroxidase activity in the RPE.Citation42 Thus it is possible that by 14 d exposure to chronic oxidative stress the RPE now shows significantly less oxidative damage and there is reduced need for an autophagic response. This is supported by our observation that protein carbonyl levels are lower in RPE cells exposed to chronic oxidative stress compared to a single exposure. A recent study in retina further supports the idea that macroautophagy may be compromised with age and is compensated for by microautophagy, which can alleviate the load of damaged protein by removing some proteins, but cannot necessarily remove the larger organelles like mitochondria that macroautophagy is specialized to remove.Citation46 Second, adaptation may lead to a downregulation of autophagy proteins as we observed in this study. It should be emphasized that the H2O2 will have degraded in the cultures within about 30 min after application and thus this model represents short bursts of exposure to oxidative stress and probably better reflects the situation in the eye.
Autophagy involves the coordinated activity of more than 30 autophagy-related proteins.Citation2,5 In the present study, we found that acute exposure to H2O2 caused an increase in autophagy proteins while chronic oxidative stress reduced the expression of several key autophagy proteins. BECN1 sits at the center in regulating autophagy by interacting with several cofactors that promote the formation of the BECN1-PIK3C3-PIK3R4 core complex to activate PIK3C3 lipid kinase activity,and induce autophagy.Citation47 A critical component of the autophagosome, LC3 has been regarded as a primary biochemical marker for autophagy activation. During autophagy, LC3-I, the cytosolic form, is conjugated to phosphatidylethanolamine to form the LC3-phosphatidylethanolamine conjugate (LC3-II), which is then recruited to phagophore membranes; part of the autophagosome-associated pool of LC3-II is then degraded with the cargo in the lysosome. Therefore, monitoring the conversion of LC3-I to LC3-II is indicative of autophagic flux and has been regarded as a reliable autophagy marker.Citation48 In the RPE, as recent studies suggest, LC3 is implicated in the phagocytic pathway linking it with a noncanonical autophagic degradation pathway.Citation13 ATG7, an E1 ubiquitin activating-like protein, is involved in the covalent isopeptide linkage of ATG5 and ATG12 to contribute to the elongation of the phagophore membrane. ATG9 is thought to play a role in supply of components for formation of the autophagosomal membrane.Citation49 Taken together, we found that acute oxidative stress increases autophagic activity, but chronic oxidation decreases autophagy. To assess cumulative autophagic flux induced by oxidative exposure, we used bafilomycin A1 that prevents autophagosome–lysosome fusion thereby blocking the degradation of LC3-II in the lysosome, and we obtained results in agreement with the ‘steady state’ experiments (without bafilomycin A1 co-treatment). While LC3-I accumulation was obvious with rotenone treatment there was no change in the levels of BECN1, ATG7, or ATG9 expression. This may not be unexpected since progression of the autophagy pathway is more dependent on mobilization of autophagy proteins that are constitutively expressed rather than upregulation of these proteins. While the proteins BECN1, ATG7, and ATG9 are critical for the autophagic pathway to function, they are not required to be upregulated for the pathway to be stimulated following acute oxidative stress. However, in the long-term stress model, these proteins are depleted and this leads to a decrease in autophagy as we have shown in this study.
Numerous studies have reported the role of autophagy in regulating cell fate under stress.Citation50-52 While suggesting that autophagy may be detrimental to the cell when under stress, many other reports suggest that induction of autophagy is a protective attempt by the cell to evade death under stress conditions that often turn out to be a futile effort under an overwhelmingly challenging environment.Citation50-52 Although a role in damage vs. protection remains a subject of strong debate, autophagy is considered to be a process that is critical in maintaining cellular function and quality.Citation2,5 Herein, we also demonstrated that autophagy is implicated in the pathogenesis of AMD. Stimulation of autophagy by rapamycin improved autophagic efficiency and protected RPE cells against cell death exposed to lethal concentrations of H2O2. Rapamycin is widely used to stimulate macroautophagy by inhibition of the mechanistic target of rapamycin, MTOR.Citation53 However, MTOR is a kinase at a key signaling node that integrates information regarding extracellular growth factor stimulation, nutrient availability, and metabolism and thus is not specific for the autophagy pathway.Citation53 Our western blot and LC3 expression data clearly demonstrate that rapamycin is increasing autophagy but it is possible that rapamycin could also be acting, in part, by modulating metabolism. Inhibiting autophagy either pharmacologically or by inhibiting endogenous expression of key autophagic proteins caused cell viability and mitochondrial activity to be compromised. Furthermore, we show some key features of stressed RPE such as increased buildup of ROS and lipofuscin when autophagy is compromised. Conversely, stimulating the autophagic pathway significantly decreases this accumulation. This finding essentially corroborates reports in the literature that loss of autophagy-lysosomal degradation can contribute to buildup of lipofuscin.Citation22,29,54,55 Although in our studies we did not witness a change in mitochondrial density by enhancing autophagy with rapamycin, we found that reduction in the intracellular GSH:GSSG ratio after oxidative stress was attenuated by rapamycin suggesting that enhancing autophagy may offer protection to RPE by increasing the antioxidant activity of glutathione.
In summary, we present a novel finding that the low-dose oxidative stress in short-term exposure is able to induce autophagy activation as an early event to prevent oxidative damage to RPE cells, whereas long-term oxidative exposure decreases autophagy and causes cell death. We also show that the autophagy enhancer rapamycin has a protective effect against H2O2-induced ROS generation, but the autophagy inhibitor 3-MA renders cells more susceptible to H2O2-induced cell toxicity and cell death, indicating the protective role of autophagy in RPE cells under oxidative exposure. It seems most likely that autophagy is a response to increased oxidative stress in AMD and that this activates the autophagy pathway as a protective response. Subsequent impairment of autophagy will then contribute to the progression of AMD through the failure to remove damaged organelles. Upregulating autophagy may offer an alternative therapeutic strategy to slow or halt the progression of AMD by preventing the accumulation of oxidatively damaged material in retinal cells.
Materials and Methods
Materials
The ARPE-19 (ATCC, CRL-2302) and HEK293T (ATCC, CRL-3216) cell lines were obtained as frozen vials and seeded in appropriate tissue culture media. Human donor eyes for cell culture were obtained from NDRI. Hydrogen peroxide (Sigma-Aldrich, 216763–100ML), rotenone (Sigma-Aldrich, R8875), 3-methyladenine (3-MA; Sigma-Aldrich, M9281), rapamycin (Sigma-Aldrich, R0395–1MG), bafilomycin A1 (Sigma-Aldrich, B1793), thiazolyl blue tetrazolium bromide (MTT; Sigma-Aldrich, M5655), leupeptin (Sigma-Aldrich, 2884), metaphosphoric acid (Sigma-Aldrich, 239275), triethanolamine (Sigma-Aldrich, T58300), 2-vinylpyridine (Sigma-Aldrich, 132292) and Krebs-Henseleit Buffer (Sigma-Aldrich, K3753) were obtained and reconstituted according to the manufacturer's recommendations. DMEM cell culture medium (Cellgro, 10–013-CV) Ham's F10 cell culture medium (Cellgro, 10–070-CV), Opti-MEM reduced serum medium (Invitrogen, 31985070), fetal bovine serum (FBS; Sigma-Aldrich, 26140079), trypsin-EDTA solution (0.05% and 0.25%) (Cellgro, 25–052-Cl and 25–050-CI), TRIzol reagent (Cellgro, 15596–018), Lipofectamine LTX transfection reagent (Invitrogen, 15338–100) and Lipofectamine 2000 transfection reagent (Invitrogen, 11668–027) were purchased from Life Technologies. Two′, 7′-dichlorodihydrofluorescein diacetate (H2DCFDA; EMD Chemicals, 287810–100MG) was obtained and reconstituted according to the manufacturer's recommendations. The Bradford protein assay kit (Bio-Rad Laboratories, 500–0201) was purchased and used following the manufacturer's protocol. The primary antibodies used in this study were rabbit polyclonal antibodies anti-LC3 (Novus Biologicals, NB100–2220), anti-ATG9A (Novus Biologicals, NB110–56893), mouse monoclonal antibodies anti-ACTB (Sigma-Aldrich, A5441), anti-α-tubulin (Sigma-Aldrich, T9026), rabbit polyclonal antibody anti-ATG7 (Sigma-Aldrich, SAB1407006), and mouse monoclonal anti-BECN1/Beclin 1 (BD Biosciences, 312113). Anti-mouse IgG (whole molecule)–peroxidase antibody (Sigma-Aldrich, A9044), anti-rabbit IgG (whole molecule)–peroxidase secondary antibodies (Sigma-Aldrich, A0545) and ECL chemiluminescence kit (Amersham Pharmacia Biotech, RPN2132) were obtained from the indicated sources. IRDye 800-conjugated anti-rabbit (Rockland Labs, 611–132–002) and Alexa Fluor 680 conjugated goat anti-mouse (Invitrogen, A-21058) secondary antibodies were obtained and used for protein gel blotting and immunohistochemistry based on the manufacturer's recommendations. MitoTracker Green dye (Invitrogen, M-7514) and JC-1 dye (Invitrogen, T-3168) were prepared as recommended.
Cell culture and treatment paradigm
Human ARPE-19 cells were grown in Ham's F10 Medium containing 10% FBS at 37°C in a humidified atmosphere containing 5% CO2/95% air as we have previously described.Citation42 Primary human RPE was cultured from postmortem human eyes (Age: 16 to 61 y) obtained from NDRI as previously described in Ham's F10 media containing 20% FBS and supplemented with 0.4% glucose (Fisher Scientific, D16–1).Citation56 Primary cultures were used between 2nd and 4th passage. ARPE-19 cells and primary human RPE cells were grown to confluence on plastic culture dishes and maintained in basal media (Ham's F10 Medium + 2% FBS) for up to 7 d before experimentation to allow the cells to develop a polarized epithelial layer. Cultures were exposed to either 0–400 μM H2O2 or 0–10 μM rotenone in basal medium. For “acute” exposure studies cells received a single application of H2O2 or rotenone for 6 h and for “chronic” studies cells were exposed to H2O2 as indicated daily for 14 d. Selected studies were undertaken in the presence of the autophagy activator rapamycin (100 nM) or the autophagy inhibitor 3-MA (10 mM) for the duration of the experiment. Untreated or vehicle-treated cells were used as controls. For starvation, ARPE-19 cells were incubated with sterile filtered Krebs-Henseleit Buffer supplemented with CaCl2 at 37°C for 3 h.
Western blot analysis
Cells were lysed in RIPA buffer (Thermo Scientific, 89901) containing protease inhibitor (Roche Applied Science, 11873580001). Cell lysates containing equal amounts of protein were loaded in each lane and separated on a 12% SDS-PAGE gel. After separation, proteins were transferred to a nitrocellulose membrane (0.22 μm; Bio-Rad Laboratories, 162–0112), and nonspecific binding sites were blocked by treating with 5% nonfat dry milk (Fisher Scientific, NC0339922) or Licor blocking buffer (Li-Cor Biosciences, 927–40000). The membranes were then incubated with primary antibodies directed against LC3 (1:1000), ATG7 (1:1000) or ATG9 (1:1000). The primary antibody treatments were followed by treatment with an HRP-conjugated secondary antibody (for the ECL detection system) or secondary IR dye-800 conjugated anti-rabbit dye or Alexa Fluor 680 conjugated anti-mouse IgG (for the Licor Odyssey system) for 1 h at room temperature. To confirm equal protein loading, blots were reprobed with anti-ACTB antibody (1:5000 dilution) or α-tubulin antibody (1:5000 dilution). For band detection, the membranes were incubated with a western blot detection system (ECL Plus) and exposed to single-emulsion film (Biomax MR Sigma, Z370398–50EA). Band intensities were determined using software developed by Wayne Rasband (ImageJ; National Institutes of Health, Bethesda, MD; available at http://rsb.info.nih.gov/ij/index.html). Statistical significance was calculated using the Mann-Whitney U-test.
Human donor retina
Human eyes were obtained from deceased and de-identified AMD patient and age-matched non-AMD control donors from the Lions Eye Bank of Oregon and NDRI with full approval for use in research. Four eyes from each age-group (young, old, early AMD and late AMD) were used.
AMD mouse models
Human apolipoprotein E4 targeted-replacement (APOE4) mice at the age of 14–15 mo were fed with a high fat, cholesterol-enriched (HFC) diet for a period of 2 mo.Citation24 Age-matched APOE4 mice maintained on a normal diet (ND) throughout were treated as a control group (n = 10) to compare to the APOE4-HFC mice (n = 10) for comparison of autophagic protein levels by protein gel blot. For immunohistochemistry 6 mice from each group were sacrificed and probed with respective antibodies.
The SOD2 knockdown model was based on the AMD model as described by Justilien et al.Citation23 Briefly 6-wk-old mice received subretinal injection with AAV1-Rz-Sod2 construct in one eye and AAV1 expressing inactive ribozyme in the contralateral eye. The mice were sacrificed at 1, 3, and 6 mo post injection and the retinas were analyzed for expression of autophagic proteins by immunohistochemistry.
Perfusion and dissection of mouse eyes
The mice were euthanized using CO2 and immediately perfused with phosphate-buffered saline (PBS; Cellgro, 10–040-CV) before one eye was enucleated and kept on ice. Then the mouse was further perfused with 4% paraformaldehyde before the second eye was removed for immunohistochemistry. The cornea, lens, retina, and connective tissue were quickly removed from the PBS-perfused eye and the RPE/choroid/sclera was immediately frozen. Lysates were made for subsequent biochemistry analysis as follows: 80 μl of RIPA buffer with protease inhibitors was added to each tube containing each RPE/choroid/sclera, and the tissue was homogenized with a micro grinder (Argos). After sitting on ice for 30 min with vortexing every 10 min the samples were centrifuged at 8,000 g for 15 min and the supernatant fraction removed. The protein concentration was measured using a BCA protein assay kit (Pierce, 23227).
Autophagosome detection by immunostaining
After completion of respective treatments cells were washed 2 times in PBS and fixed in 4% paraformaldehyde for 15 min and subsequently immunostained with rabbit polyclonal LC3 antibody (Novus Biologicals, NB100–2220) for autophagic puncta. Fluorescent micrographs of immunostained LC3 were obtained and analyzed by Axiovision Rel 4.4 software (Zeiss, Oberkochen, Germany). The punctate staining of LC3 formed after oxidative stress indicated the formation of autophagosomes.
Assay for reactive oxygen species (ROS)
Cells were harvested and incubated in PBS containing 10 μM CM-H2DCFDA (the chloromethyl derivative of 2′,7′-dichlorodihydrofluorescein diacetate; Life Technologies, D-399) for 30 min at 37°C in the dark to allow loading of dye into the cells. This dye is nonfluorescent when chemically reduced, but after cellular oxidation and removal of acetate groups by cellular esterases it becomes fluorescent. The intracellular production of ROS was monitored by flow cytometer with excitation at 480 nm and emission at 530 nm.
Protein carbonyl assay
Protein carbonyl levels in ARPE-19 cells after treatment with H2O2 were measured spectrophotometrically using a commercial kit according to instructions (Cayman Chemical company, 10005020) using a 96-well format. Briefly, ARPE-19 cells grown on 75-cmCitation2 flasks were treated with varying concentrations of H2O2 for indicated time-points and were scraped and collected by centrifugation at 2000 × g for 10 min at 4°C. A bovine serum standard curve was created according to the kit instructions to assess the level of protein samples. The protein content in the samples was calculated based on A280 nm on a NanoDropTM spectrophotometer and carbonyl content was determined in the final pellets [(carbonyl nmol/ml)/ (protein mg/ml)].
Assessment of mitochondrial membrane potential by JC-1 dye
Following incubation of cells on either clear-bottom black 96-well tissue culture plates (BD Biosciences, 354649) or 8-well glass chamber slides (Nunc ®, C7057), cells were loaded with JC-1 dye (5 μg/ml) for 10 min at 37°C. Following incubation, the plates were centrifuged at 400 × g at room temperature and the cells were washed gently, 3 times, in PBS (1×) and fixed in 4% paraformaldehyde solution for 15 min in the dark at room temperature. Dye distribution was analyzed on a Biotek® Fluorescence Microplate Reader. JC-1 aggregates (red) have an excitation/emission spectra of (560/595 nm) and monomer JC-1 has an excitation/emission spectra of (485/535 nm). The fluorescence values of each channel, and each well were recorded and red/green ratio was calculated as an indicator of mitochondrial membrane potential. Red/green ratio values positively correlate with mitochondrial membrane potential. In the case of the chamber slides, they were washed once with PBS (1×) following fixation and immediately mounted on coverslips and photographed on a Zeiss LSM 710 confocal microscope.
Estimation of mitochondrial mass
After respective treatments, ARPE-19 cells were loaded with MitoTracker Green dye (Excitation/Emission: 490/516 nm) at 100 nM final concentration (37°C for 15 min). Cells were washed with PBS and collected after trypsinization with 0.05% trypsin. 10,000 cells per treatment were analyzed using a BD LSR II® flow cytometer for MitoTracker fluorescence intensity.
Glutathione assay
Intracellular GSH:GSSG ratio was measured using a glutathione assay kit (Cayman Chemical Co, 703002) following the manufacturer's guidelines. Briefly, ARPE-19 cells were scraped off the wells after the incubation period, washed in PBS and centrifuged at 1000 × g at 4°C. The pellet fraction was lysed and briefly sonicated followed by deproteination with metaphosphoric acid (Sigma-Aldrich, 239275) and triethanolamine (Sigma Aldrich T58300). Equal volumes from each deproteinated sample was then analyzed for GSH and derivatized by 2-vinylpyridine, and measured for GSSG (Sigma Aldrich, 132292). Results are expressed as the ratio of intracellular GSH:GSSG.
Lentiviral knockdown of BECN1 and ATG7 in ARPE-19 cells
The BECN1 (Open Biosystems, RHS4533-EG8678, clone IDs: TRCN0000033549, TRCN0000033550, TRCN0000033551, TRCN0000033552, TRCN0000033553) and ATG7 (Open Biosystems, RHS4533-EG10533, clone IDs: TRCN0000007585, TRCN0000007586, TRCN0000007587, TRCN0000007588) human lentiviral shRNA constructs were obtained and used according to the manufacturer's instructions. Since these constructs are all in the pLKO.1 puromycin vector (Addgene, 8453), a scrambled sequence with no sequence homology to the mammalian genome cloned into pLKO.1 vector was obtained (Addgene, 1864). Scrambled, BECN1 or ATG7 shRNA-encoding lentiviral vectors were transfected into HEK293T cells together with lentiviral packaging plasmids psPAX2 (Addgene, 12260) and pMD2.G (Addgene 12259), using Lipofectamine 2000, following the manufacturer's instructions (BECN1 Clone 1: TRCN0000033549, TRCN0000033550, TRCN0000033551 and Clone 2: TRCN0000033552, TRCN0000033553; ATG7 Clone 1: TRCN0000007585, TRCN0000007586, and Clone 2: TRCN0000007587, TRCN0000007588). Culture supernatant fraction containing pseudovirus was collected 24, 48, and 72 h after transfection, mixed with polybrene, and filtered to create each viral titer. ARPE-19 cells grown on 25-cm2 flasks were transduced with each viral titer and 48 h later the cells were subjected to 2 μg/ml puromycin-selection medium. A further, 48 h later the clones were further passaged and assessed for protein expression by western blot.
Photoreceptor outer segment isolation
Photoreceptor outer segments (POS) were isolated and purified from light-adapted bovine retinas as previously described.Citation57 Isolated ROS were suspended in culture medium to give a final concentration of 2 × 10⁷ POS/ml.
Analysis of lipofuscin accumulation in cultured RPE cells
Lipofuscin levels in cultured RPE cells were quantified by fluorescence-activated cell sorting (FACS) as described previously.Citation22 Briefly, after treatment RPE cells were harvested and resuspended in PBS at 1 × 10⁵ cells/ml. The mean autofluorescence was measured by FACS, with an excitation at 488 nm and emission at 600 nm. Accumulation was also assessed by fluorescence microscopy.
MTT assay for mitochondrial respiration
The 3-(4, 5-dimethylthiazol-3-yl)-2,5-diphenyl tetrazolium bromide (MTT) assay was used to assess mitochondrial activity. Cells were washed once and then incubated with 0.25 mg/ml MTT in serum-free medium at 37ºC for 3 h. The medium was then removed and dimethylsulfoxide was added to solubilize the produced blue formazan (MTT metabolic product). The density of blue formazan was measured at 570 nm with a reference wavelength at 630 nm using a microplate reader.
Crystal violet cell viability assay
The relative cell number was determined by crystal violet uptake as previously described.Citation58 Cells were washed 3 times in PBS, fixed in 4% paraformaldehyde in PBS and stained in a solution of 0.1% crystal violet (Sigma Aldrich, C-3866), 10% ethanol. After washing 3 times in PBS, the remaining stain was dissolved in 10% acetic acid and absorbance measured with a microplate reader at 540 nm.
Immunohistochemistry
Human and mouse eyes were processed for standard paraffin embedding. Sections of 4-μm thickness from the same retinal region (human central retina outside the macula and mouse nasal quadrant) were cut and air-dried. The sections were deparaffinized/rehydrated in xylene and serial concentrations of ethanol. Antigen unmasking was achieved with Diva (Biocare Medical, DV2004 LX) or Rodent Decloaker (Biocare Medical, RD913), blocked with 5% normal goat serum (Invitrogen, PCN5000) and 1% BSA (Fisher Scientific, 50–176–714) for 1 h at room temperature, and probed with respective primary antibodies overnight at 4°C. After primary incubation, the specimens were washed with PBS and probed with fluorochrome-conjugated secondary antibody (Alexa Fluor 488, Invitrogen, A-11008; Alexa Fluor 594, Invitrogen, A-11005). On completion of washes after secondary incubation, the specimen sections were covered with Vectashield mounting medium with DAPI (Vector Lab, H-1200).
Electron microscopy
Briefly, eyes without lens and cornea were fixed in 2.5% paraformaldehyde (Pierce 28908) and 2.5% glutaraldehyde (Fisher Scientific, BP2547–1) in 0.125 M cacodylate buffer (pH 7.4) (Fisher Scientific, 50–980–232) with 2 mM CaCl2. Upon post-fixing with 2% osmium tetroxide in 0.1 M cacodylate buffer (pH 7.4) and en bloc staining with uranyl acetate (Sigma Aldrich, 73943), the tissue was dehydrated through a graded ethanol series and embedded in PolyBed 812 (Polysciences, 08792–1). Thin sections (60 nm) were examined on a JEOL 100CX transmission electron microscope.
Measurement of autophagic fractional volume
In double-blind experiments, 10 to 12 images of retinal RPEs per eye were taken at 4000× magnification using a JEOL 100CX electron microscope. The negatives were digitally scanned and inverted using an Epson 4990 photo scanner, then visualized using ImageJ software. A scale was set to micrometers and a point grid (0.5 μm2/point) was superimposed over the image. Autophagic vacuoles were identified by their distinct double-membrane ultrastructure, and the number of points overlapping the autophagic vacuoles counted. The data are expressed as a fractional volume by comparing to the number of points that overlapped the RPE cytoplasm (minus nucleus).Citation59-61
Data analysis
The results are expressed as the means ± SEM. Data analysis was performed using Prism 5.0 software (GraphPad Software, San Diego, CA). Data were analyzed using the Student t test, one-way ANOVA for multiple comparisons or the Mann-Whitney U test as appropriate. Differences with P < 0.05 were considered statistically significant.
Disclosure of Potential Conflicts of Interest
No potential conflicts of interest were disclosed.
Funding
This research was supported by NIH grants EY019688 and EY021626 to MEB, EY020825–03 to ASL; EY021721 UF Vision Core; NIH Grants EY019038, P30 EY005722, Edward N & Della L Thome Memorial Foundation Award, and Research to Prevent Blindness, Inc. to CBR and MEB.
References
- Choi AM, Ryter SW, Levine B. Autophagy in human health and disease. N EnglJ Med 2013; 368:1845-6; PMID:23656658; http://dx.doi.org/10.1056/NEJMra1205406
- Sridhar S, Botbol Y, Macian F, Cuervo AM. Autophagy and disease: always two sides to a problem. J Pathol 2012; 226:255-73; PMID:21990109; http://dx.doi.org/10.1002/path.3025
- Cuervo AM, Wong E. Chaperone-mediated autophagy: roles in disease and aging. Cell Res 2014; 24:92-104; PMID:24281265
- Park C, Cuervo AM. Selective autophagy: talking with the UPS. Cell Biochem Biophys 2013; 67:3-13; PMID:23709310; http://dx.doi.org/10.1007/s12013-013-9623-7
- Seo SJ, Krebs MP, Mao H, Jones K, Conners M, Lewin AS. Pathological consequences of long-term mitochondrial oxidative stress in the mouse retinal pigment epithelium. Exp Eye Res 2012; 101:60-71; PMID:22687918; http://dx.doi.org/10.1016/j.exer.2012.05.013
- Lee J, Giordano S, Zhang J. Autophagy, mitochondria and oxidative stress: cross-talk and redox signalling. Biochem J 2012; 441:523-40; PMID:22187934; http://dx.doi.org/10.1042/BJ20111451
- Kaarniranta K, Sinha D, Blasiak J, Kauppinen A, Vereb Z, Salminen A, Boulton ME, Petrovski G. Autophagy and heterophagy dysregulation leads to retinal pigment epithelium dysfunction and development of age-related macular degeneration. Autophagy 2013; 9:973-84; PMID:23590900; http://dx.doi.org/10.4161/auto.24546
- Rami A. Review: autophagy in neurodegeneration: firefighter and/or incendiarist? Neuropathol Appl Neurobiol 2009; 35:449-61; PMID:19555462; http://dx.doi.org/10.1111/j.1365-2990.2009.01034.x
- Wong E, Cuervo AM. Autophagy gone awry in neurodegenerative diseases. Nat Neurosci 2010; 13:805-11; PMID:20581817; http://dx.doi.org/10.1038/nn.2575
- Boulton ME. Aging of the retina and retinal pigment epithelium. In: Holz F, Pauleikhoff D, Spade R, Bird A, eds. Age-Related Macular Degeneration. Berlin, Heidelberg: Springer Verlag, 2011:45-64.
- Jarrett SG, Boulton ME. Consequences of oxidative stress in age-related macular degeneration. Mol Aspects Med 2012; 33:399-417; PMID:22510306; http://dx.doi.org/10.1016/j.mam.2012.03.009
- Karunadharma PP, Nordgaard CL, Olsen TW, Ferrington DA. Mitochondrial DNA damage as a potential mechanism for age-related macular degeneration. Investigat Ophthalmol Visual Sci 2010; 51:5470-9; PMID:20505194; http://dx.doi.org/10.1167/iovs.10-5429
- Kim JY, Zhao H, Martinez J, Doggett TA, Kolesnikov AV, Tang PH, Ablonczy Z, Chan CC, Zhou Z, Green DR, et al. Noncanonical autophagy promotes the visual cycle. Cell 2013; 154:365-76; PMID:23870125; http://dx.doi.org/10.1016/j.cell.2013.06.012
- Mitter SK, Rao HV, Qi X, Cai J, Sugrue A, Dunn WA Jr, Grant MB, Boulton ME. Autophagy in the retina: a potential role in age-related macular degeneration. Adv Exp Med Biol 2012; 723:83-90; PMID:22183319; http://dx.doi.org/10.1007/978-1-4614-0631-0_12
- Ryhanen T, Hyttinen JM, Kopitz J, Rilla K, Kuusisto E, Mannermaa E, Viiri J, Holmberg CI, Immonen I, Meri S, et al. Crosstalk between Hsp70 molecular chaperone, lysosomes and proteasomes in autophagy-mediated proteolysis in human retinal pigment epithelial cells. J Cell Mol Med 2009; 13:3616-31; PMID:19017362; http://dx.doi.org/10.1111/j.1582-4934.2008.00577.x
- Yoon YH, Cho KS, Hwang JJ, Lee SJ, Choi JA, Koh JY. Induction of lysosomal dilatation, arrested autophagy, and cell death by chloroquine in cultured ARPE-19 cells. Invest Ophthalmol Visual Sci 2010; 51:6030-7; PMID:20574031; http://dx.doi.org/10.1167/iovs.10-5278
- Boulton ME. Lipofuscin of the RPE. In: Lois N, Forrester J, eds. Fundus Autofluorescence: Lippincott, Williams and Wilkins, 2009:14-26.
- Wang AL, Boulton ME, Dunn WA Jr, Rao HV, Cai J, Lukas TJ, Neufeld AH. Using LC3 to monitor autophagy flux in the retinal pigment epithelium. Autophagy 2009; 5:1190-3; PMID:19855195; http://dx.doi.org/10.4161/auto.5.8.10087
- Ayala A, Venero JL, Cano J, Machado A. Mitochondrial toxins and neurodegenerative diseases. Front Biosci 2007; 12:986-1007; PMID:17127354; http://dx.doi.org/10.2741/2119
- Dasuri K, Zhang L, Keller JN. Oxidative stress, neurodegeneration, and the balance of protein degradation and protein synthesis. Free Radic Biol Med 2013; 62:170-85; PMID:23000246; http://dx.doi.org/10.1016/j.freeradbiomed.2012.09.016
- Flynn JM, Melov S. SOD2 in mitochondrial dysfunction and neurodegeneration. Free Radic Biol Med 2013; 62:4-12; PMID:23727323; http://dx.doi.org/10.1016/j.freeradbiomed.2013.05.027
- Thampi P, Rao HV, Mitter SK, Cai J, Mao H, Li H, Seo S, Qi X, Lewin AS, Romano C, et al. The 5HT1a receptor agonist 8-Oh DPAT induces protection from lipofuscin accumulation and oxidative stress in the retinal pigment epithelium. PloS One 2012; 7:e34468; PMID:22509307; http://dx.doi.org/10.1371/journal.pone.0034468
- Justilien V, Pang JJ, Renganathan K, Zhan X, Crabb JW, Kim SR, Sparrow JR, Hauswirth WW, Lewin AS. SOD2 knockdown mouse model of early AMD. Invest Ophthalmol Visual Sci 2007; 48:4407-20; PMID:17898259; http://dx.doi.org/10.1167/iovs.07-0432
- Malek G, Johnson LV, Mace BE, Saloupis P, Schmechel DE, Rickman DW, Toth CA, Sullivan PM, Bowes Rickman C. Apolipoprotein E allele-dependent pathogenesis: a model for age-related retinal degeneration. Proc Natl Acad Sci U S A 2005; 102:11900-5; PMID:16079201; http://dx.doi.org/10.1073/pnas.0503015102
- Chen Y, Sawada O, Kohno H, Le YZ, Subauste C, Maeda T, Maeda A. Autophagy protects the retina from light-induced degeneration. J Biol Chem 2013; 288:7506-18; PMID:23341467; http://dx.doi.org/10.1074/jbc.M112.439935
- Suzuki M, Tsujikawa M, Itabe H, Du ZJ, Xie P, Matsumura N, Fu X, Zhang R, Sonoda KH, Egashira K, et al. Chronic photo-oxidative stress and subsequent MCP-1 activation as causative factors for age-related macular degeneration. J Cell Sci 2012; 125:2407-15; PMID:22357958; http://dx.doi.org/10.1242/jcs.097683
- Munemasa Y, Kwong JM, Kim SH, Ahn JH, Caprioli J, Piri N. Thioredoxins 1 and 2 protect retinal ganglion cells from pharmacologically induced oxidative stress, optic nerve transection and ocular hypertension. Adv Exp Med Biol 2010; 664:355-63; PMID:20238036; http://dx.doi.org/10.1007/978-1-4419-1399-9_41
- Chen PM, Gombart ZJ, Chen JW. Chloroquine treatment of ARPE-19 cells leads to lysosome dilation and intracellular lipid accumulation: possible implications of lysosomal dysfunction in macular degeneration. Cell Biosci 2011; 1:10; PMID:21711726; http://dx.doi.org/10.1186/2045-3701-1-10
- Krohne TU, Stratmann NK, Kopitz J, Holz FG. Effects of lipid peroxidation products on lipofuscinogenesis and autophagy in human retinal pigment epithelial cells. Exp Eye Res 2010; 90:465-71; PMID:20059996; http://dx.doi.org/10.1016/j.exer.2009.12.011
- Viiri J, Amadio M, Marchesi N, Hyttinen JM, Kivinen N, Sironen R, Rilla K, Akhtar S, Provenzani A, D'Agostino VG, et al. Autophagy activation clears ELAVL1/HuR-mediated accumulation of SQSTM1/p62 during proteasomal inhibition in human retinal pigment epithelial cells. PloS One 2013; 8:e69563; PMID:23922739; http://dx.doi.org/10.1371/journal.pone.0069563
- Wang AL, Lukas TJ, Yuan M, Du N, Tso MO, Neufeld AH. Autophagy, exosomes and drusen formation in age-related macular degeneration. Autophagy 2009; 5:563-4; PMID:19270489; http://dx.doi.org/10.4161/auto.5.4.8163
- McCray BA, Taylor JP. The role of autophagy in age-related neurodegeneration. Neurosignals 2008; 16:75-84; PMID:18097162; http://dx.doi.org/10.1159/000109761
- Singh R, Cuervo AM. Lipophagy: connecting autophagy and lipid metabolism. Int J Cell Biol 2012; 2012:282041; PMID:22536247; http://dx.doi.org/10.1155/2012/282041
- Singh R, Kaushik S, Wang Y, Xiang Y, Novak I, Komatsu M, Tanaka K, Cuervo AM, Czaja MJ. Autophagy regulates lipid metabolism. Nature 2009; 458:1131-5; PMID:19339967; http://dx.doi.org/10.1038/nature07976
- Lionaki E, Markaki M, Tavernarakis N. Autophagy and ageing: insights from invertebrate model organisms. Ageing Res Rev 2013; 12:413-28; PMID:22634332; http://dx.doi.org/10.1016/j.arr.2012.05.001
- Beatty S, Koh H, Phil M, Henson D, Boulton M. The role of oxidative stress in the pathogenesis of age-related macular degeneration. Sur Ophthalmol 2000; 45:115-34; PMID:11033038; http://dx.doi.org/10.1016/S0039-6257(00)00140-5
- Haque R, Chun E, Howell JC, Sengupta T, Chen D, Kim H. MicroRNA-30b-mediated regulation of catalase expression in human ARPE-19 cells. PloS One 2012; 7:e42542; http://dx.doi.org/10.1371/journal.pone.0042542
- Floor E, Wetzel MG. Increased protein oxidation in human substantia nigra pars compacta in comparison with basal ganglia and prefrontal cortex measured with an improved dinitrophenylhydrazine assay. J Neurochem 1998; 70:268-75; PMID:9422371; http://dx.doi.org/10.1046/j.1471-4159.1998.70010268.x
- Hanus J, Zhang H, Wang Z, Liu Q, Zhou Q, Wang S. Induction of necrotic cell death by oxidative stress in retinal pigment epithelial cells. Cell Death Dis 2013; 4:e965; PMID:24336085; http://dx.doi.org/10.1038/cddis.2013.478
- Kurz T, Karlsson M, Brunk UT, Nilsson SE, Frennesson C. ARPE-19 retinal pigment epithelial cells are highly resistant to oxidative stress and exercise strict control over their lysosomal redox-active iron. Autophagy 2009; 5:494-501; PMID:19223767; http://dx.doi.org/10.4161/auto.5.4.7961
- Garg TK, Chang JY. Oxidative stress causes ERK phosphorylation and cell death in cultured retinal pigment epithelium: prevention of cell death by AG126 and 15-deoxy-delta 12, 14-PGJ2. BMC Ophthalmol 2003; 3:5; PMID:12659653; http://dx.doi.org/10.1186/1471-2415-3-5
- Jarrett SG, Boulton ME. Antioxidant up-regulation and increased nuclear DNA protection play key roles in adaptation to oxidative stress in epithelial cells. Free Radic Biol Med 2005; 38:1382-91; PMID:15855056; http://dx.doi.org/10.1016/j.freeradbiomed.2005.02.003
- Jarrett SG, Boulton ME. Poly(ADP-ribose) polymerase offers protection against oxidative and alkylation damage to the nuclear and mitochondrial genomes of the retinal pigment epithelium. Ophthalmic Res 2007; 39:213-23; PMID:17596754; http://dx.doi.org/10.1159/000104683
- Halliwell B, Clement MV, Long LH. Hydrogen peroxide in the human body. FEBS Lett 2000; 486:10-3; PMID:11108833; http://dx.doi.org/10.1016/S0014-5793(00)02197-9
- Miceli MV, Liles MR, Newsome DA. Evaluation of oxidative processes in human pigment epithelial cells associated with retinal outer segment phagocytosis. Exp Cell Res 1994; 214:242-9; PMID:8082727; http://dx.doi.org/10.1006/excr.1994.1254
- Rodriguez-Muela N, Koga H, Garcia-Ledo L, de la Villa P, de la Rosa EJ, Cuervo AM, Boya P. Balance between autophagic pathways preserves retinal homeostasis. Aging Cell 2013; 12:478-88; PMID:23521856; http://dx.doi.org/10.1111/acel.12072
- Cao Y, Klionsky DJ. Physiological functions of Atg6/Beclin 1: a unique autophagy-related protein. Cell Res 2007; 17:839-49; PMID:17893711; http://dx.doi.org/10.1038/cr.2007.78
- Tanida I, Ueno T, Kominami E. LC3 and Autophagy. Methods Mol Biol 2008; 445:77-88; PMID:18425443; http://dx.doi.org/10.1007/978-1-59745-157-4_4
- He C, Klionsky DJ. Atg9 trafficking in autophagy-related pathways. Autophagy 2007; 3:271-4; PMID:17329962; http://dx.doi.org/10.4161/auto.3912
- Galluzzi L, Morselli E, Vicencio JM, Kepp O, Joza N, Tajeddine N, Kroemer G. Life, death and burial: multifaceted impact of autophagy. Biochemical Soc Trans 2008; 36:786-90; PMID:18793137; http://dx.doi.org/10.1042/BST0360786
- Galluzzi L, Vicencio JM, Kepp O, Tasdemir E, Maiuri MC, Kroemer G. To die or not to die: that is the autophagic question. Curr Mol Med 2008; 8:78-91; PMID:18336289; http://dx.doi.org/10.2174/156652408783769616
- Gozuacik D, Kimchi A. Autophagy and cell death. Curr Top Dev Biol 2007; 78:217-45; PMID:17338918; http://dx.doi.org/10.1016/S0070-2153(06)78006-1
- Wong M. Mammalian target of rapamycin (mTOR) pathways in neurological diseases. Biomed J 2013; 36:40-50; PMID:23644232; http://dx.doi.org/10.4103/2319-4170.110365
- Brunk UT, Terman A. The mitochondrial-lysosomal axis theory of aging: accumulation of damaged mitochondria as a result of imperfect autophagocytosis. Eur J Biochem 2002; 269:1996-2002; PMID:11985575; http://dx.doi.org/10.1046/j.1432-1033.2002.02869.x
- Stroikin Y, Dalen H, Loof S, Terman A. Inhibition of autophagy with 3-methyladenine results in impaired turnover of lysosomes and accumulation of lipofuscin-like material. Eur J Cell Biol 2004; 83:583-90; PMID:15679103; http://dx.doi.org/10.1078/0171-9335-00433
- Boulton ME, Marshall J, Mellerio J. Retinitis pigmentosa: a preliminary report on tissue culture studies of retinal pigment epithelial cells from eight affected human eyes. Exp Eye Res 1983; 37:307-13; PMID:6628578; http://dx.doi.org/10.1016/0014-4835(83)90166-5
- Wassell J, Boulton M. A role for vitamin A in the formation of ocular lipofuscin. Br J Ophthalmol 1997; 81:911-8; PMID:9486037; http://dx.doi.org/10.1136/bjo.81.10.911
- Cai J, Qi X, Kociok N, Skosyrski S, Emilio A, Ruan Q, Han S, Liu L, Chen Z, Bowes Rickman C. beta-Secretase (BACE1) inhibition causes retinal pathology by vascular dysregulation and accumulation of age pigment. EMBO Mol Med 2012; 4:980-91; PMID:22903875; http://dx.doi.org/10.1002/emmm.201101084
- Dunn WA Jr. Studies on the mechanisms of autophagy: formation of the autophagic vacuole. J Cell Biol 1990; 110:1923-33; PMID:2351689; http://dx.doi.org/10.1083/jcb.110.6.1923
- Dunn WA Jr. Studies on the mechanisms of autophagy: maturation of the autophagic vacuole. J Cell Biol 1990; 110:1935-45; PMID:2161853; http://dx.doi.org/10.1083/jcb.110.6.1935
- Weibel ER, Staubli W, Gnagi HR, Hess FA. Correlated morphometric and biochemical studies on the liver cell. I. Morphometric model, stereologic methods, and normal morphometric data for rat liver. J Cell Biol 1969; 42:68-91; PMID:4891915; http://dx.doi.org/10.1083/jcb.42.1.68