
Abstract
Silver nanoparticles (Ag NPs) are cytotoxic to cancer cells and possess excellent potential as an antitumor agent. A variety of nanoparticles have been shown to induce autophagy, a critical cellular degradation process, and the elevated autophagy in most of these situations promotes cell death. Whether Ag NPs can induce autophagy and how it might affect the anticancer activity of Ag NPs has not been reported. Here we show that Ag NPs induced autophagy in cancer cells by activating the PtdIns3K signaling pathway. The autophagy induced by Ag NPs was characterized by enhanced autophagosome formation, normal cargo degradation, and no disruption of lysosomal function. Consistent with these properties, the autophagy induced by Ag NPs promoted cell survival, as inhibition of autophagy by either chemical inhibitors or ATG5 siRNA enhanced Ag NPs-elicited cancer cell killing. We further demonstrated that wortmannin, a widely used inhibitor of autophagy, significantly enhanced the antitumor effect of Ag NPs in the B16 mouse melanoma cell model. Our results revealed a novel biological activity of Ag NPs in inducing cytoprotective autophagy, and inhibition of autophagy may be a useful strategy for improving the efficacy of Ag NPs in anticancer therapy.
Abbreviations:
- ANXA5, annexin A5
- CASP3, caspase 3, apoptosis-related cysteine peptidase
- CTSB, cathepsin B
- DLS, dynamic light scattering
- DMEM, Dulbecco's Modified Eagle's medium
- EGFP-LC3, enhanced green fluorescent protein-tagged LC3
- ICP-MS, inductively coupled plasma-mass spectrometry
- I-MEF, immortalized mouse embryonic fibroblast
- MDC, monodansylcadaverine
- MTOR, mechanistic target of rapamycin
- P-MEF, primary mouse embryonic fibroblast
- PI, propidium iodide
- PI3K, phosphoinositide 3-kinase
- PtdIns3K, phosphatidylinositol 3-kinase
- PVP, polyvinylpyrrolidone
- RPS6KB, ribosomal protein S6 kinase, 70 kDa
- s.c., subcutaneously
- SQSTM1, sequestosome 1
- TEM, transmission electron microscopy
- TUNEL, terminal deoxyribonucleotidyl transferase (TDT)-mediated dUTP-digoxigenin nick end labeling
- UV-Vis, ultraviolet visible
- XRD, X-ray diffraction
Introduction
Autophagy is a basic catabolic mechanism for cells to eliminate unnecessary or dysfunctional cellular components and plays vital physiological and pathological roles in essentially all mammalian cells.Citation1,2 During autophagy, a portion of cytoplasmic constituents, such as long-lived proteins and damaged organelles, are enclosed to form double-membrane vesicles named autophagosomes. These autophagosomes subsequently fuse with lysosomes to form autolysosomes, leading to the degradation of the engulfed contents by lysosomal enzymes.Citation3 Many physical, chemical, and biological factors such as starvation, irradiation, and chemotherapeutic treatment are known to induce autophagy. With unique physicochemical properties, nanomaterials are emerging as a new class of autophagy inducers in recent years.Citation4 A variety of engineered nanomaterials, such as quantum dots,Citation5 fullerene C60 and its derivatives,Citation6,7 gold and iron core-gold shell nanoparticle,Citation8,9 graphene,Citation10 iron oxide,Citation11 MnO nanocrystals,Citation12 rare earth nanocrystals,Citation13-16 VO2 nanocrystals,Citation17 Ni-Co alloy nanocrystal,Citation18 europium hydroxide nanorodsCitation19 etc., elicit an autophagic response in the various cancer cell culture systems examined. An elevated level of autophagy during tumor development and in cancer therapy has paradoxically been reported to have roles in promoting both cell survival and cell death.Citation20-23 On the one hand, as an energy reserve, autophagy helps cancer cells to tolerate stress including starvation and probably some forms of therapy, and thus may play a role in anticancer drug resistance. On the other hand, prolonged stress and overstimulated autophagy can eventually lead to cancer cell death, and thus promote tumor suppression. Similar paradoxical situation is seen with autophagy induced by nanomaterials. In most of the circumstances, elevated autophagy after nanomaterial treatment leads to increased cell death.Citation6,7,9,12,15,18 But in rare situations, nanomaterial-induced autophagy may also promote cell survival.Citation17
Scheme 1. Schematic illustration of the theory that Ag NPs induced cytoprotective autophagy and that inhibition of autophagy enhanced the antitumor efficacy of Ag NPs.
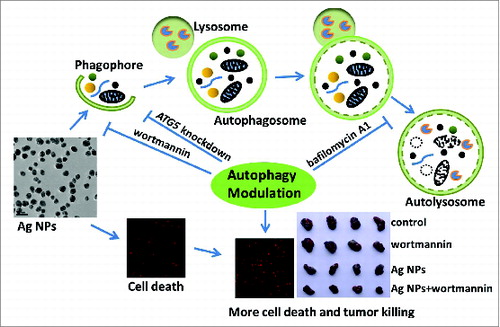
Silver nanoparticles (Ag NPs) exhibit a variety of biological effects, such as antibacterial,Citation24,25 antifungal,Citation26,27 antiviral,Citation28-30 and antiinflammatory,Citation31,32 and thus are attracting interest for a wide range of biomedical applications. Recent studies have also shown that Ag NPs possess excellent potential as an anticancer agent. Numerous reports have documented the remarkable ability of Ag NPs to elicit cytotoxicity in cancer cells, through the various mechanisms involving oxidative stress, DNA damage, cell cycle arrest, apoptosis, or necrosis.Citation33-38 Ag NPs are also potent sensitizers for cancer chemotherapyCitation39 and radiotherapy,Citation40,41 and show significant antitumor activity in several animal models.Citation42-44 However, whether Ag NPs can induce autophagy and how this might affect the anticancer activity of Ag NPs have not been reported. In this report, we showed for the first time that Ag NPs effectively induced cytoprotective autophagy, and that inhibition of autophagy significantly promoted the antitumor activity of Ag NPs, as illustrated in Scheme 1.
Results
Synthesis and characterization of silver nanoparticles
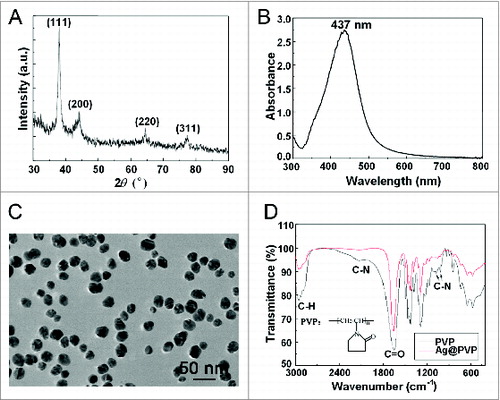
To synthesize silver nanoparticles (Ag NPs), we used polyvinylpyrrolidone (PVP) K30 as the protecting agent to prevent nanoparticle aggregation, without silver salts or any reducing agent. X-ray diffraction (XRD) peaks of obtained nanoparticles were consistent with the standard XRD peaks of silver (PDF #04-0783) (), while the UV visible (UV-Vis) spectrum revealed an absorption peak at about 437 nm, which belonged to the typical surface plasmon resonance absorption band of Ag NPs (). These results confirmed the purity of as-synthesized Ag NPs. Transmission electron microscopy (TEM) revealed well-dispersed particles with an average size of 26.5 ± 8.4 nm for Ag NPs (, with the quantitative data shown in Fig. S1), while dynamic light scattering (DLS) analysis showed a larger size of 58.8 ± 1.7 nm (with a polydispersity index of 0.29 ± 0.04) in deionized water (Fig. S2), likely due to the thickness of the hydration shell. The zeta potential of Ag NPs in deionized water was -12.9±1.1 mV. Fourier transform infrared spectra of PVP-coated Ag NPs revealed weakened intensity of C-N but not C = O absorption peaks (), indicating the coordination of N atom of PVP with Ag NPs, a result consistent with previous reports.Citation45,46
Figure 1. Characterization of Ag NPs. (A) XRD pattern of Ag NPs. (B) UV-Vis spectrum of Ag NPs. (C) TEM image of Ag NPs. Scale bar: 50 nm. (D) Fourier transform infrared spectra of PVP and Ag@PVP.
Ag NPs induce autophagosome accumulation
We routinely used HeLa EGFP-LC3, a human cell line that stably expressed enhanced green fluorescent protein-tagged LC3 (EGFP-LC3), to detect autophagy. EGFP-LC3 was evenly distributed in the untreated cells, but upon rapamycin or Ag NPs treatment appeared as bright punctate dots under fluorescence microscopy (), as a result of EGFP-LC3 conjugation to autophagosomes.Citation47 EGFP-LC3 dot formation induced by Ag NPs was both time- and dose-dependent, with the maximal effect observed at 12 h for 10 μg/mL Ag NPs (). These EGFP-LC3 dots colocalized with the staining patterns of monodansylcadaverine, a dye that stains acidic vesicles, and those of LysoTracker Red, a selective dye for staining lysosomes (). Consistent with the increased EGFP-LC3 dot formation, the level of LC3-II, representing the endogenous LC3 protein that became attached to autophagosome membranes upon autophagy, was significantly elevated after Ag NPs treatment (). Finally, TEM revealed many more autophagosomes in the HeLa cells treated with Ag NPs than in the untreated cells (, left panel), and a higher magnification image clearly showed the presence of autophagic vacuoles containing partially degraded cytoplasmic material and exhibiting increased electron density (, right panel). In the TEM images of Ag NPs treated cells, we also frequently observed vesicles that contained nanoparticle aggregates, indicating that Ag NPs were taken up into cells (). Collectively, these results demonstrated that Ag NPs induced autophagosome accumulation.
Figure 2. Ag NPs induce autophagosome accumulation. (A) Fluorescence microscopy images of HeLa EGFP-LC3 cells treated with PBS (control), 200 nM rapamycin (Rap) and 10 μg/mL Ag NPs for 4 h. Scale bar: 10 μm. (B) Time course of EGFP-LC3 dot formation in HeLa EGFP-LC3 cells treated with 10 μg/mL Ag NPs. Mean ± SEM, n = 3. (C) Dose-dependent EGFP-LC3 dot formation in HeLa EGFP-LC3 cells treated with Ag NPs for 8 h and 12 h. Mean ± SEM, n = 3. (D) Fluorescent colocalization between EGFP-LC3 dots and other autophagy-related markers: monodansylcadaverine (MDC) and LysoTracker Red (LT) in HeLa EGFP-LC3 cells treated with 10 μg/mL Ag NPs for 4 h. The right panel is a high magnification image of the indicated portion. Scale bar: 20 μm.
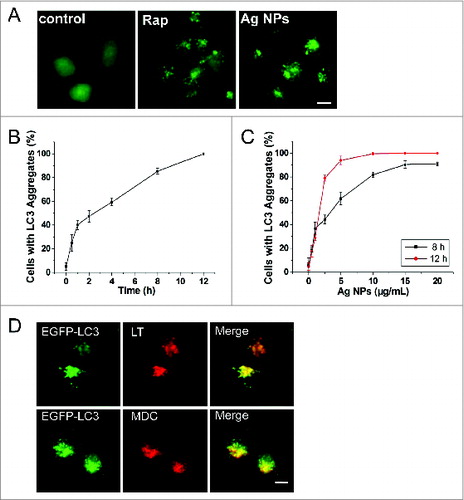
Figure 3. Additional autophagic features induced by Ag NPs. (A) Hela cells were treated with various doses of Ag NPs for 24 h and then subjected to western blotting with anti-LC3 antibody and anti-GAPDH antibody, whose detection served as loading control. (B) TEM of HeLa cells treated with PBS (control) or 10 μg/mL Ag NPs for 24 h. The right panel is a high magnification image of the indicated portion. Arrows indicate autophagosomes and autolysosomes. (C) Bio-TEM images of HeLa cells treated with 20 μg/mL Ag NPs for 24 h. The internalized Ag NPs were indicated by black dashed line. N, nuclei.
Ag NPs induced autophagy by enhancing autophagosome formation with no disruption of lysosomal function
Enhanced autophagosome accumulation could result from either increased autophagosome formation (genuine autophagy induction) or decreased autophagosome turnover (autophagic block). To determine which was the case for Ag NPs, we measured LC3-II turnover in the presence and absence of bafilomycin A1, an inhibitor of autolysosome degradation. Ag NPs treatment led to an increase, and bafilomycin A1 caused a further increase, in the relative level of LC3-II, indicative of normal cargo degradation for the autophagy induced by Ag NPs (). Chloroquine, which blocks autophagic degradation by inhibiting vacuolar H+ ATPase activity, also further enhanced LC3-II accumulation in the cells treated with Ag NPs, as compared to the cells treated with chloroquine or Ag NPs only (). These results suggested that Ag NPs promoted autophagosome synthesis but did not preclude a possibility that degradation of autophagosomal substrates could be blocked downstream. To shed more light on this, we performed autophagic flux assays. A dose-dependent increase in the level of free EGFP, in parallel to the dose-dependent increase in EGFP-LC3-II conversion, was observed in the HeLa EGFP-LC3 cells treated with varying concentrations (2 to 20 μg/mL) of Ag NPs (), indicating normal EGFP-LC3 degradation in the autolysosomes. We also measured the level of SQSTM1/p62 (sequestosome 1), a protein substrate that is selectively incorporated into the forming autophagosome and degraded by autophagy. We found that Ag NPs treatment led to a decrease in the level of SQSTM1, similar to starvation treatment (). Taken together, the above results strongly suggested that the autophagy induced by Ag NPs was through increased autophagosome formation and not autophagosome turnover.
Figure 4. Ag NPs induced autophagy by enhancing autophagosome formation. (A) HeLa cells were treated with 20 ug/mL Ag NPs for 24 h in the presence or absence of bafilomycin A1 (BFA). Endogenous LC3-II levels were detected by protein gel blotting with anti-LC3 antibodies and quantified by densitometric analysis relative to GAPDH. Mean ± SEM, n = 3. *P <0.05, ***P < 0.001. (B) HeLa cells were treated with 20 ug/mL Ag NPs for 24 h in the presence or absence of chloroquine (CQ). Endogenous LC3-II levels were detected by western blotting with anti-LC3 antibodies and quantified by densitometric analysis relative to GAPDH. Mean ± SEM, n = 3. *P <0.05, ***P < 0.001. (C) Western blotting of EGFP and GAPDH (served as loading control) in HeLa EGFP-LC3 cells treated with different concentrations of Ag NPs for 24 h. (D) HeLa cells were treated with 10 ug/mL Ag NPs for 1 h or HBSS (starvation) for 2 h. Endogenous SQSTM1 levels were detected by protein gel blotting with anti-SQSTM1 antibodies and quantified by densitometric analysis relative to GAPDH. Mean ± SEM, n = 3. ***P < 0.001.
A number of inorganic nanoparticles, including gold nanoparticlesCitation8 and water-soluble polyalkylsulfonated C60,Citation48 have been reported to disrupt lysosomal function and impair lysosomal degradation capacity. We thus examined whether Ag NPs could do the same. We first assessed the acidity of lysosomes, as an acidic environment is essential for lysosomes to perform their functions. While gold nanoparticles reportedly led to alkalization of lysosomes in the treated cells,Citation8 we observed the opposite effect with Ag NPs, namely an increase in lysosomal acidity, as revealed by fluorescence imaging (Fig. S3A) and flow cytometry analysis (Fig. S3B) with LysoSensor Green DND-189, an acidotropic dye that accumulates in acidic organelles and exhibits a fluorescence intensity proportional to acidity. Furthermore, the activity of CTSB (cathepsin B), a lysosomal peptidase, as measured by the cleavage of the Magic red CTSB substrate, was significantly enhanced in the HeLa cells treated with Ag NPs (Fig. S3C and D). These data indicated that Ag NPs did not disrupt lysosomal function, consistent with the autophagic flux assay results described above.
Ag NPs induced autophagy in a PtdIns3K-dependent and MTOR-independent fashion
Wortmannin, a widely used autophagy inhibitor that blocks the formation of autophagosomes through inhibition of the class III phosphatidylinositol 3-kinase (PtdIns3K) pathway, significantly inhibited Ag NPs-induced LC3-II conversion (), strongly suggesting that Ag NPs induced autophagy by enhancing autophagosome formation through the PtdIns3K pathway. As wortmannin targets both class I phosphoinositide 3-kinase (PI3K) and class III PtdIns3K indiscriminately, we tested the possible effect of wortmannin on class I PI3K-AKT signaling. In contrast to the class III PtdIns3K as a positive regulator of autophagy, class I PI3K-AKT signaling has an opposing effect on the initiation of autophagy. The result confirmed that wortmannin, at the concentration we used, had no effect on the activity of class I PI3K-AKT signaling (). Furthermore, Ag NPs did not alter the phosphorylation level of the mechanistic target of rapamycin (MTOR) and its substrate RPS6KB (ribosomal protein S6 kinase, 70 kDa), in contrast to rapamycin, a well-known MTOR inhibitor and autophagy inducer that significantly reduced the phosphorylation level of both MTOR and RPS6KB (). Thus, Ag NPs induced autophagy in a PtdIns3K-dependent and MTOR-independent fashion.
Figure 5. Ag NPs induced autophagy in a PtdIns3K-dependent and MTOR-independent fashion. (A) Western blotting of LC3 in HeLa cells treated with PBS (control) or 10 μg/mL Ag NPs for 24 h in the presence or absence of 1 μM wortmannin (Wort). (B) HeLa cells treated with PBS (control) or 1 μM wortmanin for 24 h and analyzed by AKT and phospho-AKT western blotting. (C) HeLa cells treated with PBS (control), 200 nM rapamycin (Rap) or 10 μg/mL Ag NPs for 24 h, were analyzed for MTOR activity by protein gel blotting for levels of total (T) and phosphor (P)-MTOR and RPS6KB.
Ag NPs elicited significant cytotoxicity that was not likely due to released silver ions
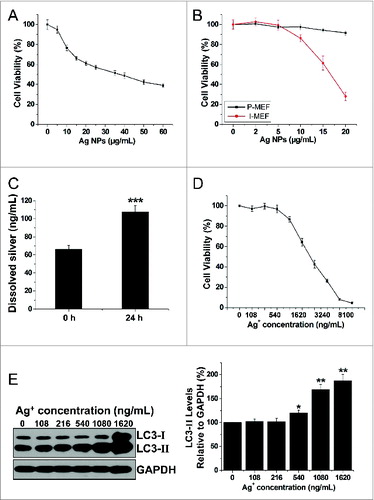
Numerous publications have documented significant cytotoxicity of Ag NPs in a variety of cancer cell lines. In agreement with these, we found that Ag NPs reduced HeLa cell viability in a dose-dependent manner, and the half inhibitory concentration (IC50) of Ag NPs was 39.25 μg/mL (). To assess whether the cytotoxicity of Ag NPs may exhibit cell preference, we compared the Ag NPs-elicited cytotoxicity in primary mouse embryonic fibroblast (P-MEF) and the immortalized mouse embryonic fibroblast (I-MEF) cells, with the latter cell type closely resembling cancer cells. Ag NPs exhibited significantly higher cytotoxicity toward I-MEF cells (). Notably, after treatment with 20 μg/mL of Ag NPs for 24 h, I-MEF viability was reduced to 28.03%, but the viability of P-MEF remained at 91.56%. As it has been suggested that the toxicity of silver nanoparticles may be partly attributed to the release of silver ions,Citation49 we thus measured silver ion release in water using a standard filter assay. The concentration of free silver ions increased from 66.65 ng/mL to 107.53 ng/mL in 10 μg/mL Ag NPs water solution after 24 h incubation at 37°C (). This level of silver ions was apparently nontoxic to HeLa cells, as the IC50 of silver ions to HeLa cells was 1.96 μg/mL, and silver ions at concentrations up to 540 ng/mL, roughly 5 times the level of silver ions released from Ag NPs, had minimal effect on HeLa cell viability (). Furthermore, silver ions at a concentration of 216 ng/mL (2 times the level of silver ions released from Ag NPs) failed to elicit an autophagic enhancement. Marginal autophagy enhancement was observed at a silver ion concentration of 540 ng/mL, while silver ion concentrations of 1.08 μg/mL (10 times the level of silver ions released from Ag NPs) was needed to elicit significant autophagy induction (). In addition, we measured the cytosolic concentration of silver (Fig. S4), which most likely represented silver in the ion form since the high-speed centrifugation we used to obtain the cytosolic extract effectively precipitated any residual Ag NPs that might have internalized into the cytoplasm. We found that the cytosolic silver concentration (28.76 ng/106 cells) in the cells treated with 10 μg/mL Ag NPs, which induced strong autophagy, was less than the cytosolic silver concentration (45.38 ng/106 cells) in the cells treated with 540 ng/mL Ag+, which elicited a minimal autophagic response. We conclude from the above studies that the cytotoxicity of Ag NPs was unlikely due to released silver ions.
Figure 6. Ag NPs elicited significant cytotoxicity that was not likely due to released silver ions. (A) MTT cytotoxicity assay of HeLa cells exposed to varying concentrations of Ag NPs for 24 h. Mean ± SEM, n = 5. (B) MTT cytotoxicity assay of P-MEF and I-MEF cells exposed to varying concentrations of Ag NPs for 24 h. Mean ± SEM, n = 5. (C) ICP-MS assay of the free silver ions (Ag+) released from Ag NPs (10 μg/mL) in deionized water for 0 h or 24 h incubation. Mean ± SEM, n = 3. ***P < 0.001 comparing to the starting (0 h) measurement. (D) MTT cytotoxicity assay of HeLa cells exposed to varying concentrations of Ag+ for 24 h. Mean ± SEM, n = 5. (E) HeLa cells exposed to varying concentrations of Ag+ for 24 h. Endogenous LC3-II levels were detected by western blotting with anti-LC3 antibodies and quantified by densitometric analysis relative to GAPDH. Mean ± SEM, n = 3, *P < 0.05, **P < 0.01, compared to the group without Ag+.
Inhibition of autophagy enhanced cytotoxicity of Ag NPs in HeLa cells
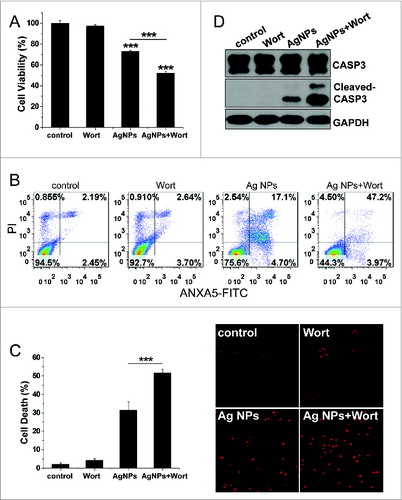
To evaluate the role of autophagy in the cytotoxicity elicited by Ag NPs, we employed different autophagy inhibitors. Cotreatment with wortmannin, which significantly inhibited Ag NPs-induced autophagy (), led to a 20.91% further decrease in HeLa cell viability as compared to HeLa cell treated with Ag NPs alone (). Wortmannin also led to a 29.37% increase in cell death (the relative percentage of cells in the lower-right and the upper-right quadrants combined, which included both early apoptotic and late apoptotic/necrotic cells) caused by the 24 h treatment of Ag NPs, as assessed by annexin A5 (ANXA5)-FITC staining (). A different assay, using Hoechst/PtdIns staining to directly visualize dead cells, showed that wortmannin enhanced Ag NPs-induced HeLa cell death by 20.18% (). Wortmannin alone at the concentration used had no effect on either the viability or the cell death. Wortmannin also enhanced Ag NPs-elicited caspase 3 (CASP3) cleavage, another indicator for activation of apoptosis, while wortmannin itself had no effect on this cleavage (). Similarly, cotreatment of Ag NPs with bafilomycin A1, a blocker of the autophagic flux, also elicited a 25.01% decrease in cell viability (Fig. S5A), a 31.28% increase in apoptotic cell death and necrotic cell death under the ANXA5-FITC PI assay (Fig. S5B) and a 20.58% increase in cell death under the Hoechst/PtdIns assay (Fig. S5C), as compared to Ag NPs treatment alone.
Figure 7. Inhibition of autophagy by wortmannin enhanced cytotoxicity of Ag NPs in HeLa cells. (A) Cell viability of HeLa cells treated with PBS (control) or 10 μg/mL Ag NPs for 24 h together with 1 μM wortmannin or not. Mean ± SEM, n = 5. ***P < 0.001 comparing to the control group. (B) ANXA5-FITC PtdIns assay of HeLa cells treated as (A) for 24 h. Shown were the relative percentage of live (lower-left quadrant), early apoptotic (lower-right quadrant), and late apoptotic and necrotic (upper-right quadrant) cells. (C) Representative fluorescence pictures (the right panel) and the cell death rate of HeLa cells treated with PBS (control) or 10 μg/mL Ag NPs for 20 h in the presence or absence of wortmannin. Cell death was assessed by Hoechst 33342 PI staining and expressed as the percentage of PtdIns-stained cells. Mean ± SEM, n = 3. ***P < 0.001. (D) Western blotting of CASP3 in HeLa cells treated with PBS (control) or 10 μg/mL Ag NPs for 24 h in the presence or absence of wortmannin.
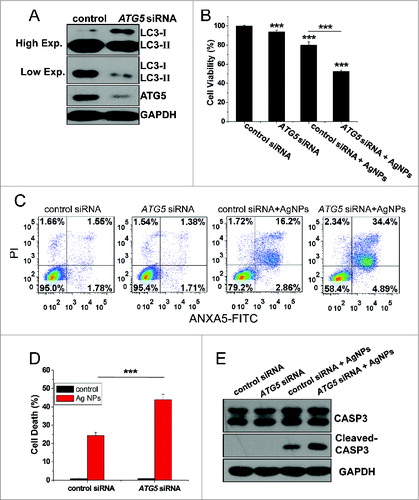
To gain further proof for the role of autophagy in Ag NPs-elicited cell death, we assessed the function of ATG5, an autophagy-essential gene, in this process. Transfection with ATG5-specific siRNA, which led to an effective knockdown of ATG5 protein expression, led to the expected decrease in autophagy level, as shown by reduced LC3-II conversion (). Compared to cells transfected with the control siRNA, HeLa cells transfected with ATG5-specific siRNA exhibited a 27.41% decrease in cell viability (), a 20.23% increase in apoptotic and necrotic cell death as measured by the ANXA5-FITC PI assay (), and a 19.64% increase in cell death as measured by the Hoechst PtdIns assay (, with the representative fluorescence pictures shown in Fig. S6), after 24 h treatment with Ag NPs. Consistent with the ANXA5-FITC staining data, Ag NPs also caused more CASP3 cleavage in ATG5 siRNA treated cells than in control siRNA-treated cells ().
Figure 8. Inhibition of autophagy by ATG5 siRNA treatment enhanced cytotoxicity of Ag NPs in HeLa cells. (A) Western blotting of LC3 and ATG5 in HeLa cells transfected with ATG5 siRNA or control siRNA for 48 h. (B) Cell viability of HeLa cells treated with 10 μg/mL Ag NPs for 24 h after transfection with ATG5 siRNA or control siRNA for 48 h. Mean ± SEM, n = 5. ***P < 0.001 comparing to the control siRNA group. (C) ANXA5-FITC PI assay of HeLa cells treated with 10 μg/mL Ag NPs for 24 h after transfection with ATG5 siRNA or control siRNA for 48 h. (D) Cell death rate of HeLa cells treated with PBS (control) or 10 μg/mL Ag NPs for 20 h after transfection with ATG5 siRNA or control siRNA for 48 h. Mean ± SEM, n = 3. ***P < 0.001. (E) Western blotting of CASP3 and cleaved-CASP3 in HeLa cells treated with 10 μg/mL Ag NPs for 24 h after transfection with ATG5 siRNA or control siRNA for 48 h.
Taken together, the above results demonstrated that the autophagy induced by Ag NPs played a protective role on the cell fate, and inhibition of autophagy by either the chemical inhibitors or ATG5 knockdown enhanced cytotoxicity of Ag NPs in these cells.
Inhibition of autophagy enhanced the antitumor efficacy of Ag NPs in a mouse model
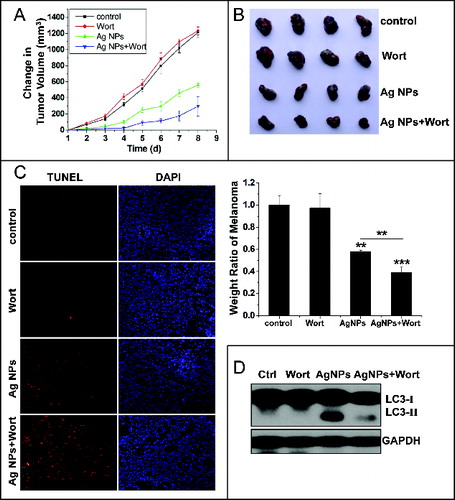
The significant enhancement in cytotoxicity of Ag NPs toward HeLa cells by autophagy inhibitors suggested that autophagy inhibition may enhance the antitumor efficacy of Ag NPs. We assessed this possibility in a mouse cell model using B16 melanoma cells. We first verified that Ag NPs induced autophagy in these cancer cells. TEM revealed many more autophagosomes in the B16 cells treated with Ag NPs than in the untreated cells (). In addition, the autophagic inhibitor wortmannin effectively inhibited autophagy induced by Ag NPs in these cells, as shown by the reduced endogenous LC3 conversion (). Similar to the results obtained in HeLa cells, the autophagy induced by Ag NPs in B16 melanoma cells was cytoprotective in nature, as wortmannin decreased cell viability in Ag NPs treated cells by 28.54% () and enhanced Ag NPs-elicited cell killing by 23.66% (the relative percentage of cells in the lower-right and upper-right quadrants combined) (), both statistically significant. We then established the tumor model by subcutaneously (s.c.) injecting the B16 cells in the right flank of the C57BL/6 mice. From the fifth d post-cancer cell inoculation, the different groups of tumor-bearing mice received once-daily treatments with saline, wortmannin alone, Ag NPs alone or wortmannin plus Ag NPs. A day-to-day measure in tumor size clearly showed an effective inhibition of tumor growth by Ag NPs treatment, and wortmannin enhanced Ag NPs-elicited a tumor-shrinking effect. Wortmannin alone at the concentration used had no effect on tumor killing (). After 8 d of treatment, all mice were sacrificed, and the stripped subcutaneous melanoma tumors were photographed and weighed (, upper panel). While wortmannin treatment alone had no significant effect, Ag NPs treatment alone resulted in a 42.10% decrease in tumor weight. Notably, cotreatment with wortmannin led to a 60.91% decrease in tumor weight, representing a statistically significant 18.81% enhancement in the antitumor efficacy of Ag NPs (, lower panel). Consistent with the tumor weight data, the terminal deoxyribonucleotidyl transferase (TDT)-mediated dUTP-digoxigenin nick end labeling (TUNEL) assay revealed many more apoptotic cells in the tumor treated with Ag NPs plus wortmannin than in the tumor treated with Ag NPs alone, while few of the apoptotic cells were observed in the untreated tumor or the tumor treated with wortmannin alone (). No significant cell death was observed in the endothelium adjacent to the tumor (Fig. S7), and mice in the various groups exhibited no significant change in weight (Fig. S8). In addition, the level of autophagy in the tumor tissue was significantly elevated after Ag NPs treatment, and this elevated autophagy was effectively inhibited by the in vivo administration of wortmannin ().
Figure 9. Autophagy-inducing ability and synergetic killing effect of Ag NPs with wortmannin in B16 cells. (A) TEM of B16 cells treated with PBS (control) or 50 μg/mL Ag NPs for 24 h. The right panel is a high magnification image of the indicated portion. Arrows indicate autophagosomes and autolysosomes. (B) Western blotting of LC3 in B16 cells treated with PBS (control) or 50 μg/mL Ag NPs for 24 h in the presence or absence of 1 μM wortmannin. (C) MTT assay of B16 cells treated with PBS (control) or 50 μg/mL Ag NPs for 24 h in the presence or absence of 1 μM wortmannin. Mean±SEM, n = 5. ***P < 0.001 comparing to the control group. (D) ANXA5-FITC PtdIns assay of B16 cells treated as in (C) for 24 h. Shown are the relative percentages of live (lower-left quadrant), early apoptotic (lower-right quadrant), and late apoptotic and necrotic (upper-right quadrant) cells.
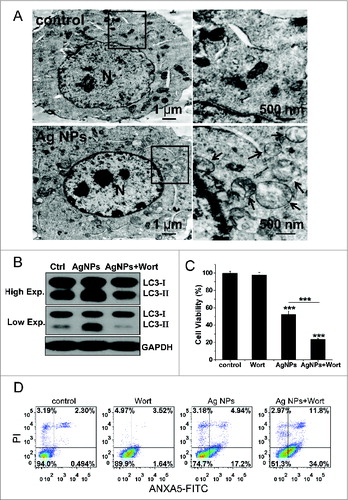
Figure 10. Inhibition of autophagy enhanced the antitumor effect of Ag NPs in a mouse model. (A and B) Synergetic tumor-shrinking effect of wortmannin and Ag NPs in mice with melanoma. The change of tumor volume (A) and weight ratio of tumor tissues (B) from C57BL/6 mice treated with normal saline (control), 25 nmol/kg wortmannin(s.c.), 1.5 mg/kg Ag NPs (s.c.), 1.5 mg/kg Ag NPs plus 25 nmol/kg wortmannin. Mean ± SEM, n = 4. **P <0.01, ***P < 0.001 comparing to the control group. (C) TUNEL staining (red) of sections from tumor in (B) was performed to show apoptotic cells. Nuclei were stained with DAPI (blue). (D) Western blotting of LC3 was performed to show autophagy level of B16 melanoma treated with saline, wortmannin, Ag NPs or Ag NPs plus wortmannin.
Discussion
In this study, we provided a comprehensive line of evidence, including EGFP-LC3 dot formation, LC3 form conversion, autophagy marker dye staining, and direct visualization of autophagosomes by TEM, to demonstrate that Ag NPs induced autophagy. The autophagy induced by Ag NPs exhibited normal lysosomal function and normal cargo degradation, strongly suggesting that the observed autophagosome accumulation was due to enhanced autophagosome formation but not decreased autophagosome turnover. In stark contrast, alkalization of lysosomal pH, disruption of lysosomal function and blocked cargo degradation are reported for autophagy induced by gold nanoparticles.Citation8 Why and how these 2 inorganic nanoparticles elicit the completely different effects on lysosomal and autophagic processes remains to be determined.
Another interesting and potentially useful finding from the current study is that the autophagy induced by Ag NPs plays a protective role on cancer cell survival. This put Ag NPs in the minority group of inorganic nanoparticles, as previously mentioned, while the predominant majority of inorganic nanoparticles with autophagy-inducing ability elicit death-promoting autophagy. Thus, inhibition of autophagy, either by chemical inhibitors or by knockdown of the autophagy-essential gene ATG5, significantly enhanced the cytotoxic effect of Ag NPs in cancer cells. Interestingly, Ag NPs exhibited higher capacity to kill cancerous rather than normal cells, raising the possibility of using autophagy inhibitors to enhance the antitumor efficacy of Ag NPs. Indeed, wortmannin, one of the most commonly-used autophagy inhibitor, effectively enhanced tumor-shrinking effect of Ag NPs in our B16 melanoma mouse model. In summary, our results revealed a novel biological activity of Ag NPs in inducing cytoprotective autophagy, and inhibition of autophagy may be a useful strategy for improving the efficacy of Ag NPs in anticancer therapy.
Materials and Methods
Antibodies and materials
Ultrapure water (pH 6.7; Milli-Q, Bedford, MA, USA) was used in all situations throughout the experiments. Bafilomycin A1 (B1793), chloroquine (C6628) were purchased from Sigma. Anti-LC3 antibody (NB100-2220, 1:2000 dilution) was purchased from Novus Biologicals. Anti-SQSTM1/p62 antibody (ab56416, 1:2000 dilution) was purchased from Abcam. The polyclonal anti-MTOR antibody (2972, 1:1000 dilution), anti-phospho-MTOR antibody (2971, used at 1:1000 dilution), antibody against cleaved CASP3 (anti-cleaved caspase-3, 9664, 1:1000 dilution), antibody against RS6KB (anti-p70 S6 Kinase, 9202, used at 1:1000 dilution) and antibody against the phosphorylated form of RS6KB (anti-phospho-p70 S6 Kinase, 9205, used at 1:1000 dilution) were purchased from Cell Signaling Technology. Anti-phospho-AKT antibody (2214-1, 1:500 dilution) was purchased from epitomics. Antibody against CASP3 (anti-caspase-3 antibody, 19677-1-AP, 1:1000 dilution) was purchased from Proteintech Group, Inc. Anti-GFP antibody (sc-101536, 1:5000 dilution), anti-AKT antibody (sc-8312, 1:10,000 dilution) and anti-ATG5 antibody (sc-133158, 1:500 dilution), were from Santa Cruz Biotechnology, and anti-GAPDH antibodies (AB9132, 1:10,000 dilution) were from Chemicon. HRP-conjugated anti-rabbit antibody (W4011), HRP-conjugated anti-goat antibody (V805A) and HRP-conjugated anti-mouse antibody (W4021) were purchased from Promega. Wortmannin (S1952) was purchased from Shanghai Beyotime Company.
Synthesis of Ag NPs
Silver nanoparticles were synthesized by the electrochemical method based on continuous flow technic as followed: firstly, the silver electrodes were polished and washed, and then fitted on the airtight container's cover. Subsequently, the 5 mg/ml PVP K30 (30154484, Sinopharm Chemical Reagent Co., Ltd) solution was injected into the container continuously by a syringe at the flow rate of 100 ml/h. Finally, the collected colloidal silver solution was purified with 0.22 μm filter membrane. The reaction temperature was 90°C and the electrolytic voltage was 15 V. During the reaction, the polarity direction of the electrodes was alternately changed every 1 min.
Characterization of Ag NPs
The colloidal solution was dried at the glass slide and then analyzed with X’TRA Powder X-ray Diffraction instrument (ARL, Ecublens, Switzerland) with CuKα radiation (λ = 0.154056 nm). The scanning angle ranged from 30° to 90° of 2θ, Steps were 0.02° of 2θ. UV-Vis absorption spectrum of the nanoparticles was measured with a UV-Vis spectrophotometer (UV-3600, Shimadzu, Kyoto, Japan) from 800 nm to 300 nm. For UV-Vis measurement, the dispersing media was deionized water and the concentration of Ag NPs was 30 μg/mL. The morphology of the nanoparticles was characterized by JEM-2000EX Transmission Electron Microscope (JEOL, Tokyo, Japan) and the size distribution was determined by counting all the nanoparticles in TEM photograph. Deionized water conducted as diapering media of Ag NPs. The sample was dropped on the carbon film of the copper grid, dried at room temperature and viewed without staining. For natural size of Ag NPs, over 800 particles were counted and measured to determine the mean sizes, standard deviations, and size distributions. Dynamic light scattering (DLS) and zeta potential were measured at room temperature using the Malvern Zetasizer Nano (Malvern Instrument Ltd., Worcestershire, UK). For DLS measurement, the dispersing media was deionized water and the concentration of Ag NPs was 30 μg/mL. The infrared spectra were recorded in the transmission mode from 4000 cm−1-400 cm−1 with NICOLET 5700 FT-IR spectrophotometer (Thermo Fisher Scientific, Waltham, MA, USA).
Silver ion release assay
To measure free silver ions released from Ag NPs in water, Ag NPs suspension was diluted with deionized water to 10 μg/mL and incubated in the 37°C CO2 incubator for 24 h. The suspension was then centrifuged for 40 min at 150,000× g (Optima L-100 XP, Beckman Coulter Inc.., Miami, FL, USA) to remove most of the Ag NPs. The resulting supernatant was filtered through an Amicon filter (Amicon Ultra-15 3K, Millipore, MA), with centrifugation at 1500× g (Eppendorf centrifuge 5804R, Hamburg, Germany). The obtained liquid showed no detectable plasmon resonance optical absorption peak, confirming the ability of centrifugal ultrafiltration to remove Ag NPs. Then the liquid was thermally concentrated and dissolved by HNO3 and H2O2, followed by Ag quantitation with inductively coupled plasma-mass spectrometry (ICP-MS). To measure silver ion concentrations in the cytoplasm of treated cells, HeLa cells were treated with 10 μg/mL Ag NPs or 540 ng/mL Ag+ for 24 h. The treated cells were washed 5 times with PBS (137 mM NaCl, 2.68 mM KCl, 8.10 mM Na2HPO4, 1.47 mM KH2PO4, pH 7.4) and harvested. The cells were lysed with cell lysis buffer and centrifuged for 10 min at 20000 × g, which effectively precipitated any residual Ag NPs. Then the supernatant fraction was thermally concentrated and dissolved by HNO3 and H2O2, followed by Ag quantitation with ICP-MS.
Cell culture and establishment of EGFP-LC3/HeLa cells
Cell culture reagents were purchased from Gibco (Carlsbad, CA). All cells used in this research were grown continuously as a monolayer at 37°C and 5% CO2 in Dulbecco's Modified Eagle's medium (DMEM) supplemented with 10% FBS. For establishing HeLa EGFP-LC3, HeLa cells were transfected with pEGFP-LC3 using Lipofectamine 2000 according to the manufacturer's protocol. Twenty 4 h later transfection cells were transferred to a new plate and underwent selection in DMEM medium containing 0.6 mg ml−1 of G418 (Promega, Madison, WI, USA). About 10 d days post-transfection and expansion, cell colonies exhibiting strong green fluorescence were selected under a fluorescence microscope.
Primary MEF cell derivation and culture
Mouse embryos were harvested at 12.5 d postcoitum, from natural ICR matings. The embryos were removed from their decidues and minced. 0.05% trypsin were added into embryos and incubated at 37°C for 20 min. Prewarmed DMEM was added to the solution, pipetted up and down to help with tissue dissociation, then the solution was transferred into a conical tube and spinned for 3 min at 800× g at room temperature. The pellet was resuspended with DMEM media, transferred into cell culture plate and placed in the CO2 incubator for culture.
EGFP-LC3 dot formation assay
EGFP-LC3/HeLa cells were observed under fluorescence microscopy after treatment, EGFP-LC3 dot formation was quantified by counting 300 cells and expressed as the ratio between the number of cells with at least 5 EGFP-LC3 dots and the number of cells with green fluorescence (essentially 100% for our cells stably expressing EGFP-LC3). The assays were independently performed by 2 of the authors in a blind manner.
Autophagic marker dye staining
HeLa EGFP-LC3 cells, after Ag NPs treatment, were treated for 15 min with 10 μM monodansylcadaverine (Sigma, D4008) or 75 nM LysoTracker Red (Invitrogen, L7528). After washing twice with PBS, serum culture medium was added and cells were examined under fluorescence microscopy (Olympus IX71, Tokyo, Japan).
Western blotting
The treated cells were harvested and lysed with the lysis buffer (1% Nonidet P-40 (Beyotime, ST366), 1% sodium deoxycholate (Pierce, #89905), 25 mM Tris-HCl, 150 mM NaCl, pH 7.6) supplemented with a protease inhibitor cocktail (Sigma, P8340) on ice. An equal volume of 2 × SDS sample buffer was added, and boiled for 10 min. Proteins were separated by electrophoresis on a SDS-polyacrylamide gel and transferred to PVDF membrane (Millipore, IPVH00010). After blocking with 5% nonfat dry milk for 1 h, the PVDF membrane was incubated for 2 h with a primary antibody at room temperature, extensively washed, incubated with horseradish peroxidase-conjugated secondary antibody (1:10,000 dilution) for 1 h, and finally visualized with an enhanced chemiluminescence (ECL) kit.
Electron microscopy
HeLa cells were fixed in in suspension with 4% glutaraldehyde in 0.1 M calcodyate buffer (pH 7.3) after harvesting, overnight at 4°C, and then post-fixed for 1 h at room temperature in 2% osmium tetraoxide in 0.1 M cacodylate. Cells were dehydrated with a graded series of ethanol, and embedded in epoxy resin. Then the areas containing cells were cut into ultrathin sections and stained with uranyl acetate and lead citrate and observed on transmission electron microscope.
Evaluation of lysosomal acidity
HeLa cells were collected after treating with Ag NPs for 24 h and washed twice in PBS. The cells were incubated in prewarmed medium containing 1 uM LysoSensor Green DND-189 (Invitrogen, L-7535) dye for 30 min under growth conditions. The cells were resuspended in PBS after washing and analyzed by flow cytometry (FACS). FL1 (green) fluorescence was collected on a population of 10000 cells.
Analysis of CTSB activation
HeLa cells were incubated with or without Ag NPs for 24 h. All cells were washed with PBS twice and then incubated with Magic Red CTSB Substrate (Immunochemistry Technologies, 938) for 30 min at 37°C in the dark. Cells were washed twice with PBS and the levels of brightly fluorescent molecules released by CTSB hydrolyzation of nonfluorescent substrate in cells were examined using fluorescence microscopy (Olympus IX71).
Cell viability assay
MTT was used to assess the cell viability. Briefly, HeLa cells were grown in 96-well plates at a density of approximately 10,000 cells per well. After different treatments, MTT (thiazoyl blue tetrazolium bromide; T0793-500MG, Bio Basic) was added to the growing cultures at a final concentration of 0.5 mg/mL and incubated for 4 h at 37°C. Then the absorbance at 570 nm was measured with a spectrophotometer (Elx800, BioTek, Winooski, VT, USA).
Apoptosis assay
Apoptosis detection was performed with the ANXA5/Annexin V-FITC Apoptosis Detection Kit (Beyotime, C1062). Briefly, cells were collected and washed with PBS twice and then resuspended in 195 μL of binding buffer. 5 μL of ANXA5-FITC stock solution was added to the cells and incubated for 10 min at room temperature, avoiding exposure to light. After centrifugation, the cells were resuspended in 190 μL of binding buffer. Then 10 μL propidium iodide (PI) was added and the cells were immediately analyzed by FACS. Approximately 3 × 10⁴ cells were analyzed in each of the samples.
Cell death assay
Cells were stained with Hoechst 33342 (10 mM) and PtdIns (10 mM) for 20 min and then examined under fluorescence microscopy (Olympus IX71). Cell death was quantified by counting more than 600 cells each group and the results were expressed by the ratio of PI-positive cells to Hoechst-positive cells. The assays were independently performed by 2 of the authors in a blinded manner.
siRNA transfection
ATG5 siRNA (an equal-weight mixture of 4 siRNAs, with the following respective sequences: Sense 5′-GGAAUAUCCU GCAGAAGAAT T-3′, Anti-sense 5′-UUCUUCUGCA GGAUAUUCCT T-3′; Sense 5′-CAUCUGAGCU ACCCGGAUAT T-3′, Anti-sense 5′-UAUCCGGGUA GCUCAGAUGT T-3′; Sense 5′-GACAAGAAGA CAUUAGUGAT T-3′, Anti-sense 5′-UCACUAAUGU CUUCUUGUCT T-3′; Sense 5′-CAAUUGGUUU GCUAUUUGAT T-3′, Anti-sense 5′-UCAAAUAGCA AACCAAUUGT T-3′) and negative control siRNA (Sense 5′-UUCUCCGAAC GUGUCACGUT T-3′, Antisense 5′-ACGUGACACG UUCGGAGAAT T-3′) were synthesized by Shanghai GenePharma Biotechnology. HeLa cells were grown in 24-well plates. When the cells were at 55% to 65% confluence the next day, the cells were transfected with 20 nM siRNA for each well, using RNAimax (Invitrogen, 13778-075) as transfection reagent, following exactly the manufacturer's protocol. Transfected cells were treated with Ag NPs 36 h post-transfection.
Animals and tumor models
Male C57BL/ 6 mice (6 to 8 wk old), ranging from 18 to 22 g were purchased from Vital River Laboratory Animal Technology Co. Ltd (Beijing, China). For the melanoma model establishment, the right flank of C57BL/6 mice was shaved and 1×10⁶ cells in 100 μL of sterile PBS were injected s.c. After 4 d, B16 tumors with a diameter of 4 to 6 mm were established. Ag NPs and wortmannin was injected subcutaneously into the tumor daily from 5th d after B16 cells injection. The control group received an injection of same amount of normal saline solution. Body weight and tumor sizes were measured on a daily basis. Tumor volume was estimated by this standard formula: length × width2 / 2 = tumor volume (mm3).Citation50 Eight d later, all mice were sacrificed and the stripped subcutaneous melanoma tumors were weighted to evaluate the antitumor effect.
TUNEL assay
B16 tumors and the endothelium adjacent of tumors that received various treatments were used for TUNEL assay (TUNEL BrightRed Apoptosis Detection Kit, A113-01, Vazyme). 4 μm frozen sections were washed with PBS and then incubated with proteinase K for 3 min at room temperature. After incubation with equilibration buffer for 30 min, the TUNEL reaction mixturewas added to rinsed slides and incubated in a humidified chamber for 60 min at 37°C. After washing with PBS, the sections were stained for 10 min with DAPI, washed with PBS, and visualized with a fluorescence microscope.
Statistical analysis
All data were expressed as mean ± SEM and analyzed by ANOVA. *P < 0.05, **P < 0.01 and ***P <0.001 were considered statistically significant.
Supplemental_Files.pdf
Download PDF (1,009 KB)Acknowledgments
We thank Tamotsu Yoshimori (Osaka University, Japan) for providing the EGFP-LC3 plasmid.
Funding
This work was supported by grants from the National Basic Research Program of China (2013CB933902), the National Natural Science Foundation of China (31170966, 51201034), SRFDP 20123402110014 and the Young Scientist Innovation Fund of USTC (WK2340000045, WK2070000031).
References
- Levine B, Klionsky DJ. Development by self-digestion: molecular mechanisms and biological functions of autophagy. Dev Cell 2004; 6:463-77; PMID:15068787; http://dx.doi.org/10.1016/S1534-5807(04)00099-1
- Mizushima N. Autophagy: process and function. Gene Dev 2007; 21:2861 -73; PMID:18006683; http://dx.doi.org/10.1101/gad.1599207
- Xie ZP, Klionsky DJ. Autophagosome formation: core machinery and adaptations. Nat Cell Biol 2007; 9:1102-9; PMID:17909521; http://dx.doi.org/10.1038/ncb1007-1102
- Zabirnyk O, Yezhelyev M, Seleverstov O. Nanoparticles as a novel class of autophagy activators. Autophagy 2007; 3:278-81; PMID:17351332; http://dx.doi.org/10.4161/auto.3916
- Seleverstov O, Zabirnyk O, Zscharnack M, Bulavina L, Nowicki M, Heinrich JM, Yezhelyev M, Emmrich F, O'Regan R, Bader A. Quantum dots for human mesenchymal stem cells labeling. A size-dependent autophagy activation. Nano Lett 2006; 6:2826-32; PMID:17163713; http://dx.doi.org/10.1021/nl0619711
- Zhang Q, Yang WJ, Man N, Zheng F, Shen YY, Sun KJ, Li Y, Wen LP. Autophagy-mediated chemosensitization in cancer cells by fullerene C60 nanocrystal. Autophagy 2009; 5:1107-17; PMID:19786831; http://dx.doi.org/10.4161/auto.5.8.9842
- Wei PF, Zhang L, Lu Y, Man N, Wen LP. C60(Nd) nanoparticles enhance chemotherapeutic susceptibility of cancer cells by modulation of autophagy. Nanotechnology 2010; 21:495101; PMID:21071824; http://dx.doi.org/10.1088/0957-4484/21/49/495101
- Ma XW, Wu YY, Jin SB, Tian Y, Zhang XN, Zhao YL, Yu L, Liang XJ. Gold nanoparticles induce autophagosome accumulation through size-dependent nanoparticle uptake and lysosome impairment. Acs Nano 2011; 5:8629-39; PMID:21974862; http://dx.doi.org/10.1021/nn202155y
- Wu YN, Yang LX, Shi XY, Li IC, Biazik JM, Ratinac KR, Chen DH, Thordarson P, Shieh DB, Braet F. The selective growth inhibition of oral cancer by iron core-gold shell nanoparticles through mitochondria-mediated autophagy. Biomaterials 2011; 32:4565-73; PMID:21458061; http://dx.doi.org/10.1016/j.biomaterials.2011.03.006
- Markovic ZM, Ristic BZ, Arsikin KM, Klisic DG, Harhaji-Trajkovic LM, Todorovic-Markovic BM, Kepic DP, Kravic-Stevovic TK, Jovanovic SP, Milenkovic MM, et al. Graphene quantum dots as autophagy-inducing photodynamic agents. Biomaterials 2012; 33:7084-92; PMID:22795854; http://dx.doi.org/10.1016/j.biomaterials.2012.06.060
- Khan MI, Mohammad A, Patil G, Naqvi SAH, Chauhan LKS, Ahmad I. Induction of ROS, mitochondrial damage and autophagy in lung epithelial cancer cells by iron oxide nanoparticles. Biomaterials 2012; 33:1477-88; PMID:22098780; http://dx.doi.org/10.1016/j.biomaterials.2011.10.080
- Lu Y, Zhang L, Li J, Su YD, Liu Y, Xu YJ, Liang D, Huai-Ling G, Jun L, Na M, et al. MnO nanocrystals: a platform for integration of MRI and genuine autophagy induction for chemotherapy. Adv Funct Mater 2013; 23:1534-46; http://dx.doi.org/10.1002/adfm.201202233
- Zhang YJ, Zheng F, Yang TL, Zhou W, Liu Y, Man N, Zhang L, Jin N, Dou Q, Zhang Y, et al. Tuning the autophagy-inducing activity of lanthanide-based nanocrystals through specific surface-coating peptides. Nat Mater 2012; 11:817-26; PMID:22797828; http://dx.doi.org/10.1038/nmat3363
- Man N, Yu L, Yu SH, Wen LP. Rare earth oxide nanocrystals as a new class of autophagy inducers. Autophagy 2010; 6:310-1; PMID:20104026; http://dx.doi.org/10.4161/auto.6.2.11138
- Chen Y, Yang LS, Feng C, Wen LP. Nano neodymium oxide induces massive vacuolization and autophagic cell death in non-small cell lung cancer NCI-H460 cells. Biochem Bioph Res Co 2005; 337:52-60; PMID:16185655; http://dx.doi.org/10.1016/j.bbrc.2005.09.018
- Yu L, Lu Y, Man N, Yu SH, Wen LP. Rare earth oxide nanocrystals induce autophagy in HeLa cells. Small 2009; 5:2784-7; PMID:19885892; http://dx.doi.org/10.1002/smll.200901714
- Zhou W, Miao YY, Zhang YJ, Liu L, Lin J, Yang JY, Xie Y, Wen L. Induction of cyto-protective autophagy by paramontroseite VO2 nanocrystals. Nanotechnology 2013; 24:165102; PMID:23535229; http://dx.doi.org/10.1088/0957-4484/24/16/165102
- Dong L, Liu Y, Lu Y, Zhang L, Man N, Cao L, Ma K, An D, Lin J, Xu Y-J, et al. Tuning magnetic property and autophagic response for self-assembled Ni-Co alloy nanocrystals. Adv Funct Mater 2013; 23:5930-40; na-na; http://dx.doi.org/b10.1002/adfm.201203767
- Wei PF, Zhang L, Nethi SK, Barui AK, Lin J, Zhou W, Shen Y, Man N, Zhang YJ, Xu J, et al. Accelerating the clearance of mutant huntingtin protein aggregates through autophagy induction by europium hydroxide nanorods. Biomaterials 2014; 35:899-907; PMID:24169003; http://dx.doi.org/10.1016/j.biomaterials.2013.10.024
- Rosenfeldt MT, Ryan KM. The multiple roles of autophagy in cancer. Carcinogenesis 2011; 32:955-63; PMID:21317301; http://dx.doi.org/10.1093/carcin/bgr031
- Kondo Y, Kanzawa T, Sawaya R, Kondo S. The role of autophagy in cancer development and response to therapy. Nat Rev Cancer 2005; 5:726-34; PMID:16148885; http://dx.doi.org/10.1038/nrc1692
- White E, DiPaola RS. The double-edged sword of autophagy modulation in aancer. Clin Cancer Res 2009; 15:5308-16; PMID:19706824; http://dx.doi.org/10.1158/1078-0432.CCR-07-5023
- Yang ZJ, Chee CE, Huang S, Sinicrope FA. The role of autophagy in cancer: therapeutic implications. Mol Cancer Ther 2011; 10:1533-41; PMID:21878654; http://dx.doi.org/10.1158/1535-7163.MCT-11-0047
- Rai M, Yadav A, Gade A. Silver nanoparticles as a new generation of antimicrobials. Biotechnol Adv 2009; 27:76-83; PMID:18854209; http://dx.doi.org/10.1016/j.biotechadv.2008.09.002
- Sondi I, Salopek-Sondi B. Silver nanoparticles as antimicrobial agent: a case study on E-coli as a model for Gram-negative bacteria. J Colloid Interf Sci 2004; 275:177-82; PMID:15158396; http://dx.doi.org/10.1016/j.jcis.2004.02.012
- Jo YK, Kim BH, Jung G. Antifungal activity of silver ions and nanoparticles on phytopathogenic fungi. Plant Dis 2009; 93:1037-43; http://dx.doi.org/10.1094/PDIS-93-10-1037
- Kim JS, Kuk E, Yu KN, Kim JH, Park SJ, Lee HJ, Kim SH, Park YK, Park YH, Hwang CY, et al. Antimicrobial effects of silver nanoparticles. Nanomedicine 2007; 3:95-101; PMID:17379174; http://dx.doi.org/10.1016/j.nano.2006.12.001
- Lara HH, Ayala-Nunez NV, Ixtepan-Turrent L, Rodriguez-Padilla C. Mode of antiviral action of silver nanoparticles against HIV-1. J Nanobiotechnology 2010; 8:1; PMID:20145735; http://dx.doi.org/10.1186/1477-3155-8-1
- Lu L, Sun RW, Chen R, Hui CK, Ho CM, Luk JM, Lau GK, Che CM. Silver nanoparticles inhibit hepatitis B virus replication. Antivir Ther 2008; 13:253-62; PMID:18505176
- Baram-Pinto D, Shukla S, Perkas N, Gedanken A, Sarid R. Inhibition of herpes simplex virus type 1 infection by silver nanoparticles capped with mercaptoethane sulfonate. Bioconjug Chem 2009; 20:1497-502; PMID:21141805; http://dx.doi.org/10.1021/bc900215b
- Wong KKY, Cheung SOF, Huang LM, Niu J, Tao C, Ho CM, Che CM, Tam PK. Further evidence of the anti-inflammatory effects of silver nanoparticles. Chemmedchem 2009; 4:1129-35; PMID:19405063; http://dx.doi.org/10.1002/cmdc.200900049
- Nadworny PL, Wang J, Tredget EE, Burrell RE. Anti-inflammatory activity of nanocrystalline silver in a porcine contact dermatitis model. Nanomedicine 2008; 4:241-51; PMID:18550449; http://dx.doi.org/10.1016/j.nano.2008.04.006
- Sanpui P, Chattopadhyay A, Ghosh SS. Induction of apoptosis in cancer cells at low silver nanoparticle concentrations using chitosan nanocarrier. Acs Appl Mater Inter 2011; 3:218-28; PMID:21280584; http://dx.doi.org/10.1021/am100840c
- AshaRani PV, Mun GLK, Hande MP, Valiyaveettil S. Cytotoxicity and genotoxicity of silver nanoparticles in human cells. Acs Nano 2009; 3:279-90; PMID:19236062; http://dx.doi.org/10.1021/nn800596w
- Nallathamby PD, Xu XHN. Study of cytotoxic and therapeutic effects of stable and purified silver nanoparticles on tumor cells. Nanoscale 2010; 2:942-52; PMID:20648292; http://dx.doi.org/10.1039/c0nr00080a
- Foldbjerg R, Dang DA, Autrup H. Cytotoxicity and genotoxicity of silver nanoparticles in the human lung cancer cell line, A549. Arch Toxicol 2011; 85:743-50; PMID:20428844; http://dx.doi.org/10.1007/s00204-010-0545-5
- Miura N, Shinohara Y. Cytotoxic effect and apoptosis induction by silver nanoparticles in HeLa cells. Biochem Bioph Res Co 2009; 390:733-7; PMID:19836347; http://dx.doi.org/10.1016/j.bbrc.2009.10.039
- Foldbjerg R, Olesen P, Hougaard M, Dang DA, Hoffmann HJ, Autrup H. PVP-coated silver nanoparticles and silver ions induce reactive oxygen species, apoptosis and necrosis in THP-1 monocytes. Toxicol Lett 2009; 190:156-62; PMID:19607894; http://dx.doi.org/10.1016/j.toxlet.2009.07.009
- Ostad SN, Dehnad S, Nazari ZE, Fini ST, Mokhtari N, Shakibaie M, Shahverdi AR. Cytotoxic activities of silver nanoparticles and silver ions in parent and tamoxifen-resistant T47D human breast cancer cells and their combination effects with tamoxifen against resistant cells. Avicenna J Med Biotechnol 2010; 2:187-96; PMID:23408729
- Lu RQ, Yang DP, Cui DX, Wang ZY, Guo L. Egg white-mediated green synthesis of silver nanoparticles with excellent biocompatibility and enhanced radiation effects on cancer cells. Int J Nanomed 2012; 7:2101-7; PMID:22619546; http://dx.doi.org/10.2147/IJN.S29762
- Xu R, Ma J, Sun XC, Chen ZP, Jiang XL, Guo ZR, Huang L, Li Y, Wang M, Wang C, et al. Ag nanoparticles sensitize IR-induced killing of cancer cells. Cell Res 2009; 19:1031-4; PMID:19621033; http://dx.doi.org/10.1038/cr.2009.89
- Sriram MI, Kanth SBM, Kalishwaralal K, Gurunathan S. Antitumor activity of silver nanoparticles in Dalton's lymphoma ascites tumor model. Int J Nanomed 2010; 5:753-62; PMID:21042421; http://dx.doi.org/10.2147/IJN.S11727
- Liu JH, Zhao YX, Guo QQ, Wang Z, Wang HY, Yang YX, Huang Y. TAT-modified nanosilver for combating multidrug-resistant cancer. Biomaterials 2012; 33:6155-61; PMID:22682937; http://dx.doi.org/10.1016/j.biomaterials.2012.05.035
- Gurunathan S, Lee KJ, Kalishwaralal K, Sheikpranbabu S, Vaidyanathan R, Eom SH. Antiangiogenic properties of silver nanoparticles. Biomaterials 2009; 30:6341-50; PMID:19698986; http://dx.doi.org/10.1016/j.biomaterials.2009.08.008
- Bonet F, Tekaia-Elhsissen K, Sarathy KV. Study of interaction of ethylene glycolPVP phase on noble metal powders prepared by polyol process. B Mater Sci 2000; 23:165-8; http://dx.doi.org/10.1007/BF02719903
- Wang HS, Qiao XL, Chen JG, Wang XJ, Ding SY. Mechanisms of PVP in the preparation of silver nanoparticles. Mater Chem Phys 2005; 94:449-53; PMID:23862452; http://dx.doi.org/10.1016/j.matchemphys.2005.05.005
- Mizushima N, Yoshimori T, Levine B. Methods in mammalian autophagy research. Cell 2010; 140:313-26; PMID:20144757; http://dx.doi.org/10.1016/j.cell.2010.01.028
- Chen HHC, Yu C, Ueng TH, Chen SD, Chen BJ, Huang KJ, Chiang LY. Acute and subacute toxicity study of water-soluble polyalkylsulfonated C-60 in rats. Toxicol Pathol 1998; 26:143-51; PMID:9502397; http://dx.doi.org/10.1177/019262339802600117
- Kittler S, Greulich C, Diendorf J, Koller M, Epple M. Toxicity of silver nanoparticles increases during storage because of slow dissolution under release of silver ions. Chem Mater 2010; 22:4548-54; http://dx.doi.org/10.1021/cm100023p
- Yu JL, Rak JW, Coomber BL, Hicklin DJ, Kerbel RS. Effect of p53 status on tumor response to antiangiogenic therapy. Science 2002; 295:1526-8; PMID:11859195; http://dx.doi.org/10.1126/science.1068327