
Abstract
SNCA/α-synuclein aggregation plays a crucial role in synucleinopathies such as Parkinson disease and dementia with Lewy bodies. Aggregating and nonaggregating SNCA species are degraded by the autophagy-lysosomal pathway (ALP). Previously, we have shown that the ALP is not only responsible for SNCA degradation but is also involved in the intracellular aggregation process of SNCA. An additional role of extracellular SNCA in the pathology of synucleinopathies substantiating a prion-like propagation hypothesis has been suggested since released SNCA species and spreading of SNCA pathology throughout neural cells have been observed. However, the molecular interplay between intracellular pathways, SNCA aggregation, release, and response of the local microenvironment remains unknown. Here, we attributed SNCA-induced toxicity mainly to secreted species in a cell culture model of SNCA aggregation and in SNCA transgenic mice: We showed that ALP inhibition by bafilomycinA1 reduced intracellular SNCA aggregation but increased secretion of smaller oligomers that exacerbated microenvironmental response including uptake, inflammation, and cellular damage. Low-aggregated SNCA was predominantly released by exosomes and RAB11A-associated pathways whereas high-aggregated SNCA was secreted by membrane shedding. In summary, our study revealed a novel role of the ALP by linking protein degradation to nonclassical secretion for toxic SNCA species. Thus, impaired ALP in the diseased brain not only limits intracellular degradation of misfolded proteins, but also leads to a detrimental microenvironmental response due to enhanced SNCA secretion. These findings suggest that the major toxic role of SNCA is related to its extracellular species and further supports a protective role of intracellular SNCA aggregation.
Abbreviations:
- ACTB/bAct, actin, β
- AK, adenylate kinase
- AIF1/Iba1, allograft inflammatory factor 1
- ALP, autophagy-lysosomal pathway
- ANXA5, annexin A5
- BafA1, bafilomycinA1
- CA1, cornu ammonis field1
- CASP3/aCasp3, caspase-3
- CD63, CD63 molecule
- CM, conditioned medium
- CMA, chaperone-mediated autophagy
- CSF, cerebrospinal fluid
- DLB, dementia with Lewy bodies
- ER, endoplasmatic reticulum
- ESCRT, endosomal sorting complex required for transport
- EV, empty vector
- GFAP, glial fibrillary acidic protein
- Hippo, hippocampus
- HRP, horseradish peroxidase
- HSPA8/Hsc70, heat shock 70kDa protein 8
- IL6/IL-6, interleukin-6
- ILVs, intraluminal vesicles
- LAMP2A/Lamp2a, lysosomal-associated membrane protein 2, isoform A
- LB, Lewy bodies
- LN, Lewy neuritis
- MAP2, microtubule-associated protein 2
- ML, molecular layer
- MVBs, multivesicular bodies
- N, neuron
- Neoctx, neocortex
- PD, Parkinson disease
- PDGFB/PDGFb, platelet-derived growth factor subunit b
- PF, particle fraction
- PS, phosphatidylserine
- RAB11A/rab11, member RAS oncogene family
- RBFOX3/NeuN, RNA binding protein, fox-1 homolog (C. elegans) 3
- RT, room temperature
- S100B/S100b, S100 calcium-binding protein B
- SL, stratum lacunosum; SNCA/aSyn
- α-synuclein
- SNCAIP/Sph1, synphilin-1
- SNCA-T, tagged α-synuclein
- SYP, synaptophysin
- tg, transgenic
- TNF/TNFa, tumor necrosis factor α
- TUBB3/b-III-Tub, tubulin, β 3 class III
- UPS, ubiquitin proteasome system
- WT-SNCA, wild-type α-synuclein
Introduction
Synucleinopathies including Parkinson disease (PD) and dementia with Lewy bodies (DLB) are a group of neurodegenerative diseases characterized by misfolded and aggregated forms of SNCA/aSyn (α-synuclein) in intracellular Lewy bodies (LBs) and neurites (LNs).Citation1,2 Intracellular protein homeostasis is understood to be crucial for SNCA dependent cellular dysfunction in PD and DLB. SNCA can be degraded by the ubiquitin-proteasome system (UPS)Citation3,4 and the autophagy-lysosomal pathway (ALP),Citation5,6 both compromised in PDCitation7-10 and DLB.Citation11-13 The ALP consists largely of chaperone-mediated autophagy (CMA) and macroautophagy.Citation10,14 Macroautophagy is a unique bulk degradation mechanism capable of breaking down large intracellular structures such as protein aggregates or organelles.Citation15 In contrast, CMA specifically targets proteins containing the KFERQ motif to lysosomal degradation.Citation16 A chaperone complex comprising HSPA8/Hsc70 and its cochaperones is responsible for recognition and translocation of misfolded proteins into the lysosome via the LAMP2A (lysosomal-associated membrane protein 2, isoform A) transporter. Autophagy can be modulated at specific stages resulting in an activation or inhibition of the cascade.Citation17,18 We have recently shown that the lysosomal inhibitor bafilomycinA1 (BafA1) not only blocks ALP-mediated SNCA degradation, but also impairs its aggregation and substantiates SNCA toxicity, thereby supporting the notion that intracellular SNCA aggregation might be cell protective.Citation12,19
The paradigm of intracellular SNCA pathology has recently been extended by its extracellular effects, based on I) the detection of different SNCA species in human plasma and cerebrospinal fluid of PD patients and controls;Citation20 II) a hierarchical spreading of SNCA pathology throughout PD brains;Citation21 and III) a transfer of SNCA pathology from PD brain tissue to embryonic mesencephalic tissue transplants.Citation22 The resulting concept of cell-to-cell propagation of SNCA pathology comprises its release, uptake, and subsequently seeding of intracellular SNCA aggregation in recipient cells.Citation23 This hypothesis is supported by in vivo findings demonstrating that SNCA pathology is transmitted to grafted neurons in transgenic mice,Citation24,25 experiments demonstrating that SNCA pathology is spreading after stereotactic injection throughout rodent brains,Citation26,27 and partially investigated in vitro by using cell models of SNCA overexpression models.Citation28-31 However, the role of ALP on extracellular SNCA-induced effects has not been linked to its intracellular aggregation.
Our study elucidates the dynamic interplay between ALP-dependent SNCA degradation, aggregation, its release and toxicity, shedding light into the fine-tuned balance between intracellular aggregation and extracellular effects of SNCA. We attribute the major toxic effect to extracellular SNCA species inducing an adversarial microenvironmental response including neurotoxicity, inflammatory responses, and uptake of SNCA. Our study indicates that ALP inhibition by BafA1 reduces the formation of large intracellular aggregates and enhances release of distinct SNCA species that induce inflammatory and neurotoxic response of the microenvironment.
Results
Previously, we have shown that inhibition of ALP activity specifically by BafA1 diminished intracellular aggregates and increased cellular damage in vivo and in vitro.Citation12 Here, we hypothesized that the effect of BafA1 on intracellular aggregation and toxicity is linked to increased release of SNCA aggregating species.
SNCA aggregation is modulated by the ALP inhibitor BafA1
First, we analyzed the morphology of intracellular SNCA aggregates in the SNCA aggregation model comprising low-aggregating SNCA (wild-type SNCA) and high-aggregating SNCA-T (C-terminally modified SNCA).Citation12,19,32 SNCA aggregates were defined based on their size and microscopical appearance including aggregates <1 μm (small), homogenous and ring-shaped aggregates with a size of approximately 1 to 2 μm (medium), or 2 to 5 μm (large). I) The transfection of H4 neuroglioma cells with SNCA constructs (, Fig. S1A, S1B) resulted in a homogenous distribution of SNCA and only few small aggregates. II) Our unique aggregation model used transfection with SNCA-T that specifically led to formation of medium- and large-sized, detergent-resistant SNCA aggregates in transfected cells (, Fig. S1A, S1B).Citation12 Aggregation of SNCA-T was further enhanced by cotransfection of SNCAIP/Sph1 (synuclein, α interacting protein), an interactor of SNCACitation33 present in LBs and LNs.Citation34 Cotransfection of SNCA-T with SNCAIP further increased the frequency of large, ring-shaped aggregates exceeding size and number of aggregates compared to SNCA-T transfection alone (). These aggregates mimicked the halo structure of Lewy bodies,Citation35 were specifically ThioS-positive,Citation12 and might reflect differences in the protein and lipid composition, or conformational states of aggregating SNCA species. Cotransfection of both plasmids resulted in SNCA-T aggregates in about 45% SNCA+ cells (). Remarkably, BafA1 treatment markedly reduced larger SNCA-T aggregates in SNCA-T or SNCA-T and SNCAIP-transfected cells (, ). Moreover, remaining cells bearing aggregates after BafA1 treatment mostly display small aggregates and occasionally medium sized aggregates between 1 and 2 μm (, ). Aggregation of SNCA-T led to 3.5-fold higher intracellular SNCA-T protein levels as measured by western blot compared to low-aggregating SNCA 36 h after transfection with equi-molar plasmid ratios (Fig. S1C). Albeit, while BafA1 reduced aggregates, it increased SDS-soluble SNCA monomers 36 h post transfection, supporting blocked lysosomal degradation and accumulation of SNCA species (Fig. S1C).
Table 1. Quantification of aggregates in transfected H4 cells
Figure 1. BafA1 treatment modulates aggregate formation and levels of extracellular SNCA in transfected H4 cells. (A) to (C): Immunocytochemistry of H4 cells transfected with SNCA, SNCA-T and SNCA-T and SNCAIP: (A) Large aggregates of different size and morphology can be observed after transfection with high-aggregating SNCA-T and SNCAIP whereas SNCA only occasionally leads to smaller intracellular aggregates sized below 1 μm. Scale bar: 5 μm. (B) Quantification of differentially sized aggregates per cell in H4 cells transfected with SNCA-T alone compared to cotransfection of SNCA-T with SNCAIP. (C) Treatment with 200 nM BafA1 for 12 h results in smaller and more punctate intracellular structures. (D) to (F): Dot blot analysis of extracellular SNCA in the conditioned medium of H4 neuron-like cells and CG4 oligodendroglial cells: (D) Representative dot blots of H4 cell medium containing extracellular SNCA. Recombinant SNCA is used as quantification standard. (E) Dot blot quantification of extracellular SNCA levels in similar volumes of conditioned medium of H4 cells expressing high-aggregating SNCA-T compared to low-aggregating SNCA and mock-transfected control cells 36 h post-transfection. Treatment with 200 nM BafA1 for 12 h results in slightly increased levels of extracellular SNCA in the medium of H4 cells transfected with SNCA, and both SNCA-T and SNCAIP compared to untreated cells. (F) Representative dot blots showing a lack of extracellular SNCA in supernatants of undifferentiated and 6 d differentiated rat oligodendroglial CG4 cells overexpressing SNCA to exclude nonspecific SNCA release. All values are presented as mean + s.e.m; (*) P = 0.009.
Low-aggregating SNCA and high-aggregating SNCA-T are released by cells
BafA1 mainly acts as an ALP inhibitor and neutralizes the lysosomal pH by blocking the transmembrane v-type ATPase, prevents the fusion of the lysosome with autophagosomes, and clearance of target proteins.Citation36 Furthermore, previous findings indicate that BafA1 might also modulate SNCA release.Citation37 Thus, we asked if BafA1 enhances SNCA release from cells overexpressing high-aggregating SNCA-T or low-aggregating SNCA. We observed substantial extracellular levels of SNCA in the conditioned medium 36 h post transfection from high-aggregating SNCA-T and SNCA-T and SNCAIP-overexpressing cells compared to mock-transfected cells (4 to 5.7-fold, (*) P = 0.009, ). BafA1 slightly enhanced extracellular SNCA levels of high-aggregating SNCA-T and SNCAIP-expressing cells, even though we observed a substantial reduction of large aggregates in SNCA-T and SNCAIP-overexpressing cells (). Cells overexpressing low-aggregating SNCA showed only low levels of released SNCA (). BafA1 further increased SNCA release from SNCA-overexpressing cells by 1.5-fold (). To exclude an unspecific release of SNCA we investigated SNCA levels in the medium of SNCA-overexpressing oligodendroglial CG4 cells and were not able to detect extracellular SNCA ().
BafA1 induces SNCA-mediated toxicity in the cellular microenvironment of transfected cells
To examine total cellular toxicity we quantified CASP3/aCASP3 (caspase 3, apoptosis-related cysteine peptidase/activated CASP3)-positive cells (CASP3+) in all cells after transient SNCA transfection. Note that expression of high-aggregating SNCA-T alone does not increase CASP3+ cells compared to low-aggregating SNCA. Transfection efficiency typically ranges between 20% and 30%. Thus, SNCA- expressing and nonexpressing cells exist within the same cellular microenvironment. We observed an overall increase of CASP3+ cells after BafA1 treatment of H4 cells transiently transfected with SNCA, SNCA-T, or SNCA-T and SNCAIP (). Intriguingly, an increase of CASP3 activation by BafA1 was not observed in SNCA-overexpressing cells (). This suggests that the toxic effect of BafA1 was mainly derived from H4 cells not overexpressing SNCA.
Figure 2. Enhanced apoptotic action in the microenvironment of SNCA-expressing H4 cells, by BafA1 treatment. (A) to (D): Microenvironmental analysis of activated CASP3 as measure for apoptosis 36 h post-transfection of H4 cells with SNCA, SNCA-T, or SNCA-T and SNCAIP by immunocytochemical quantification. (A) Treatment with BafA1 increases CASP3+ cells for all constructs in the transient transfection model. (B) Quantification of CASP3+ and SNCA+ cells for all constructs in the transient transfection model. (C) Left: Cartoon of the analysis paradigm of the microenvironmental toxicity: SNCA-positive fields (white outlined, “microenvironment”) are defined by the presence of a nuclei (blue) of SNCA-overexpressing cell (green). SNCA-negative fields (gray outlined) do not contain nuclei of SNCA-overexpressing cells and are referred to as “distant” fields. The number of CASP3+ cells (red) within SNCA-positive and SNCA-negative fields are quantified 36 h post-transfection of H4 cells with SNCA, SNCA-T, or SNCA-T and SNCAIP. Depicted fields are part of a grid (6 × 7 fields) which is based on the mean number of SNCA-positive cells (≈ 21 SNCA+ cells/image; 20 × magnification) for all transfected constructs. Right: Representative immunocytochemical stainings for all transfected constructs displaying the grid. Scale bar 20 μm. (D) Quantification of CASP3+ and SNCA− H4 cells within the microenvironment of SNCA, SNCA-T or SNCA-T and SNCAIP-overexpressing cells with and without BafA1 treatment for 12 h. All values are mean + s.e.m; (*) P < 0.05.
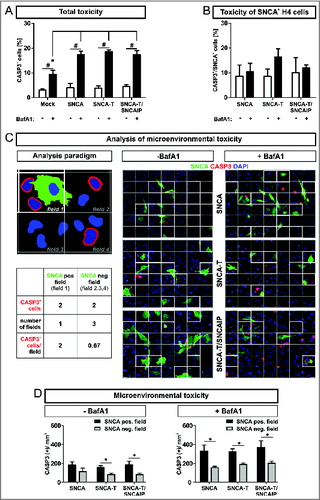
Thus, we tested if toxicity was increased in the microenvironment of SNCA-expressing cells. Therefore, we quantified CASP3+ cells in close proximity (e.g. microenvironment; , field 1) to SNCA+ cells in relation to CASP3+ cells more distant from SNCA+ cells (, field 2,3,4). Importantly, the number of CASP3+ cells per mm2 in the microenvironment of SNCA-overexpressing cells was increased by 1.8-fold compared to more distant fields. For cells transfected with high-aggregating SNCA-T this effect to the microenvironment was even stronger (2.0-fold) and further enhanced by coexpression with SNCAIP (2.3-fold; , ). Even though treatment with BafA1 approximately doubled the number of CASP3+ cells, the selectivity of this effect to the local microenvironment persisted (). Here, the ratio between CASP3+ cells in the microenvironment and in more distant fields revealed a pronounced effect for low-aggregating SNCA (2.1-fold) indicating the association of toxicity induction with less aggregated species (). These findings suggest an extracellular SNCA-dependent toxic gradient affecting cells within the microenvironment of cells overexpressing high-aggregating SNCA-T or low-aggregating SNCA that is modulated by BafA1 in a species-dependent manner.
Table 2. Activation of CASP3 in the microenvironment of H4 cells expressing low- and high-aggregating aSyn
BafA1 reduces the size of SNCA-T containing extracellular particles, but promotes oligomerization of extracellular SNCA species
In order to further elucidate the link between extracellular SNCA and toxicity induction in surrounding cells, we addressed the characteristics of released extracellular SNCA species. Thus, levels of SNCA oligomerization (SDS-PAGE and density sucrose gradient centrifugation) and size of SNCA-associated released particles (particle fraction preparation) were assessed in conditioned medium of untreated or BafA1-treated H4 cells transfected with SNCA or SNCA-T and SNCAIP (). We enriched cell-derived extracellular SNCA by ultracentrifugation of conditioned medium and separated the pellet containing the SNCA+ particle fraction (PF) from the BafA1 containing supernatant (). The supernatant contained proportionally low amounts of monomeric, soluble SNCA (). This preparation method isolated all particles in conditioned medium including extracellular vesicle structures such as exosomes or microparticles. This was required to account for the relative large size of particles in conditioned medium of SNCA-T and SNCAIP-overexpressing cells (). Importantly, BafA1 treatment increased the amount of released SNCA-T and SNCAIP as well as SNCA associated with PFs of transfected cells (). In the absence of BafA1 only low levels of SNCA were detected in PFs compared to SNCA-T and SNCAIP PFs ().
Figure 3 (See previous page). Characterization of particle fractions (PFs) prepared from conditioned medium of transfected H4 cells. (A) to (F) Western blot and dot blot analysis of SNCA associated with PFs prepared from conditioned medium of H4 cells expressing high-aggregating SNCA-T and SNCAIP or low-aggregating SNCA. (A) Representative protein gel blots of total SNCA+ PFs prepared from 12 ml conditioned medium of transfected H4 cells -/+BafA1 show an increased presence of extracellular SNCA (14 kDa) or SNCA-T (27 kDa) after BafA1 treatment. (B) 12 ml supernatant after PF separation contain only low levels of soluble SNCA. (C) Representative western blots of SNCA PFs -/+BafA1 after filter retardation to exclude particles of different size by using distinct pore size filters reveal enlarged particles (>1 .2 μm) in the presence of BafA1. (D) Representative dot blots of SNCA in the conditioned medium of H4 cells expressing low-aggregating SNCA -/+BafA1. (E) Representative protein gel blots of SNCA-T and SNCAIP PFs after exclusion of particles of different size by using distinct pore size filters. (F) Quantification of SNCA associated with PFs after using filters of defined pore size normalized to SNCA levels in unfiltered PFs displaying a shift toward smaller particles by BafA1. (G) BafA1 effect on oligomerization analysis of SNCA associated with PFs prepared from H4 cells expressing SNCA, as well as SNCA-T and SNCAIP measured by sucrose gradient centrifugation. All values are mean + s.e.m. Differences are significant at (*) P < 0.05.
Since BafA1 markedly changed intracellular aggregation pattern (), we hypothesized that the change in toxicity was related to the size of SNCA PFs. Therefore, we first analyzed SNCA levels in SNCA and SNCA-T and SNCAIP PFs after filter retardation by excluding particles larger than 10 μm, 5 μm, or 1.2 μm, respectively. SNCA levels in PFs prepared from SNCA-expressing H4 cells did not change after applying filters of different pore size proving a particle size below 1.2 μm. Interestingly, BafA1 treatment of SNCA-expressing cells led to the appearance of enlarged particles between 1.2 and 5 μm (), suggesting an effect of BafA1 on low-aggregating SNCA species. As expected, PFs from untreated SNCA-T and SNCAIP-expressing H4 cells showed a substantial amount of larger particles (>5 μm) () and the presence of medium-sized particles. Intriguingly, BafA1 treatment of SNCA-T and SNCAIP-expressing cells resulted only in the release of smaller PFs (). This also suggests that BafA1 does not reduce large intracellular aggregates by simple release but also shifts released PFs to smaller particles.
To further investigate the effect of BafA1 on released SNCA species in the PFs we performed density sucrose gradient centrifugation of SDS/NP-40-soluble SNCA species from PFs prepared from untreated and BafA1-treated H4 cells expressing SNCA or SNCA-T and SNCAIP and quantified the levels of higher and less oligomerized SNCA (, Fig. S4). As expected, BafA1 substantially increased less oligomerized SNCA-T and SNCAIP species and reduced the amount of higher oligomerized (detergent-soluble) species that entered the gradient. Interestingly, BafA1 led to an increase of higher oligomerized SNCA species in the 60% sucrose fraction and a decrease of less oligomerized species in low-sucrose fractions, in line with the filter retardation assay results (, Fig. S4). In summary, the increased BafA1-mediated toxicity in the microenvironment was paralleled by a reduction of higher aggregated SNCA species in conditioned medium of SNCA-T and SNCAIP-expressing cells but an increase of lower aggregated, rather oligomerized species in SNCA-expressing cells. These findings support the notion, that extracellular toxicity was associated with oligomerized SNCA species.
Cell-derived extracellular SNCA accumulates in naïve H4 cells and induces toxicity
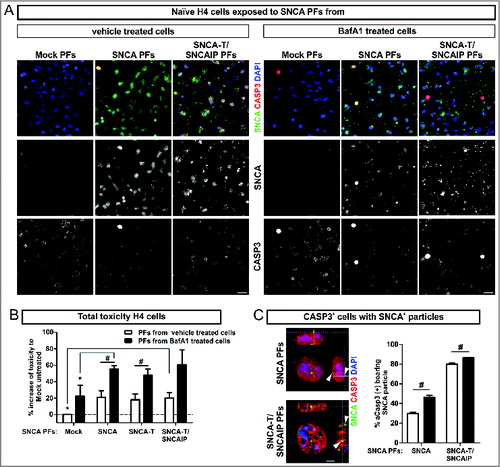
In order to validate the toxic effect of released SNCA species to the microenvironment, we exposed naïve H4 cells to PFs prepared from conditioned medium of untreated or BafA1-treated H4 cells transfected with SNCA or SNCA-T and SNCAIP (). Toxicity in naïve H4 cells exposed to SNCA-T and SNCAIP PFs was increased by 20% (Leerzeichen ±6.6 &) after 6 h (). Similar results were observed for H4 cells exposed to SNCA and SNCA-T PFs (). Exposure to PFs derived from BafA1-treated SNCA-overexpressing cells further increased cellular toxicity for low-aggregating SNCA or high-aggregating SNCA-T (). Immunofluorescence microscopy of PFs exposed H4 cells revealed a close association of SNCA-positive PFs with the cellular surface and the presence of intracellular SNCA-immunopositive structures paralleled by activation of CASP3 within affected cells (). Despite similar toxicity after exposure to PFs from all SNCA species tested we observed a substantially higher amount of CASP3+ cells displaying intracellular SNCA-immunopositive structures after applying SNCA-T and SNCAIP PFs (80% compared to 29.9% for SNCA PFs, ) suggesting that high-aggregating SNCA species were not degraded to the same extent as low-aggregating SNCA. PFs derived from BafA1-treated SNCA-expressing cells significantly enhanced the number of CASP3+ cells containing SNCA+ structures for all aggregate species ().
Figure 4. Toxic response of naïve H4 cells exposed to extracellular SNCA. (A) Immunocytochemistry of CASP3+ cells after 6 h exposure of naïve H4 cells to extracellular SNCA associated with particle fractions (PFs) prepared from conditioned medium of H4 cells transfected with SNCA, SNCA-T, and both SNCA-T and SNCAIP (and control H4 cells). Scale bar 40 μm. (B) Increase of toxicity in naïve H4 cells exposed to PFs containing extracellular SNCA from untreated and BafA1-treated cells after 6 h compared to exposure with control medium measured by AK release using ToxiLight assay. (C) Higher magnification of CASP3+ cells reveals an association to the surface of exposed H4 cells and intracellular accumulation of SNCA+ PFs. Scale bar 5 μm. All values are mean + s.e.m; differences were significant at (*) P < 0.05 and (#) P < 0.05.
Uptake of extracellular SNCA by primary neurons induces cytotoxicity
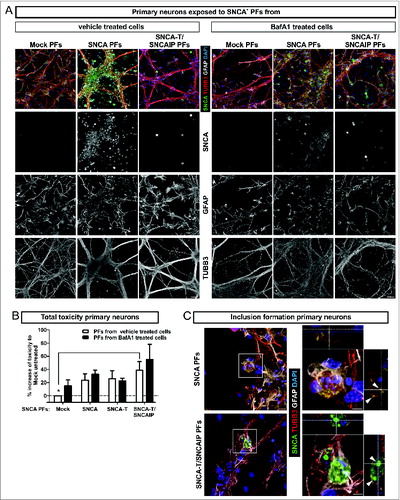
To study the effect of extracellular SNCA in an environment consisting of mature neurons and glial cells, we next exposed primary neuronal cultures to H4 cell-derived extracellular SNCA PFs containing either low-aggregating SNCA or high-aggregating SNCA-T (). Six h exposure of low-aggregating SNCA PFs increased toxicity, which was even higher for high-aggregating SNCA-T and SNCAIP PFs exposure (). Interestingly, compared to H4 cells, primary neurons did not show increased toxicity after 6 h PF exposure (), but required 24 h exposure to induce a toxic response (1.2-fold ± 0.019 compared to 1.4-fold ± 0.003, P = 0.02, unpaired Student t test). However, after 6 h exposure to SNCA-T and SNCAIP and SNCA PFs we already observed the presence of intracellular inclusions of different size in TUBB3+ (tubulin, β 3, class III) neurons illustrated in z-stacks of confocal images () indicating the uptake of extracellular SNCA species.
Figure 5. Toxic response of primary neuronal cultures exposed to extracellular SNCA. (A) Exposure of primary hippocampal neuronal cultures (TUBB3, neuronal marker; GFAP, astroglial marker) to extracellular SNCA associated with particle fractions (PFs) prepared from conditioned medium of H4 cells transfected with SNCA, SNCA-T, SNCA-T and SNCAIP (and control H4 cells). (B) The toxic response of primary neurons exposed to PFs from untreated and BafA1-treated H4 cells after 6 h exposure time measured by AK release using ToxiLight assay. (C) Exposure of primary neuronal cultures to SNCA, as well as SNCA-T and SNCAIP PFs leads to the formation of intracellular SNCA+ accumulations in TUBB3+ neuronal cells. Z-stack of confocal images, scale bar 10 μm. All values are mean + s.e.m. Differences were significant at (*) P < 0.05.
Other autophagosomal inhibitors do not reproduce the BafA1 effect on SNCA release and toxicity induction in naïve cells
We previously showed that BafA1 treatment of H4 cells expressing low-aggregating SNCA and high-aggregating SNCA-T and SNCAIP reduced the formation of large intracellular aggregates paralleled by a substantial increase of overall toxicity. In contrast to BafA1, this effect was not present using the ALP inhibitors chloroquine and 3-MA.Citation12 Thus, we asked if the BafA1-specific effect on intracellular aggregation persists for extracellular SNCA. Therefore, we treated SNCA-overexpressing H4 cells with chloroquine and 3-MA (Fig. S3). Dot blot quantification of SNCA in conditioned medium of treated H4 cells overexpressing low-aggregating SNCA revealed an increase of extracellular SNCA levels similar to the BafA1-induced by chloroquine but not by 3-MA (Fig. S3B). We next exposed naïve H4 cells to SNCA and SNCA-T and SNCAIP PFs prepared from conditioned medium of chloroquine and 3-MA-treated, overexpressing cells (Fig. S3C). In contrast, we could not detect an aggravated toxicity in naïve cells as observed in the presence of BafA1 (). Thus, neither chloroquine nor 3-MA was able to mimic the BafA1-specific effect on SNCA release and toxicity to the microenvironment.
SNCA accumulation and inclusion formation are modulated by BafA1 in vivo
To study the ALP effects on aggregate formation and intracellular SNCA in vivo, transgenic mice overexpressing human SNCA under the control of the PDGFB/PDGFb (platelet-derived growth factor subunit B) promoter, showing SNCA immunoreactive cytoplasmic aggregate-like inclusions in neuronal cells in the neocortex, hippocampus, and striatumCitation38 were systemically treated with BafA1. Similar to our in vitro findings we obtained a substantial reduction of dense inclusions within neuronal bodies in the neocortex ( 3rd row, ). This was paralleled by a marked increase of diffuse and punctate SNCA immunoreactivity in the neuropil of the neocortex ( 2nd row, ) and the molecular layer (ML) of the hippocampus ( 5th row, ) after systemic BafA1 treatment. This confirmed our previous findings on the dichotomous effect after intracerebral administration of BafA1 on nonaggregating and aggregating SNCA species.Citation12 A more detailed analysis of the subcellular distribution of SNCA in transgenic mice revealed the accumulation of SNCA in neuronal bodies and to some extent in the dendritic compartment of MAP2+ (microtubule-associated protein 2) neurons (Fig. S2A). Intriguingly, smaller and punctate structures were present in the neuropil next to SNCA+ neurons. Additionally, immunofluorescent staining of SYP (synaptophysin) in SNCA transgenic mice displayed a colabeling of presynaptic and axonal structures with SNCA (Fig. S2B). The quantification of intracellular SNCA levels in the frontal cortex and the hippocampus of SNCA transgenic mice confirmed the accumulation of transgenic SNCA (). Likewise, endogenous mouse SNCA increased after BafA1 treatment in nontransgenic mice (). In particular, BafA1 treatment enhanced the presence of monomeric and oligomeric SNCA species both in transgenic and in nontransgenic mice ().
Figure 6 (See previous page). Modulation of intracellular and extracellular SNCA in transgenic mice, by BafA1. (A) Immunohistochemistry of transgenic mice overexpressing human SNCA under the control of the PDGFB-promoter (SNCA-tg) and nontransgenic mice (non-tg) using an antibody recognizing human and mouse SNCA. Transgenic mice display SNCA+ inclusions in neuronal bodies and in the neuropil of the neocortex (Neoctx) compared to non-tg mice. BafA1 has been applied systemically by daily intraperitoneal injection of 0.3 mg/kg or vehicle (saline) for 5 consecutive days. The inset indicates the representative region of neocortex depicted in the 2nd and in the 3rd row. Scale bar 200 μm. Transgenic mice display SNCA immunoreactivity in the molecular layer (ML) of the hippocampus (Hippo) indicated by black arrows. Scale bar 50 μm. CA1: cornu ammonis field1; SL: stratum lacunosum (B) BafA1 treatment of SNCA-tg mice diminishes the number of neurons bearing SNCA+ inclusions within the neocortex compared to vehicle-treated SNCA-tg mice. (C) Quantification of the percentage of the neocortical neuropil area that shows SNCA immunoreactivity in SNCA-tg mice after BafA1 treatment. (D) Percentage of the neuropil area in the hippocampal ML that displays SNCA immunoreactivity in SNCA-tg mice after BafA1 treatment. (E) Left: Representative western blots of protein lysates probed for endogenous mouse and human SNCA depict monomeric (14 kDa) and oligomeric species (42 and 56 kDa). ACTB serves as loading control (42 kDa). Right: Western blot quantification of SNCA expression levels in BafA1-treated transgenic mice overexpressing human SNCA and normalized to ACTB (n = 3 animals per group). (F) Extracellular SNCA levels in the CSF of transgenic mice overexpressing SNCA measured by ELISA. All values are mean + s.e.m. Differences are significant at (#) P < 0.05.
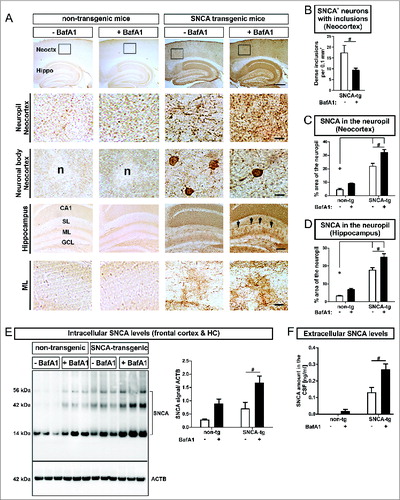
BafA1 treatment enhances SNCA release in vivo
Similar to the in vitro assessment of extracellular SNCA BafA1 markedly increased SNCA levels in the cerebrospinal fluid (CSF) by 2.0-fold in transgenic mice (). BafA1 also led to detectable levels of endogenous SNCA in nontransgenic mice that could not be measured without BafA1 treatment ().
BafA1 treatment leads to neuronal damage in vivo
To study the cellular effects of BafA1 on neuronal subpopulations in vivo, neuronal marker were immunohistochemically quantified in SNCA transgenic mice. We detected decreased numbers of RBFOX3/NeuN+ cells (RNA binding protein, fox-1 homolog (C. elegans) 3) in transgenic mice compared to nontransgenic mice in the hippocampus ( 1st row, ). The loss of RBFOX3/NeuN+ cells was pronounced by BafA1 in transgenic, and to a lesser extent in nontransgenic mice ().
Figure 7. Neuronal loss paralleled by astro- and microgliosis in transgenic mice, by BafA1 treatment. Immunohistochemical assessment of neuronal loss and astrogliosis paralleled by a microgliosis. (A) Representative images of RBFOX3/NeuN+ neurons, GFAP+ astroglia and the microglial marker AIF1 in the hippocampus of SNCA-tg and non-tg mice treated with BafA1 or vehicle. The insets in the 1st row depict the region of quantification. Insets in the 2nd row depict regions which are magnified in the 3rd row. Scale bar for RBFOX3/NeuN in the hippocampus 50 μm, GFAP in the hippocampus 50 μm and 20 μm (2nd and 3rd row) and AIF1 in the hippocampus and the neocortex 20 μm (4th and 5th row). Quantification of cell number and optical density quantification of (B) the neuronal marker RBFOX3/NeuN+, (C) the astroglial marker GFAP, (D) the microglial marker AIF1 in the hippocampus, and (E) AIF1 in the neocortex of SNCA-tg mice compared to non-tg mice. (B) to (E) Effects of BafA1 treatment in the hippocampus of SNCA-tg mice compared to vehicle treatment. All values are mean + s.e.m; differences are significant at (#) P < 0.05, unpaired t test, and at (*) P < 0.01.
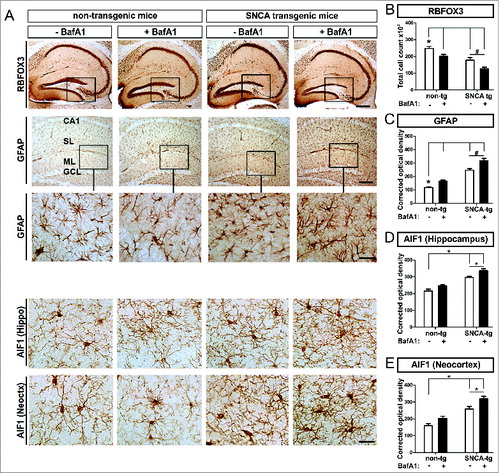
BafA1 treatment leads to increased astrogliosis and microgliosis in vivo
We next investigated the effect of SNCA to the microenvironment of PDGFB-promoter driven neuronal SNCA expression in transgenic mice. Thus we compared response and uptake in glial cells that do not express transgenic SNCA after BafA1 treatement in vivo. We observed an increased hippocampal astrogliosis measured by quantifying the astroglial density in SNCA transgenic mice (). BafA1 further enhanced the levels of GFAP immunoreactivity in the hippocampus in SNCA transgenic mice () and to some extent also in nontransgenic mice. The SNCA-mediated astrogliosis enhanced by BafA1 was paralleled by microgliosis and activation of microglia in the neocortex and in the hippocampus of SNCA transgenic mice (). Here, quantification of the AIF1/Iba1 (allograft inflammatory factor 1) signal density revealed an activation of microglia that was further enhanced by BafA1 treatment in the hippocampus as well as in the neocortex (). However, in nontransgenic mice, BafA1 treatment alone only induced a slight, nonsignificant increase of microglial activation.
ALP inhibition by BafA1 worsens the inflammatory response in vivo
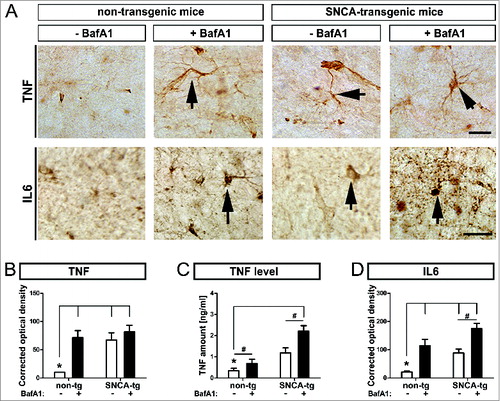
To measure the inflammatory response of glial cells to SNCA, we quantified immunoreactivity of the proinflammatory cytokines TNF/TNFa and IL6, and TNF levels in the hippocampus of untreated and BafA1-treated animals (). SNCA transgenic mice displayed increased both TNF levels and immunohistochemical signal density (), and IL6 () compared to nontransgenic animals. BafA1 further enhanced the expression of both inflammatory markers in SNCA transgenic mice but also in nontransgenic mice.
Figure 8. Inflammatory response in transgenic mice, by BafA1 treatment. Immunohistochemical assessment of the inflammatory response in SNCA transgenic mice. (A) Representative images of the inflammatory marker TNF and IL6 in the hippocampus of SNCA-tg and non-tg mice treated with BafA1 or vehicle. Black arrows indicate TNF and IL6 immunoreactivity. Scale bar for TNF and IL6 in the hippocampus 30 μm. Optical density quantification of (B) the inflammatory markers TNF and (D) IL6 in the hippocampus of SNCA-tg mice compared to non-tg mice. (B) to (D) Effects of BafA1 treatment in the hippocampus of SNCA-tg mice compared to vehicle treatment. (C) The absolute amount of TNF as measured by ELISA in SNCA-tg mice treated with BafA1 compared to vehicle-treated animals. All values are mean + s.e.m; differences are significant at (#) P < 0.05, unpaired t test and at (*) P < 0.01.
BafA1 increases the accumulation of SNCA within glial cells in vivo
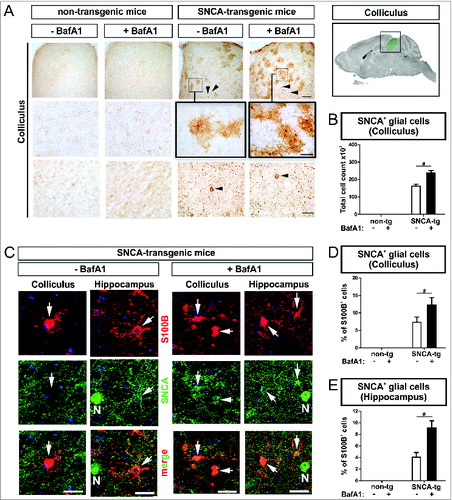
Beside the accumulation of transgenic SNCA within neurons of deeper neocortical layers and the hippocampus () we also detected accumulation of human SNCA in glial cells in the superior colliculus (). The superior colliculus typically contains only a few SNCA-expressing neurons. Thus, the colliculus provides an ideal cellular composition allowing to analyze SNCA uptake in the microenvironment of SNCA-expressing neurons by glial cells (, lowest row), that do not express SNCA mRNA.Citation31 Intriguingly, the number of SNCA+ glial cells increased markedly after BafA1 treatment suggesting, that glial uptake of SNCA is modulated by BafA1 (). Double labeling of cells with an antibody against the astroglial marker S100B (S100 calcium-binding protein B) and a human-specific antibody against transgenic SNCA confirmed the presence of SNCA in astroglial cells in the superior colliculus (, left column; ), that was increased by BafA1 (). In the hippocampus of SNCA transgenic mice we also detected SNCA+ glial cells ( 2nd left column; ). Note, that we observed S100B and SNCA double-positive cells predominantly in the microenvironment of SNCA-immunopositive neurons (, “N”). Similar to the superior colliculus, the percentage of S100B+ cells displaying SNCA in the hippocampus was increased by BafA1 ().
Figure 9. BafA1 treatment increases the accumulation of SNCA in glial cells in the microenvironment of SNCA-expressing neurons in transgenic mice. Immunohistochemical analysis of glial cells (S100B+) in the microenvironment of SNCA+ neurons within the colliculus and the hippocampus of SNCA-tg mice. (A) SNCA immunoreactivity in glial cells in the colliculus of SNCA-tg mice compared to non-tg mice -/+BafA1 treatment. Insets in the 1st row indicate the region within the superior colliculus which is magnified in the 2nd row. Black arrowheads indicate the presence of SNCA+ neurons based on their morphological appearance in close proximity. Scale bar 1st row 50 μm, 2nd and 3rd row 20 μm. (B) Quantification of glial cells based on their morphology displaying SNCA immunoreactivity in the colliculus of SNCA-tg mice -/+BafA1 treatment. (C) Confocal images of S100B+ astroglia (red) double-labeling for SNCA (green) in close proximity to SNCA+ neurons (N; defined by morphology) in the hippocampus and colliculus of SNCA-tg mice either treated with BafA1 or vehicle. (D) and (E) Quantification of S100B+ and SNCA+ cells after BafA1 treatment in SNCA-tg mice compared to vehicle-treated animals. All values are mean + s.e.m; differences are significant at (#) P < 0.05.
Released SNCA species are associated with different secretion pathways
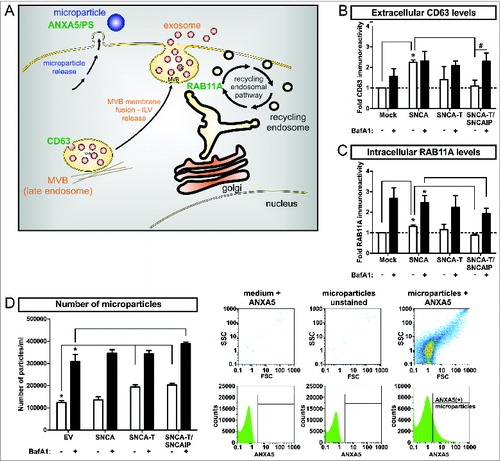
In order to understand ALP-modulated SNCA release mechanisms, we investigated nonclassical secretion associated to the endocytic pathway releasing low- and high-aggregating SNCA species after BafA1 treatment. The endocytic pathway involves the formation of multivesicular bodies (MVB) containing intraluminal vesicles (ILVs) for cargo transport. Multivesicular bodies (MVBs) are able to fuse with the cell membrane to release their ILVs as exosomes.Citation39 MVB processing is also linked to ALP since MVBs can fuse with autophagosomes thereby generating amphisomes, which are degraded by the lysosome.Citation40 Another nonclassical mechanism by which cells are able to release particles containing proteins is shedding of the cell membrane. The resulting microparticles are biochemically and morphologically distinct from exosomes and are characterized by high levels of phosphatidylserine (PS) in the external membrane leaflet binding ANXA5 (annexin A5).Citation41 As markers for these release pathways, we measured I) the exosomal marker CD63 involved in MVB formation,Citation37,42 II) RAB11A/rab11 (member RAS oncogene family), involved in the endosomal recycling pathway and MVB fusion processes,Citation43 and III) the release of ANXA5-FITC+ microparticles (). Overexpression of low-aggregating SNCA increased extracellular CD63 levels as well as the intracellular expression of RAB11A (). In contrast, the number of microparticles in the medium representing membrane shedding was not affected (). In contrast, overexpression of high-aggregating SNCA-T, and SNCA-T and SNCAIP showed no significant effect CD63 and RAB11A levels but substantially increased the number of released microparticles (), suggesting that low-aggregating SNCA and high-aggregating SNCA-T are preferentially released via different nonclassical release pathways. ALP inhibition by BafA1 broadly enhanced extracellular CD63, RAB11A levels, and released microparticles for all SNCA aggregate species. However, highest aggregation of SNCA-T induced by SNCAIP coexpression attenuated the BafA1-stimulated RAB11A induction and further increased microparticle release (). These data suggest that ALP inhibition might trigger all cellular release pathways leading to increased extracellular SNCA.
Figure 10. Modulation of nonclassical secretory pathway by BafA1 treatment in H4 cells expressing low-aggregating SNCA and high-aggregating SNCA-T. (A) Scheme of markers for distinct nonclassical secretory pathways including exosome release, endocytic recycling pathway, and microparticle shedding. MVBs = multivesicular bodies, ILVs = intraluminal vesicles, PS = phosphatidylserine (B) Quantification of extracellular CD63 levels in the medium of H4 cells expressing low-aggregating SNCA and high-aggregating SNCA-T and SNCAIP compared to control cells (mock) by dot blot analysis. Cells have been treated with or without 200 nM BafA1 for 12 h. (C) Quantification of RAB11A expression in H4 cell lysates expressing low-aggregating SNCA and high-aggregating SNCA-T and SNCAIP -/+ BafA1 treatment. (D) Left: FACS analysis of released microparticles by transfected H4 cells -/+ BafA1 using a FITC-labeled ANXA5 antibody. Right: Representative scatter plots and histograms showing medium with ANXA5 as control for background signals, unstained microparticles to exclude auto fluorescence and microparticles stained for ANXA5 as positive control defining gating criteria. All values are mean + s.e.m; differences are significant at (*) P < 0.01 and at (#) P < 0.05.
Discussion
Cellular protein homeostasis is maintained by synthesis, recycling, degradation, and secretion processes. The decline or impairment of these processes disrupts protein homeostasis resulting in the formation of protein oligomers and aggregates. Intracellular protein oligomerization and aggregation under oxidative stress and mitochondrial impairment is counteracted by protein degradation processes that are linked to disease mechanisms in synucleinopathies.Citation6 Here, the pathological hallmark is aggregated SNCA in LBs and LNs. However, we have previously shown that inhibition of the ALP-mediated degradation by BafA1 reduces large aggregates but aggravated SNCA toxicityCitation12 suggesting that ALP is involved in the regulation of SNCA aggregation and reflects a cell-autonomous protective mechanism. In the present study we comprehensively attribute the ALP mediated toxicity of SNCA to extracellular SNCA species. Blocking ALP by BafA1 shifted larger intracellular aggregates to smaller and rather oligomerized SNCA species and exacerbated their release in association with membranous particles. This shift to smaller aggregated species led to detrimental microenvironmental responses in a cell culture model of SNCA aggregation, in primary neuronal cultures, and in SNCA transgenic mice. It also suggests that aggregate formation is rather a detoxifying event whereas the decreased aggregate formation alters the cellular protein homeostasis triggering the secretion of toxic SNCA species. Also, a more detailed characterization of SNCA release mechanisms suggested an activation of nonclassical secretory pathways by blocking ALP depending on the aggregation state of SNCA. Our findings support the interconnection between the ALP and nonclassical release mechanisms for SNCA species leading to the induction of neuro-inflammation and -degeneration within the cellular microenvironment.
The propensity of SNCA to polymerize into partially folded intermediates that assemble into oligomers, protofibrils, and finally elongate into mature fibrillar amyloid filaments is based on its intrinsic structureCitation44 and points to its structural integrity as a crucial requirement to prevent intracellular aggregation. Mutations within the protein, identified isoforms lacking functional protein domains, and oxidative stress-induced post-translational modifications lead to conformational changes and oligomerization of different SNCA species.Citation45,46 In response to SNCA aggregation, activation of ALP components can be detected in brain tissue of PD or DLB patients.Citation7,11,12 Oligomeric SNCA can be degraded via ALP, potentially leading to the clearance of larger aggregated species.Citation47 In addition, ALP not only mediates SNCA degradation, but is also involved in the aggregation process of SNCA: Here, inhibition by BafA1 potentiated SNCA toxicity but reduced larger aggregate formation in SNCA-overexpressing cells (Fig. S1).Citation12 Systemically applied BafA1 increased smaller SNCA aggregate species within the neuropil of neurons in the neocortex and the hippocampus in SNCA transgenic mice, but again reduced larger and dense intracellular SNCA inclusions in SNCA+ neurons (), substantiating the BafA1-specific effects after intracerebral administration of BafA1.Citation12 This dichotomous effect on SNCA species depending on their aggregate state could also be detected in our cell culture model overexpressing low-aggregating SNCA or high-aggregating SNCA-T, representing an artificial SNCA aggregation model that develops ThioS-positive fibrillar SNCA aggregates.Citation12 Total levels of intracellular SNCA were increased by BafA1 but a marked reduction of preferably large aggregates and a switch to more punctate and diffuse distribution of SNCA were observed for high-aggregating SNCA-T (). These findings support that ALP inhibition might influence the spectrum of SNCA aggregation, substantiating the presence of lower aggregating and oligomerized, but more toxic SNCA species. The present results underline the notion that aggregate intermediates or oligomers of SNCA represent the toxic species, whereas larger aggregate formation is rather detoxifying.Citation46,48
The detection of monomeric and oligomeric SNCA species in extracellular biological fluids like CSF and plasma fundamentally extended the understanding of SNCA-related pathology.Citation20 Extracellular SNCA species exist in the interstitial brain fluid of SNCA transgenic and wild-type mice suggesting that the protein is also constitutively released.Citation49 Oligomerized and proteinase K-resistant extracellular SNCA is found in cellular models.Citation28,29 In line with this, we detected extracellular SNCA species in our high-aggregating (SNCA-T) and low-aggregating (SNCA) culture model (). The amount of extracellular SNCA correlated with its intracellular level after transient overexpression. However, overexpressed SNCAIP could not be detected in PFs obtained from conditioned media of SNCA-T and SNCAIP-overexpressing cells therefore excluding disrupted membrane integrity as the primary cause of extracellular SNCA. Also, the oligodendroglial precursor cell line CG4 overexpressing SNCA did not release measurable amounts of SNCA suggesting that release of SNCA might be cell specific and a well-controlled mechanism. Lysosomal blocking has been reported to enhance the presence of extracellular SNCA in vitro whereas proteasomal impairment did not change its release.Citation37,50,51 Consistently, we showed that BafA1 administration mildly increased the amount of overexpressed SNCA in the medium in our cellular model. Moreover, transgenic mice overexpressing human SNCA also show extracellular SNCA in the CSF which was substantially augmented by systemic BafA1 treatment (). Importantly, lysosomal blocking by chloroquine, a weak base that concentrates in the acidic lysosome thereby raising the pH, resulted in increased levels of extracellular SNCA (Fig. S3). Interestingly, this effect was not present in vitro using another ALP inhibitor (3-methyladenine, 3-MA), that blocks the formation of autophagosomes at an early stage of the ALP. Thus, it limits the association of the ALP with SNCA secretion to late lysosomal stages and not to early autophagosome generation within the ALP, suggesting that late lysosome modulation might directly influence the intracellular aggregation process and the interaction with the secretion machinery, potentially via the MVB-compartment.Citation43 Furthermore, both compounds did not enhance the toxic effect of extracellular SNCA in naïve cells. These results support our previous findings demonstrating that 3-MA and chloroquine are not able to mimic the specific effect of BafA1 on both intracellular aggregation, release, and toxicity.Citation12 It further indicates that BafA1-induced modulation of SNCA aggregation and release occurs at distinct stages of the ALP that are not targeted by 3-MA or chloroquine.
Intriguingly, aggravation of toxicity by BafA1 was mediated by SNCA aggregate species released by SNCA-expressing cells. Transient transfection resulted in a mixture of SNCA-expressing and nonexpressing cells within the same microenvironment. Here, the observed overall induction of toxicity by BafA1 treatment was not pronounced in SNCA-expressing, but rather appeared in surrounding naïve H4 cells (). This important finding supports the detrimental effect of extracellular SNCA and suggests that release of SNCA into the microenvironment reflects a cell-protective mechanism. This was underlined by treating both naïve H4 cells and primary neuronal cultures with conditioned media of cells expressing high-aggregating and low-aggregating SNCA species. This SNCA-dependent induction of toxicity in cells within the microenvironment could even be exacerbated by blocking the lysosomal degradation using BafA1. Extracellular SNCA derived from overexpressing cells in the presence of BafA1 markedly increased apoptotic response in naïve H4 cells or primary neuronal cultures, indicating that blocking the lysosomal compartment has not only implications for the formation of intracellular aggregates but also for released SNCA species. A detailed analysis of extracellular SNCA revealed an association with larger particles for high-aggregating SNCA-T and smaller sized particles below 1.2 μm for low-aggregating SNCA (). BafA1 presence not only shifts the size of these particles toward smaller particles () but also clearly modulates the oligomerization of SNCA toward less oligomerized species for high-aggregating SNCA-T (). On the other hand, for low-aggregating SNCA the presence of BafA1 resulted in enlarged particles and an increase of oligomerized SNCA species (). The latter findings explain the enhanced apoptotic action in close proximity of SNCA-expressing cells. Even though treatment with BafA1 led to an overall induction of apoptosis, the direct toxicity to the microenvironment was markedly enhanced and can therefore be attributed to the modulated extracellular SNCA species. Thus, we hypothesize that the neurotoxic effects under ALP challenge are mainly caused by extracellular SNCA rather than its intracellular presence. Our findings also underline that the composition and vesicular association of extracellular SNCA species appear to be crucial for the effect on the cellular microenvironment. Here, lower-aggregated, oligomeric SNCA species represent the toxic insult extracellular rather than larger aggregated structures. Moreover, BafA1 seems to favor the pathway for these oligomeric SNCA species resulting in enhanced secretion and exacerbated toxicity in the microenvironment.
Released SNCA species are potentially transferred from neurons to neighboring neuronal and glial cells, seed pathological protein deposits in recipient cells,Citation30,52 and increase cellular damage in vitro.Citation29 In naïve cells exposed to cell-derived extracellular SNCA species even an uptake of these species could be observed (). Moreover, the uptake of SNCA could also explain the relative low increase of extracellular SNCA levels in the transient transfection model after BafA1 treatment (). We observed SNCA-immunopositive structures in association with the cell surface of neuroglioma cells exposed to particle fractions, internalized in apoptotic cells, and the formation of SNCA-immunopositive inclusions within TUBB3-positive primary neurons. As part of the cell-to-cell transmission cascade, it has been shown that extracellular SNCA can be taken up by recipient cells, seed aggregation processes, and lead to cellular damage.Citation53–55 Within the hippocampus of SNCA transgenic mice we could observe accumulating SNCA preferably in the ML of the hippocampus not only in neurons, but also in astroglial cells not expressing the transgene within the microenvironment of SNCA+ neurons (). Accordingly, analyzing the superior colliculus with lower neuronal density confirmed accumulating SNCA preferably within astrocytes in the microenvironment of SNCA-expressing neurons (). In both regions intra-glial presence of SNCA was exacerbated by BafA1 treatment. Interestingly, the effect of BafA1 on astroglial cells containing human SNCA was even pronounced in the neuron-dense hippocampus suggesting a correlation of the microenvironmental uptake with the number of SNCA-expressing neurons. Consequently, SNCA transgenic mice displayed a substantial neuronal loss due to SNCA presence which was aggravated by ALP inhibition using BafA1 in the hippocampus (). In vivo studies suggest that transmitted SNCA activates astrocytes and stimulates inflammatory response.Citation26,52 Here we show that BafA1 treatment not only augmented this effect by decreasing the number of neurons in the ML but also exacerbated the inflammatory response of glial cells to released SNCA by inducing astrogliosis, microgliosis, and stimulating the proinflammatory cytokines IL6 and TNF (). Similarly, applied extracellular SNCA was also detected in astroglial cells followed by the upregulation of neuroinflammatory cytokines.Citation31 Future analysis of uptake mechanisms of SNCA potentially needs to focus on receptor-mediated uptake studies and subsequent glial activation pathways.Citation56 Taken together, inhibition of ALP by BafA1 substantiated SNCA release and led to neurotoxicity, micro- and astrogliosis, and inflammatory response within the same microenvironment.
SNCA bears no secretory signal peptide sequence and its release is insensitive to brefeldinA suggesting that it is not released via the classical endoplasmatic reticulum (ER)-Golgi secretory pathway.Citation28 Previous reports demonstrate that SNCA can be constitutively released under physiological conditions via exocytosis or by exosome release.Citation28,37,51 We detected elevated levels of the exosome-specific transmembrane protein CD63 in the medium of H4 cells and increased expression of RAB11A reflecting augmented MVB formation and release of exosomes by overexpression of low-aggregating SNCA. This complies with increased levels of extracellular SNCA caused by functional mutations in the endosomal sorting complex required for transport (ESCRT)-machinery involved in exosome generation that can be restored by RAB11A.Citation57 Overexpression of high-aggregating SNCA-T did not affect RAB11A expression or extracellular CD63 levels (), suggesting a rather exosome-independent release. Here, increased extracellular microparticles indicate membrane sheddingCitation41 as a potential release mechanism for higher-aggregated SNCA species. Even though little is known about microparticle release from brain structures it has been shown that microparticles containing galactocerebroside are present in the CSF of patients suffering from epilepsy,Citation58 multiple sclerosis and are detected in plasma after stroke, or traumatic brain injury.Citation59 Low-aggregating SNCA did not significantly stimulate the release of microparticles. In summary, exosome-associated SNCA release was mainly active for low-aggregating SNCA species, whereas microparticle shedding was substantiated by the presence of high-aggregating SNCA-T. This extends the initial findings that ALP modulates the release of SNCA via nonclassical pathways since lysosomal dysfunction by pharmacological and genetic manipulation increased the exosome-related release for low-aggregating SNCA species.Citation50,57,60 This is further supported by a study showing that the secretion of exosomes can be inhibited by autophagy induction causing a marked fusion of MVB with autophagosomes.Citation61 Moreover, RAB11A regulates MVB formation and fusion of MVBs with autophagosomes,Citation57,62 providing a potential molecular link between ALP-mediated degradation and MVB-associated release mechanisms of SNCA.
This study clearly attributes the toxic effect of SNCA to its released species, rather than a solely cell-autonomous effect of SNCA. Also, challenging ALP further supports a protective role of intracellular SNCA aggregation. ALP inhibition by BafA1 induced a variety of nonclassical release pathways as a potential novel consequence of impaired ALP in the diseased brain. Inhibition of the lysosomal degradation potentially shifted aggregate-prone SNCA species to less aggregated forms that can be released by exosomes and microparticle shedding. Even though this effect seemed to protect individual SNCA-overexpressing cells, SNCA secretion was detrimental for the local microenvironment, thereby attributing toxic effects of SNCA to low-aggregated extracellular species. A BafA1-sensitive pathway at a late ALP stage seems to influence I) aggregate formation as a detoxifying event, II) release of smaller aggregated but more toxic SNCA species, and III) increases microenvironmental response. In vivo, this resulted in neuronal loss, astrogliosis, and proinflammatory response of the microenvironment. Future studies will aim to decipher the detailed molecular mechanisms of ALP-mediated SNCA aggregation, secretion, and cellular responses following uptake of SNCA species. Nevertheless, our study clearly shows that ALP not only performs protein degradation, but also connects aggregation and degradation to SNCA secretion as a comprehensive pathway in the pathology of synucleinopathies.
In conclusion, the paradigm shift from intracellular detrimental effects of SNCA to extracellular presence and pathology in synucleinopathies is substantially extended by our findings attributing the major toxic effect of SNCA to extracellular species and linking the ALP process to its release. In line with other in vivo studies on hierarchical spreading of SNCA pathology and on transfer of SNCA pathology from PD brain tissue to transplants, our data substantiate not only the molecular mechanisms of the release but also the cell-to-cell propagation concepts of SNCA in PD. These intriguing concepts will lead to novel understanding in PD pathology and enable the development of novel therapeutic strategies.
Materials and Methods
Cell culture and calcium-phosphate transfection
H4 neuroglioma cells of human origin (ATCC, HTB-148) were maintained in Opti-MEM +GlutaMAX (Invitrogen, 51985–042) supplemented with 10% fetal calf serum (FCS; Invitrogen, 10270–106) at 37°C, and plated 24 h prior transfection on glass cover slips (Thermo Fisher Scientific, CB00130RAC/ 6302277) in 24-well plates (6×10⁴ cells) or in 6-well plates (2×10⁵ cells), respectively.
The rodent oligodendroglial precursor cell line CG4 was cultured in poly-L-ornithine (Sigma, P4957) coated flasks and grown in DMEM (PAN-Biotech, P04–04510) containing 4.5 g/l glucose and 0.584 g/l stable glutamine supplemented with N2 (Invitrogen, 17502048), biotin (10 ng/ml, Sigma-Aldrich, B4639), basic fibroblast growth factor (bFGF; 10 ng/ml, R&D Systems, 233-FB), and platelet derived growth factor (PDGF; 10 ng/ml, R&D Systems, 1055-AA-050). CG4 cells stably overexpressing SNCA were cultured in presence of 200 μg/ml geneticin (Invitrogen, 10131–027). CG4 cells were differentiated for 6 d by withdrawal of growth factors, the addition of triiodothyronine (30 ng/ml; Sigma-Aldrich, T2877), and low dose of FCS (0.5%, Invitrogen).
Primary hippocampal cells were prepared from E18 Wistar rat embryos. Dissected hippocampi were dissociated with 0.25% trypsin (PAN Biotech, P10–023100) and 0.1 mg/ml DNase I (Worthington, LS002139) for 30 min. After addition of 10% FCS, dissociated cells were washed and resuspended in Neurobasal medium (Invitrogen, 21103–049) containing 2 mM L-glutamine (Invitrogen, 25030024) and 1% B-27 supplement (Invitrogen, 17504–044). 1 × 10⁵ cells were plated on poly-L-lysine-coated (50 μg/ml, Sigma-Aldrich, P9155) glass coverslips in 24-well plates. Half of the medium was replaced every 3 to 4 d.
Transfection of cells was performed using calcium-phosphate as described previously.Citation12 Equimolar ratios of plasmids encoding SNCA (human wild-type SNCA), aggregation-prone SNCA-T (c-terminal tagged SNCA), SNCAIP (synphilin-1), or empty expression vector (EV),Citation19 were transfected compared to mock as control. Cells were treated 24 h post-transfection with 200 nM BafA1 (Applichem, A7823,0001), 5 mM 3-methyladenine (3-MA, Sigma Aldrich, M9281), 50 μM chloroquine diphosphate salt (CQ, Sigma Aldrich, C6628), or vehicle (DMSO or aqua dest.) for 12 h and fixed or harvested for further analysis. A total experimental duration of 36 h post-transfection has been chosen to reduce the transfection-associated background toxicity.
SDS-PAGE and protein gel blotting
Transfected H4 cells were collected in homogenization buffer consisting of 50 mM Tris (Sigma, T1503), 150 mM NaCl (Merck, 1064045000), 1 mM EDTA (Applichem, A5097,0250), protease/phosphatase inhibitors (Roche, 11836170001/ 04906837001) and homogenized by freeze-thawing, followed by trituration (23 and 27 gauge needles), and sonication for 30 s. Lysates were generated by incubating homogenates with radio-immunoprecipitation assay buffer (RIPA) with a final concentration of 1% Nonidet P-40 (NP-40; Roche, 11754599001), 0.1% SDS (Applichem, A1112,0100), 0.5% sodium deoxycholate (Sigma, D6750), 50 mM Tris, 150 mM NaCl, 1 mM EDTA, and protease/phosphatase inhibitors (Roche) for 1 h at 4°C. Frozen brain tissue was homogenized in ice-cold homogenization buffer by using the Micro-Dismembrator U (Sartorius, Goettingen, Germany) at 1,500 rpm for 6 min, followed by sonication for 30 s and centrifugation at 800 × g for 10 min. The quantification of protein amounts of cell lysates and brain tissue homogenates was assessed using Pierce BCA protein assay (Thermo Scientific, 23225). Fifteen to 30 μg total proteins were separated on 4–12% or 12% Bis-Tris gels (Life Technologies, NP0322BOX), transferred to a PVDF-FL membrane or nitrocellulose membrane (Immobilon-P, Merck Millipore, IPVH00010), and blocked for 1 h in 1% BSA (Sigma, A9647) in PBS-T (phosphate-buffered saline; Applichem, A0965,9010) containing 0.1% Tween 20 (Applichem A1389.0500). Incubation with primary antibodies against human and rodent SNCA (1:1,000; BD Transduction Laboratories, 610786), ACTB/bAct (actin, β) (1:2500; Abcam, 8226), RAB11A (1:1,000; BD Transduction Laboratories, 610656) at 4°C overnight was followed by washing with PBS-T and signal detection using the fluorescent-labeled secondary antibodies donkey anti-mouse (Alexa 488, 1:1000; Invitrogen, A21202), donkey anti-rabbit (Alexa 647, 1:1,000; Dianova, 711–605–152), or horseradish peroxidase (HRP)-conjugated goat anti-mouse antibody (1:5,000; JacksonImmuno, 115–035–068) for 1 h at room temperature (RT). Immunoblots of cell lysates were analyzed by fluorescent intensity with the FusionFX (Peqlab, Erlangen, Germany) and quantified using the Bio1D software (Vilber Lourmat, Eberhardzell, Germany). Immunoblots of brain homogenates were visualized with enhanced chemiluminescence (PerkinElmer, NEL105001EA), and analyzed with the VersaDoc gel imaging system (BioRad, Munich, Germany).
Immunocytochemistry and aggregate analysis in H4 cells
H4 cells, plated and transfected on 13 mm glass coverslips, were fixed for 15 min using 4% paraformaldehyde (Sigma, 441244), washed with Tris buffered saline (TBS, pH 7.4) and blocked with fish skin gelatine buffer (FSGB) containing Triton X-100 (Sigma, T9284) for 1 h at RT. Primary antibodies against SNCA (1:250; Enzo Life Sciences, ALX-804–258-L001) was applied overnight at 4°C. After washing cells were incubated with donkey anti-rat secondary antibody (Alexa 488, 1:1,000; Invitrogen, A21208) for 1 h at RT. Nuclei were counterstained with 4′6′-diamidino-2-phenylindol (DAPI, 1:10,000; Sigma, D8417) for 15 min. After an additional washing with FSGB and TBS the coverslips were mounted using Prolong Antifade reagent (Invitrogen, P36930) and captured with an Axio Imager M2 microscope combined with an AxioCam MRm camera and an ApoTome for AxioImager (Carl Zeiss AG, Jena, Germany).
For quantification of intracellular aggregates 5 fields of view per coverslip of at least 3 independent experiments were randomly selected. At least 200 SNCA-transfected cells were quantified for the presence of intracellular small aggregates (<1 μm) and medium and large sized aggregates (1 to 5 μm) by an observer blinded to the transfection and treatment conditions. The percentage of cells containing accumulations or aggregates of all transfected cells was quantified.
Dot blot analysis of SNCA in conditioned medium
Released SNCA by transfected H4 cells was analyzed by dot blot analysis using 2 ml of conditioned medium (CM) 36 h post-transfection. Collected CM was centrifuged for 5 min at 300 × g at 4°C to remove remaining cells and applied to a nitrocellulose membrane (Millipore, VSWP02500) clamped in a dot blot chamber (Minifold I, Schleicher & Schuell BioScience, Dassel, Germany) by gentle vacuum. After air-drying, the membrane was blocked with 1% BSA in PBS-T at RT for 15 min and incubated with primary antibody against SNCA (1:1,000; BD Transduction Laboratories) or CD63 (1:200; SantaCruz, sc-15363) overnight at 4°C. After washing with PBS-Tween the membrane was incubated with HRP-conjugated goat anti-mouse secondary antibody (1:10,000, Jackson Immuno, 115–035–068) for 1 h at RT. The blots were developed with Pierce Super Signal West Femto Chemiluminescent Substrate Kit (Thermo Fisher Scientific, 34094) for 5 min. Chemiluminescence was detected using a Fusion FX7 detection system (Peqlab) and quantified using Bio1D software (Vilber Lourmat).
Toxicity assessment in vitro
Toxicity was analyzed by ToxiLight enzyme activity assay for membrane integrity (Lonza, LT07–117) according to the manufacturer's protocol. The total toxicity measured by ToxiLight was complemented in adaptation of our previously described modelCitation12 by the cell based assessment of toxicity using an antibody against activated (cleaved) CASP3 (1:500; Cell Signaling Technology, 9661). For quantification of total CASP3 activation at least 400 DAPI-positive cells were classified for each experiment. CASP3 activation specifically in SNCA transfected H4 cells was determined by counting CASP3+ cells in at least 200 SNCA+ cells.
Microenvironmental response in cell culture
Toxicity induction within the cellular microenvironment of SNCA-expressing cells was assessed by quantifying CASP3+cells in 2 distinct types of predefined fields in each immunocytochemical image (). To generate an overall equal number of fields containing SNCA-expressing H4 cells (SNCA-positive fields, white labeled) and SNCA-nonexpressing H4 cells (SNCA-negative fields, gray labeled), the grid size was defined using the mean number of SNCA expressing cells/image in all conditions. This resulted in 6 × 7 fields/image (20 × magnification, each image 447.63 μm × 335.4 μm). The mean number of CASP3+ cells per area was recorded in 5 images for each condition in 3 independent experiments.
Particle fraction preparation and cellular exposure experiments
Twelve ml of CM resulting from transfected H4 cells were collected 36 h post-transfection and centrifuged at 300 × g for 5 min at 4°C to remove floating cells. The supernatant was transferred to ultracentrifugation tubes (Polyallomer, 13.2 ml, 14 × 89 mm, Beckman Coulter, 331372) and centrifuged at 134.434 × g for 60 min at 4°C using an Optima TM LE-80K centrifuge (Beckman Coulter, Pasadena, USA) with a rotor type SW41 Ti (Beckman Coulter). After carefully aspirating the supernatant, the pellet containing the particle fraction (PF) was dissolved in the respective growth medium and applied to naïve H4 cells or primary neuronal cultures for 6 and 24 h (one pellet per well). Fourteen, 21 and 28 d-old primary neuronal cultures were used for 3 independent particle fraction exposure experiments. In parallel experiments 12 ml of CM were collected as described above and centrifuged at 300 × g for 5 min at 4°C to remove floating cells. Particles of different sizes were excluded from the conditioned medium using filters with defined pore size (10 μm, 5 μm, 1.2 μm; Acrodisc premium, Pall Life Sciences, Pallap-4001; 512–3118; 17593-K) prior ultracentrifugation. Pellets were analyzed by western blotting and supernatants by dot blotting for characterization of particle fractions.
Density gradient centrifugation
Density sucrose gradient centrifugation was performed as previously describedCitation63 with minor modifications. Briefly, particle fractions were homogenized in 50 mM Tris/HCl pH 7.4 buffer containing 150 mM NaCl, 2 mM EDTA, 1% (v/v) NP-40, 0.1% (w/v) SDS, and protease inhibitors cocktails (Roche) in a Potter douncer homogenizer at 4 ºC. The lysate were layered on a continuous 10% to 30% sucrose gradient (30 ml) in 25 mM Tris-HCl, pH 7.4, 0.2 M NaCl, on the top of a 60% sucrose cushion (4 ml). After centrifugation for 18 h at 4°C in a Sorvall SW-28 rotor (Thermo Fisher Scientific, Waltham, USA) at 122,000 × g, 24 sucrose fractions with 1.5 ml each were collected. 400 μl of each fraction were mixed with 100 μl methanol and directly spotted onto a nitrocellulose membrane. Fractions 1 to 3 represent the 60% sucrose cushion containing higher oligomerized proteins. Fractions 4 to 24 consist of decreasing percentages of sucrose and represent a decline of oligomerization.
FACS analysis of microparticles in conditioned medium
500 μl CM collected from transfected H4 cells was transferred into FACS tubes (Sarstedt, 55.1579) and incubated for 30 min at 4°C with ANXA5-FITC-solution (ImmunoTools, 31490013) after 1:1 dilution with Jonosteril® (Fresenius-Kabi). Microparticles in the CM were analyzed with a CyFlow® Space (Partec, Muenster, Germany) and evaluated with the FloMax 2.81 analysis and quantification software (Partec). The cut-off fluorescence intensity for defining microparticles was set by measuring the auto fluorescence of unstained microparticles. CM stained with ANXA5-FITC-solution was measured to exclude background fluorescent intensity. The concentration of microparticles per ml was determined by gating ANXA5-FITC+ particles. ANXA5-FITC binding was confirmed by adding EDTA (final concentration 20 mM) to the CM. Size determination of ANXA5-FITC+ microparticles was carried out using synthetic beads of known size (0.1 μm, 0.5 μm, 1.0 μm, 2 μm; Fluoresbrite Beads Polysciences, 18859–1, 18860–1, 18604–1, 18862–1) as calibrator using forward and sideward scatter signal.
SNCA transgenic mice and treatment
Heterozygous transgenic mice overexpressing human SNCA under the control of the neuron-specific PDGFBCitation64-promoter were used.Citation38 These mice show abnormal detergent-insoluble SNCA and develop SNCA-immunopositive cytoplasmic aggregate-like inclusions in neuronal cells that are distributed throughout the neocortex, hippocampus, and striatum.Citation38 In transgenic mice, SNCA begins to accumulate in the neuropil and in neuronal cell bodies in deep layers of the neocortex and the hippocampus at 3 mo of age.Citation65 The transgenic animals and nontransgenic littermates at the age of 5 to 6 mo were treated with BafA1 (0.3 mg/kg) or vehicle (saline) by daily intraperitoneal injections for 5 consecutive d (4 groups, 8 animals each). Mice were anesthetized with chloral hydrate (Sigma, C8383) and flush-perfused transcardially with 0.9% saline. Brains were removed and fixed in phosphate-buffered 4% paraformaldehyde, pH 7.4, at 4°C for 48 h for further analysis. All the procedures for animal experiments were approved by the Institutional Animal Care and Use Committee of the US.
ELISA of homogenates and CSF from SNCA transgenic mice
TNF concentration was measured by ELISA (TNF Human ELISA Kit, Invitrogen, KHC3011) in homogenates from dissected fresh frozen hippocampi of nontransgenic and transgenic mice following the manufacturer's protocol. All samples were run in triplicates. For the assessment of extracellular SNCA concentrations approximately 5 to 10 μl CSF were obtained from the cistern magna of nontransgenic and transgenic mice utilizing a micropipette. Five μl of CSF were analyzed for total SNCA amount by ELISA (Hu SNCA ELISA Kit, Invitrogen, KHB0061) following the manufacturer's protocol. Briefly, SNCA standard (concentration 15 ng/ml) was reconstituted and diluted serially after equilibration time (7.5, 3.75, 1.88, 0.94, 0.47 and 0.23 ng/ml). 50 μl of standard or samples diluted in sample buffer were transferred to the ELISA plate (for example, 5 μl CSF into 45 μl buffer, or 25 μl (1:10) into 25 μl buffer).50 μl of human SNCA antibody solution were added into each well and incubated for 3 h at RT. After aspirating the solution wells were washed 4 times and incubated with 100 μl anti-rabbit IgG HRP solution for 30 min at RT followed by incubation with 100 μl of the stabilized chromogen at RT in the dark. Plates were read at 450 nm and cytokine concentrations were estimated from the appropriate standard curve and expressed as ng/ml sample volume.
Immunohistochemical analysis in SNCA transgenic mice
40 μm brain sections were generated serially (Vibratome 2000, Leica, Wetzlar, Germany). For immunohistochemistry, free floating sections were incubated overnight at 4°C with monoclonal antibodies against SNCA (1:500; Millipore, AB5038), RBFOX3/NeuN (1:1000; Merck Millipore, MAB377), GFAP (1:2000; Millipore, MAB360), IL6 (1:500, Novus Biologicals, NB600–1131), and TNF (1:100, Abcam, ab1793) followed by biotinylated goat anti-rabbit IgG (1:100; Vector Laboratories, BA-1000), Avidin D-horseradish peroxidase (1:200; Vector Laboratories, A-2004), and subsequent detection with diaminobenzidine (DAB, Vector Laboratories, SK-4100). For each animal, 3 sections were analyzed by the dissector method using the Stereo-Investigator System (MBF Bioscience, Williston, USA), averaged, and expressed as total cell counts. For optical density, sections were imaged with a bright-field digital microscope (Olympus, Shinjuku, Japan) and analyzed with the Image Pro-Plus system (Media Cybernetics, Rockville, USA).
Double-immunofluorescence and confocal analysis in SNCA transgenic mice
To quantify colocalization, sections were double labeled with combinations of antibodies against human SNCA (1:200; Millipore, 36–008) and S100B (astroglial marker, 1:1,000; Sigma, SAB1402349). SNCA-immunopositive structures were detected with the fluorescein isothiocyanate (FITC)-conjugated horse anti-mouse antibody (1:75; Vector Laboratories, FI-2000) while the mouse S100B was detected with the Tyramide Signal Amplification-Direct (Red) system (1:100; Perkin Elmer, NEL702001KT) and sections were mounted under glass coverslips with anti-fading media (Vector Laboratories, H-1000). The immuno-labeled blind-coded sections were serially imaged with a Zeiss 63 × (NA 1.4) objective of an Axiovert 35 microscope (Carl Zeiss AG) with an attached MRC1024 LSCM system (BioRad) and analyzed with the Image 1.63 program (National Institutes of Health). Ten digital confocal images (512 × 512 pixel area) with a focal plane of 1 μm from each of 3 immuno-stained sections per mouse of hippocampus and superior colliculus were used (n = 3 mice per group). Images were converted to 8-bit grayscale and threshold function was used to set a black and white threshold corresponding to the respective immunostaining. For quantification of S100B, “Analyze Particles” function was used to sum up the total area of positive staining and calculate the fraction of the total area. The colocalization of images was analyzed with ImageJ software (National Institutes of Health) and the colocalization Colormap plug-in (Adam Gorlewicz; http://rsbweb.nih.gov/ij/notes.html). For subcellular localization of SNCA, sections were double labeled with combinations of antibodies against human SNCA and MAP2 (1:100; Millipore) to detect neuronal bodies and dendritic structures or SYP (Sy38, 1:500; Millipore) for axonal and synaptic staining and imaged as described above.
Statistical analysis
All numeric results are reported as mean + s.e.m. and represent data from a minimum of 3 independent experiments unless otherwise stated. Statistical significance of difference between groups was determined in instances of single comparisons by the 2-tailed unpaired Student t test of the means or one-sample t test if values have been compared with normalized control values. In instances of multiple-means comparison, the one-way analysis of variance (ANOVA) was used for the determination of significance followed by the post-hoc test Tukey or Dunett if values have been compared with control values. Statistical analysis was performed for all assays and significant differences are depicted in the figures by graphical representation. Statistics has been performed using GraphPad Prism (GraphPad Software, La Jolla, USA).
Disclosure of Potential Conflicts of Interest
No potential conflicts of interest were disclosed.
KAUP_981785_Supplemental_Figures.pdf
Download PDF (702 KB)Acknowledgments
We thank K. Behr, B. Ettle, N. Ben Abdallah and S. Havlicek for technical assistance and critical scientific discussion. I. Henz, A. Serwotka and R. Weber are gratefully acknowledged for their excellent technical assistance with primary neuronal cultures and sample preparation.
Funding
This work was supported by the German Ministry for Education and Science (BMBF grant 01GN0979 (A.-M.P. and J.W.)), the Interdisciplinary Center for Clinical Research (IZKF, Erlangen, Germany (P.S., J.W., A.-M.P. W.X., and J.K.), the Bavarian State Ministry of Sciences, Research, and the Arts, ForNeuroCell (V.E.L.M. and J.W; Erlangen, Germany), ForIPS (J.K., W.X., and J.W., Erlangen, Germany), the Adalbert-Raps-Stiftung, Parkinson and Nutrition (01/2010-12/2013 (V.E.L.M. and J.W.), the ELAN fonds (University Hospital Erlangen, Germany No. 08.11.05.1 (J.K.)). O.C. was supported by Fundacao para a Ciencia e Tecnologia, Portugal (SFRH/BD/ 44446/2008). T.F.O. is supported by the DFG Center for Nanoscale Microscopy and Molecular Physiology of the Brain, Goettingen, Germany. E.R. and E.M. were supported by the NIH grants AG022074, AG18440, and NS076411.
References
- Spillantini MG, Schmidt ML, Lee VM, Trojanowski JQ, Jakes R, Goedert M. Alpha-synuclein in Lewy bodies. Nature 1997; 388:839-40; PMID:9278044; http://dx.doi.org/10.1038/42166
- Klucken J, Ingelsson M, Shin Y, Irizarry MC, Hedley-Whyte ET, Frosch M, Growdon J, McLean P, Hyman BT. Clinical and biochemical correlates of insoluble alpha-synuclein in dementia with Lewy bodies. Acta Neuropathol 2006; 111:101-8; PMID:16482476; http://dx.doi.org/10.1007/s00401-005-0027-7
- Chung KK, Dawson VL, Dawson TM. The role of the ubiquitin-proteasomal pathway in Parkinson's disease and other neurodegenerative disorders. Trends Neurosci 2001; 24:S7-14; PMID:11881748; http://dx.doi.org/10.1016/S0166-2236(00)01998-6
- Webb JL, Ravikumar B, Atkins J, Skepper JN, Rubinsztein DC. Alpha-Synuclein is degraded by both autophagy and the proteasome. J Biol Chem 2003; 278:25009-13; PMID:12719433; http://dx.doi.org/10.1074/jbc.M300227200
- Xilouri M, Vogiatzi T, Vekrellis K, Stefanis L. alpha-synuclein degradation by autophagic pathways: a potential key to Parkinson's disease pathogenesis. Autophagy 2008; 4:917-9; PMID:18708765; http://dx.doi.org/10.4161/auto.6685
- Malkus KA, Tsika E, Ischiropoulos H. Oxidative modifications, mitochondrial dysfunction, and impaired protein degradation in Parkinson's disease: how neurons are lost in the Bermuda triangle. Mol Neurodegener 2009; 4:24; PMID:19500376; http://dx.doi.org/10.1186/1750-1326-4-24
- Anglade P, Vyas S, Javoy-Agid F, Herrero MT, Michel PP, Marquez J, Mouatt-Prigent A, Ruberg M, Hirsch EC, Agid Y. Apoptosis and autophagy in nigral neurons of patients with Parkinson's disease. Histol Histopathol 1997; 12:25-31; PMID:9046040
- Dawson TM, Dawson VL. Molecular pathways of neurodegeneration in Parkinson's disease. Science 2003; 302:819-22; PMID:14593166; http://dx.doi.org/10.1126/science.1087753
- Alvarez-Erviti L, Rodriguez-Oroz MC, Cooper JM, Caballero C, Ferrer I, Obeso JA, Schapira AH. Chaperone-mediated autophagy markers in Parkinson disease brains. Arch Neurol 2010; 67:1464-72; PMID:20697033; http://dx.doi.org/10.1001/archne-urol.2010.198
- Rubinsztein DC. The roles of intracellular protein-degradation pathways in neurodegeneration. Nature 2006; 443:780-6; PMID:17051204; http://dx.doi.org/10.1038/nature05291
- Crews L, Spencer B, Desplats P, Patrick C, Paulino A, Rockenstein E, Hansen L, Adame A, Galasko D, Masliah E. Selective molecular alterations in the autophagy pathway in patients with Lewy body disease and in models of alpha-synucleinopathy. PloS One 2010; 5:e9313; PMID:20174468; http://dx.doi.org/10.1371/journal.pone.0009313
- Klucken J, Poehler AM, Ebrahimi-Fakhari D, Schneider J, Nuber S, Rockenstein E, Schlötzer-Schrehardt U, Hyman BT, McLean PJ, Masliah E, et al. Alpha-synuclein aggregation involves a bafilomycin A 1-sensitive autophagy pathway. Autophagy 2012; 8:754-66; PMID:22647715; http://dx.doi.org/10.4161/auto.19371
- MacInnes N, Iravani MM, Perry E, Piggott M, Perry R, Jenner P, Ballard C. Proteasomal abnormalities in cortical Lewy body disease and the impact of proteasomal inhibition within cortical and cholinergic systems. J Neural Transm 2008; 115:869-78; PMID:18401540; http://dx.doi.org/10.1007/s00702-008-0027-6
- Xilouri M, Vogiatzi T, Vekrellis K, Park D, Stefanis L. Abberant alpha-synuclein confers toxicity to neurons in part through inhibition of chaperone-mediated autophagy. PloS One 2009; 4:e5515; PMID:19436756; http://dx.doi.org/10.1371/journal.pone.0005515
- Dunn WA Jr. Studies on the mechanisms of autophagy: maturation of the autophagic vacuole. J Cell Biol 1990; 110:1935-45; PMID:2161853; http://dx.doi.org/10.1083/jcb.110.6.1935
- Dice JF. Chaperone-mediated autophagy. Autophagy 2007; 3:295-9; PMID:17404494; http://dx.doi.org/10.4161/auto.4144
- Rubinsztein DC, Gestwicki JE, Murphy LO, Klionsky DJ. Potential therapeutic applications of autophagy. Nat Rev Drug Discov 2007; 6:304-12; PMID:17396135; http://dx.doi.org/10.1038/nrd2272
- Klionsky DJ, Abdalla FC, Abeliovich H, Abraham RT, Acevedo-Arozena A, Adeli K, Agholme L, Agnello M, Agostinis P, Aguirre-Ghiso JA, et al. Guidelines for the use and interpretation of assays for monitoring autophagy. Autophagy 2012; 8:445-544; PMID:22966490; http://dx.doi.org/10.4161/auto.19496
- Klucken J, Shin Y, Masliah E, Hyman BT, McLean PJ. Hsp70 Reduces alpha-Synuclein Aggregation and Toxicity. J Biol Chem 2004; 279:25497-502; PMID:15044495; http://dx.doi.org/10.1074/jbc.M400255200
- El-Agnaf OM, Salem SA, Paleologou KE, Curran MD, Gibson MJ, Court JA, Schlossmacher MG, Allsop D. Detection of oligomeric forms of alpha-synuclein protein in human plasma as a potential biomarker for Parkinson's disease. FASEB J 2006; 20:419-25; PMID:16507759; http://dx.doi.org/10.1096/fj.03-1449com
- Braak H, Del Tredici K, Rub U, de Vos RA, Jansen Steur EN, Braak E. Staging of brain pathology related to sporadic Parkinson's disease. Neurobiol Aging 2003; 24:197-211; PMID:12498954; http://dx.doi.org/10.1016/S0197-4580(02)00065-9
- Li JY, Englund E, Widner H, Rehncrona S, Bjorklund A, Lindvall O, Brundin P. Characterization of Lewy body pathology in 12- and 16-year-old intrastriatal mesencephalic grafts surviving in a patient with Parkinson's disease. Mov Disord 2010; 25:1091-6; PMID:20198645; http://dx.doi.org/10.1002/mds.23012
- Diogenes MJ, Dias RB, Rombo DM, Vicente Miranda H, Maiolino F, Guerreiro P, Näsström T, Franquelim HG, Oliveira LM, Castanho MA, et al. Extracellular alpha-synuclein oligomers modulate synaptic transmission and impair LTP via NMDA-receptor activation. J Neurosci 2012; 32:11750-62; PMID:22915117; http://dx.doi.org/10.1523/JNEUROSCI.0234-12.2012
- Angot E, Steiner JA, Lema Tome CM, Ekstrom P, Mattsson B, Bjorklund A, Brundin P. Alpha-synuclein cell-to-cell transfer and seeding in grafted dopaminergic neurons in vivo. PloS One 2012; 7:e39465; PMID:22737239; http://dx.doi.org/10.1371/journal.pone.0039465
- Hansen C, Angot E, Bergstrom AL, Steiner JA, Pieri L, Paul G, Outeiro TF, Melki R, Kallunki P, Fog K, et al. alpha-Synuclein propagates from mouse brain to grafted dopaminergic neurons and seeds aggregation in cultured human cells. J Clin Invest 2011; 121:715-25; PMID:21245577; http://dx.doi.org/10.1172/JCI43366
- Luk KC, Kehm V, Carroll J, Zhang B, O’Brien P, Trojanowski JQ, Lee VM. Pathological alpha-synuclein transmission initiates Parkinson-like neurodegeneration in nontransgenic mice. Science 2012; 338:949-53; PMID:23161999; http://dx.doi.org/10.1126/science.1227157
- Luk KC, Kehm VM, Zhang B, O’Brien P, Trojanowski JQ, Lee VM. Intracerebral inoculation of pathological alpha-synuclein initiates a rapidly progressive neurodegenerative alpha-synucleinopathy in mice. J Exp Med 2012; 209:975-86; PMID:22508839; http://dx.doi.org/10.1084/jem.20112457
- Lee HJ, Patel S, Lee SJ. Intravesicular localization and exocytosis of alpha-synuclein and its aggregates. J Neurosci 2005; 25:6016-24; PMID:15976091; http://dx.doi.org/10.1523/JNEUROSCI.0692-05.2005
- Danzer KM, Ruf WP, Putcha P, Joyner D, Hashimoto T, Glabe C, Hyman BT, McLean PJ. Heat-shock protein 70 modulates toxic extracellular alpha-synuclein oligomers and rescues trans-synaptic toxicity. FASEB J 2011; 25:326-36; PMID:20876215; http://dx.doi.org/10.1096/fj.10-164624
- Desplats P, Lee HJ, Bae EJ, Patrick C, Rockenstein E, Crews L, Spencer B, Masliah E, Lee SJ. Inclusion formation and neuronal cell death through neuron-to-neuron transmission of alpha-synuclein. Proc Natl Acad Sci U S A 2009; 106:13010-5; PMID:19651612; http://dx.doi.org/10.1073/pnas.0903691106
- Lee HJ, Suk JE, Patrick C, Bae EJ, Cho JH, Rho S, Hwang D, Masliah E, Lee SJ. Direct transfer of alpha-synuclein from neuron to astroglia causes inflammatory responses in synucleinopathies. J Biol Chem 2010; 285:9262-72; PMID:20071342; http://dx.doi.org/10.1074/jbc.M109.081125
- McLean PJ, Kawamata H, Hyman BT. Alpha-synuclein-enhanced green fluorescent protein fusion proteins form proteasome sensitive inclusions in primary neurons. Neuroscience 2001; 104:901-12; PMID:11440819; http://dx.doi.org/10.1016/S0306-4522(01)00113-0
- Engelender S, Kaminsky Z, Guo X, Sharp AH, Amaravi RK, Kleiderlein JJ, Margolis RL, Troncoso JC, Lanahan AA, Worley PF, et al. Synphilin-1 associates with alpha-synuclein and promotes the formation of cytosolic inclusions. Nat Genet 1999; 22:110-4; PMID:10319874; http://dx.doi.org/10.1038/8820
- Wakabayashi K, Engelender S, Yoshimoto M, Tsuji S, Ross CA, Takahashi H. Synphilin-1 is present in Lewy bodies in Parkinson's disease. Ann Neurol 2000; 47:521-3; PMID:10762166; http://dx.doi.org/10.1002/1531-8249(200004)47:4%3c521::AID-ANA18%3e3.0.CO;2-B
- Sakamoto M, Uchihara T, Hayashi M, Nakamura A, Kikuchi E, Mizutani T, Mizusawa H, Hirai S. Heterogeneity of nigral and cortical Lewy bodies differentiated by amplified triple-labeling for alpha-synuclein, ubiquitin, and thiazin red. Exp Neurol 2002; 177:88-94; PMID:12429213; http://dx.doi.org/10.1006/exnr.2002.7961
- Shacka JJ, Klocke BJ, Roth KA. Autophagy, bafilomycin and cell death: the “a-B-cs” of plecomacrolide-induced neuroprotection. Autophagy 2006; 2:228-30; PMID:16874105; http://dx.doi.org/10.4161/auto.2703
- Danzer KM, Kranich LR, Ruf WP, Cagsal-Getkin O, Winslow AR, Zhu L, Vanderburg CR, McLean PJ. Exosomal cell-to-cell transmission of alpha synuclein oligomers. Mol Neurodegener 2012; 7:42; PMID:22920859; http://dx.doi.org/10.1186/1750-1326-7-42
- Masliah E, Rockenstein E, Veinbergs I, Mallory M, Hashimoto M, Takeda A, Sagara Y, Sisk A, Mucke L. Dopaminergic loss and inclusion body formation in alpha-synuclein mice: implications for neurodegenerative disorders. Science 2000; 287:1265-9; PMID:10678833; http://dx.doi.org/10.1126/science.287.5456.1265
- Johnstone RM, Mathew A, Mason AB, Teng K. Exosome formation during maturation of mammalian and avian reticulocytes: evidence that exosome release is a major route for externalization of obsolete membrane proteins. J Cell Physiol 1991; 147:27-36; PMID:2037622; http://dx.doi.org/10.1002/jcp.1041470105
- Eskelinen EL. Maturation of autophagic vacuoles in Mammalian cells. Autophagy 2005; 1:1-10; PMID:16874026; http://dx.doi.org/10.4161/auto.1.1.1270
- Cocucci E, Racchetti G, Meldolesi J. Shedding microvesicles: artefacts no more. Trends Cell Biol 2009; 19:43-51; PMID:19144520; http://dx.doi.org/10.1016/j.tcb.2008.11.003
- Simpson RJ, Jensen SS, Lim JW. Proteomic profiling of exosomes: current perspectives. Proteomics 2008; 8:4083-99; PMID:18780348; http://dx.doi.org/10.1002/pmic.200800109
- Fader CM, Colombo MI. Autophagy and multivesicular bodies: two closely related partners. Cell Death Differ 2009; 16:70-8; PMID:19008921; http://dx.doi.org/10.1038/cdd.2008.168
- Giasson BI, Murray IV, Trojanowski JQ, Lee VM. A hydrophobic stretch of 12 amino acid residues in the middle of alpha-synuclein is essential for filament assembly. J Biol Chem 2001; 276:2380-6; PMID:11060312; http://dx.doi.org/10.1074/jbc.M008919200
- Xiang W, Schlachetzki JC, Helling S, Bussmann JC, Berlinghof M, Schaffer TE, Marcus K, Winkler J, Klucken J, Becker CM, et al. Oxidative stress-induced posttranslational modifications of alpha-synuclein: Specific modification of alpha-synuclein by 4-hydroxy-2-nonenal increases dopaminergic toxicity. Mol Cell Neurosci 2013; 54:71-83; PMID:23369945; http://dx.doi.org/10.1016/j.mcn.2013.01.004
- Winner B, Jappelli R, Maji SK, Desplats PA, Boyer L, Aigner S, Hetzer C, Loher T, Vilar M, Campioni S, et al. In vivo demonstration that alpha-synuclein oligomers are toxic. Proc Natl Acad Sci U S A 2011; 108:4194-9; PMID:21325059; http://dx.doi.org/10.1073/pnas.1100976108
- Lee HJ, Khoshaghideh F, Patel S, Lee SJ. Clearance of alpha-synuclein oligomeric intermediates via the lysosomal degradation pathway. J Neurosci 2004; 24:1888-96; PMID:14985429; http://dx.doi.org/10.1523/JNEUROSCI.3809-03.2004
- Danzer KM, Krebs SK, Wolff M, Birk G, Hengerer B. Seeding induced by alpha-synuclein oligomers provides evidence for spreading of alpha-synuclein pathology. J Neurochem 2009; 111:192-203; PMID:19686384; http://dx.doi.org/10.1111/j.1471-4159.2009.06324.x
- Emmanouilidou E, Elenis D, Papasilekas T, Stranjalis G, Gerozissis K, Ioannou PC, Vekrellis K. Assessment of alpha-synuclein secretion in mouse and human brain parenchyma. PloS One 2011; 6:e22225; PMID:21779395; http://dx.doi.org/10.1371/journal.pone.0022225
- Lee HJ, Cho ED, Lee KW, Kim JH, Cho SG, Lee SJ. Autophagic failure promotes the exocytosis and intercellular transfer of alpha-synuclein. Exp Mol Med 2013; 45:e22; PMID:23661100; http://dx.doi.org/10.1038/emm.2013.45
- Emmanouilidou E, Melachroinou K, Roumeliotis T, Garbis SD, Ntzouni M, Margaritis LH, Stefanis L, Vekrellis K. Cell-produced alpha-synuclein is secreted in a calcium-dependent manner by exosomes and impacts neuronal survival. J Neurosci 2010; 30:6838-51; PMID:20484626; http://dx.doi.org/10.1523/JNEUROSCI.5699-09.2010
- Bae EJ, Lee HJ, Rockenstein E, Ho DH, Park EB, Yang NY, Desplats P, Masliah E, Lee SJ. Antibody-aided clearance of extracellular alpha-synuclein prevents cell-to-cell aggregate transmission. J Neurosci 2012; 32:13454-69; PMID:23015436; http://dx.doi.org/10.1523/JNEUROSCI.1292-12.2012
- Lee SJ, Desplats P, Sigurdson C, Tsigelny I, Masliah E. Cell-to-cell transmission of non-prion protein aggregates. Nat Rev Neurol 2010; 6:702-6; PMID:21045796; http://dx.doi.org/10.1038/nrneurol.2010.145
- Guo JL, Covell DJ, Daniels JP, Iba M, Stieber A, Zhang B, Riddle DM, Kwong LK, Xu Y, Trojanowski JQ, et al. Distinct alpha-synuclein strains differentially promote tau inclusions in neurons. Cell 2013; 154:103-17; PMID:23827677; http://dx.doi.org/10.1016/j.cell.2013.05.057
- Luk KC, Song C, O’Brien P, Stieber A, Branch JR, Brunden KR, Riddle DM, Kwong LK, Xu Y, Trojanowski JQ, et al. Exogenous alpha-synuclein fibrils seed the formation of Lewy body-like intracellular inclusions in cultured cells. Proc Natl Acad Sci U S A 2009; 106:20051-6; PMID:19892735; http://dx.doi.org/10.1073/pnas.0908005106
- Fellner L, Irschick R, Schanda K, Reindl M, Klimaschewski L, Poewe W, Wenning GK, Stefanova N. Toll-like receptor 4 is required for alpha-synuclein dependent activation of microglia and astroglia. Glia 2013; 61:349-60; PMID:23108585; http://dx.doi.org/10.1002/glia.22437
- Hasegawa T, Konno M, Baba T, Sugeno N, Kikuchi A, Kobayashi M, Miura E, Tanaka N, Tamai K, Furukawa K, et al. The AAA-ATPase VPS4 regulates extracellular secretion and lysosomal targeting of alpha-synuclein. PloS One 2011; 6:e29460; PMID:22216284; http://dx.doi.org/10.1371/journal.pone.0029460
- Huttner HB, Corbeil D, Thirmeyer C, Coras R, Kohrmann M, Mauer C, Kuramatsu JB, Kloska SP, Doerfler A, Weigel D, et al. Increased membrane shedding–indicated by an elevation of CD133-enriched membrane particles–into the CSF in partial epilepsy. Epilepsy Res 2012; 99:101-6; PMID:22130040; http://dx.doi.org/10.1016/j.eplepsyres.2011.10.029
- Doeuvre L, Plawinski L, Toti F, Angles-Cano E. Cell-derived microparticles: a new challenge in neuroscience. J Neurochem 2009; 110:457-68; PMID:19457085; http://dx.doi.org/10.1111/j.1471-4159.2009.06163.x
- Alvarez-Erviti L, Seow Y, Schapira AH, Gardiner C, Sargent IL, Wood MJ, Cooper JM. Lysosomal dysfunction increases exosome-mediated alpha-synuclein release and transmission. Neurobiol Dis 2011; 42:360-7; PMID:21303699; http://dx.doi.org/10.1016/j.nbd.2011.01.029
- Fader CM, Sanchez D, Furlan M, Colombo MI. Induction of autophagy promotes fusion of multivesicular bodies with autophagic vacuoles in k562 cells. Traffic 2008; 9:230-50; PMID:17999726; http://dx.doi.org/10.1111/j.1600-0854.2007.00677.x
- Savina A, Fader CM, Damiani MT, Colombo MI. Rab11 promotes docking and fusion of multivesicular bodies in a calcium-dependent manner. Traffic 2005; 6:131-43; PMID:15634213; http://dx.doi.org/10.1111/j.1600-0854.2004.00257.x
- Breitinger U, Breitinger HG, Bauer F, Fahmy K, Glockenhammer D, Becker CM. Conserved high affinity ligand binding and membrane association in the native and refolded extracellular domain of the human glycine receptor alpha1-subunit. J Biol Chem 2004; 279:1627-36; PMID:14593111; http://dx.doi.org/10.1074/jbc.M303811200
- Sasahara M, Fries JW, Raines EW, Gown AM, Westrum LE, Frosch MP, Bonthron DT, Ross R, Collins T. PDGF B-chain in neurons of the central nervous system, posterior pituitary, and in a transgenic model. Cell 1991; 64:217-27; PMID:1986868; http://dx.doi.org/10.1016/0092-8674(91)90223-L
- Rockenstein E, Mallory M, Hashimoto M, Song D, Shults CW, Lang I, Masliah E. Differential neuropathological alterations in transgenic mice expressing alpha-synuclein from the platelet-derived growth factor and Thy-1 promoters. J Neurosci Res 2002; 68:568-78; PMID:12111846; http://dx.doi.org/10.1002/jnr.10231