
Abstract
Magnetic force microscopy (MFM) is an atomic force microscopy (AFM) based technique in which an AFM tip with a magnetic coating is used to probe local magnetic fields with the typical AFM spatial resolution, thus allowing one to acquire images reflecting the local magnetic properties of the samples at the nanoscale. Being a well established tool for the characterization of magnetic recording media, superconductors and magnetic nanomaterials, MFM is finding constantly increasing application in the study of magnetic properties of materials and systems of biological and biomedical interest. After reviewing these latter applications, three case studies are presented in which MFM is used to characterize: (i) magnetoferritin synthesized using apoferritin as molecular reactor; (ii) magnetic nanoparticles loaded niosomes to be used as nanocarriers for drug delivery; (iii) leukemic cells labeled using folic acid-coated core-shell superparamagnetic nanoparticles in order to exploit the presence of folate receptors on the cell membrane surface. In these examples, MFM data are quantitatively analyzed evidencing the limits of the simple analytical models currently used. Provided that suitable models are used to simulate the MFM response, MFM can be used to evaluate the magnetic momentum of the core of magnetoferritin, the iron entrapment efficiency in single vesicles, or the uptake of magnetic nanoparticles into cells.
Introduction
The remarkable outbreak of nanotechnologies - and among these of nanobiotechnologies - has been allowed by the invention, development, continuous improvement of different techniques and instrumentations for the imaging of materials and systems at the nanoscale. Among such techniques, atomic force microscopy (AFM) represents a well established technique for the imaging of a wide range of samples as it requires minimal sample preparation and allows one to image the samples in air, liquid environment, or vacuum. In AFM, the sample is imaged by scanning it using a sharp tip placed at the end of a micromachined cantilever, the deflection of which is monitored through an optical lever system. The sample morphology can be reconstructed by recording the cantilever deflection during the scanning (contact mode) and in this case the
interaction between the tip and the sample surface is continuous during the scanning. In order to reduce the tip-sample interaction time and thus the possibility of damaging the sample and contaminating the tip, which are serious limitations when imaging soft samples like polymers or biological materials, the sample morphology can be reconstructed also by monitoring the oscillation amplitude of the cantilever set into vibration. In this second case, the tip-sample interaction is limited to a fraction of the period of oscillation of the cantilever (intermittent contact or tapping mode). The unique possibility of ‘touching’ instead that ‘seeing’ the surface offered by AFM has stimulated the development of a wide number of techniques for the characterization of different functional properties beyond the topographical reconstruction. Indeed, force spectroscopy, qualitative imaging, and quantitative mapping can be performed to characterize mechanical,Citation1-Citation3 electric,Citation4-Citation9 electromechanical,Citation10-Citation13 magnetic,Citation14 chemical,Citation15-Citation17 thermalCitation18-Citation21 properties surfaces and materials with nanometrical lateral resolution. Among these techniques, magnetic force microscopy (MFM) has been proposed for the imaging of magnetic domains at the nanoscale.Citation22-Citation24 Although the use of MFM for the qualitative magnetic characterization and manipulation of inorganic materials has been widely explored,Citation25 only recently efforts have been targeted to the extraction of quantitative information from MFM images, also due to the difficulties in developing suitable theoretical models. Moreover, notwithstanding the increasing use of magnetic nanomaterials, e.g., magnetic nanoparticles (MNPs), in biological systems, the potentiality of MFM for biological and biomedical applications has been only marginally explored. In this work, principles of MFM are briefly illustrated and some applications in biology and biomaterials are reviewed. Then, three case studies (single magnetoferritin
molecules, MNPs loaded niosomes, and in vitro cell labeling with functionalized core shell MNPs) are discussed using both a qualitative and a quantitative approach. The presented case studies have been chosen for different reasons which deal with: (i) their diffusion and establishment in the scientific community; (ii) the characteristic lengths of the involved biological systems; (iii) the location of the MNPs. As for the diffusion and establishment in the scientific community, the proposed case studies illustrate uses of MFM either relatively well established MFM (imaging of ferritin), at the beginning of their exploration (imaging of MNPs-cells systems), or never proposed (imaging MNPs inside vesicles). As for the involved characteristic lengths, the proposed case studies represent biological systems with three different characteristic length, i.e., some nanometers (magnetoferritin molecules), a few hundreds of nanometers (niosomes), and some microns (cells). Finally, as for the location of MNPs, the proposed case studies analyze different locations of the MNPs in the systems, i.e., inside the systems and not directly accessible(nanometrical MNPs localized in the core of molecules as well as some tens of nanometers MNPs into vesicles), or on their surface as in the case of cells.
Magnetic force microscopy
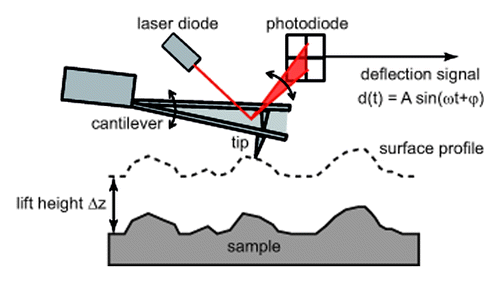
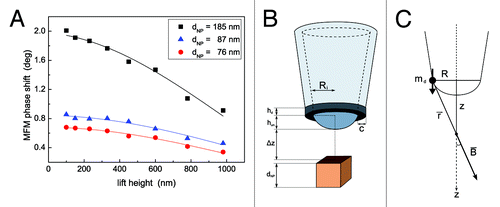
Different experimental configurations of MFM setups have been proposed which differ for the scanning mode used for the topographical reconstruction (either contact or tapping mode) and for the signal monitored for the magnetic imaging of the sample (either the cantilever static deflection or frequency/phase shift, the latter in the resonant MFM). For the sake of simplicity, in the following only the resonant MFM is described as it is approach used in this work and the most widespread technique used for AFM based magnetic imaging due to its unique sensitivity and to the reduced risk of damaging the magnetic coating of the tips. Also, since it requires the use of tapping mode, it is the most suitable technique for the characterization of biological soft samples. In MFM the sample surface is investigated using a standard Si tip coated with a few tens of nanometers thick magnetic layer. In the first step, the morphology of the sample is reconstructed as in standard AFM tapping mode. After the profile of each line is acquired, it is used to perform a second scan of the surface at fixed tip-sample distance (lift mode), also referred to as the lift height Δz, as sketched in . At such values of Δz, only the long range tip-sample interaction forces (i.e., electrostatic and magnetic) affect the cantilever motion. In the second step, the cantilever is set into oscillation at (or near) its first free resonance frequency f0. Due to its magnetic coating, in presence of magnetized samples the tip experiences a force, the component of which normal to the surface is Fz having assumed the z axis normal to the sample surface. Such a force produces a variation in the amplitude A and a shift in the phase φ of the oscillation of the cantilever as well as in its first resonance frequency f0 given byCitation26
Figure 1. Schematic representation of the experimental setup and working principle of MFM.
(1)
(2)
(3)
where kc and Qc are the cantilever spring constant and the quality factor of the cantilever first resonance in air and A0 is the amplitude at the resonance frequency f0 in air and without external forces. In MFM common setups, the magnetic images are obtained in lift mode by recording the values of Δφ and/or Δf0.
A short review of applications
Since its first description,Citation22-Citation24 due to the unique combination of its high resolution imaging capability at the nanoscale and its high sensitivity to localized magnetic fields with nanometrical spatial resolution, MFM has been successfully employed in the study of the micro- and nano-magnetic properties of a wide range of materials. As natural applications, MFM has been widely used in the study of magnetic recording media,Citation27,Citation28 superconductors, and MNPs.Citation29,Citation30 Limiting the discussion to the materials of interest in this paper, recently standard floppy disks have been used in the demonstration of a MFM based method for the indirect measurement of the thickness of soft organic and biological thin films which requires the use of substrates with periodic magnetic domains.Citation31 MFM found wide application in the study of purely organic or hybrid organic/inorganic materials with magnetic properties, from single moleculesCitation32,Citation33 to filmsCitation34-Citation36 or, more recently, MNPs encapsulated magnetic nanohydrogels.Citation37 Also, MFM has been used to study Fe3O4 NPs assembled into magnetic nanowires using DNA molecules as molecular scaffolds.Citation38
Hsieh et al.Citation39 have recently used MFM to visualize ferritin molecules, to detect their iron oxide core and to quantitatively evaluate the corresponding magnetic moment. Martinez et al.Citation40 employed MFM to confirm the magnetic properties of iron oxide core of patterned ferritin molecules after reducing its size from 8 to 2 nm by O2 plasma etching. Dietz et al.Citation41 used a bimodal AFM technique sensitive to mechanical and magnetic tip-sample interactions to distinguish and identify single apoferritin and ferritin molecules both in air and in liquid. Finally, AFM tips were functionalized by attaching on their apex a single ferritin molecule thus realizing probes sensitive to magnetic forces as well as to biomolecular interactions with DNA on surfaces.Citation42 MFM has been used to study biogenic magnetite nanoparticles (magnetosomes) extracted from or directly in magnetotactic bacteria.Citation43-Citation48 More interestingly, micrometer sized clusters of biogenic magnetic nanomaterials have been detected in human hippocampus using MFM.Citation49,Citation50 In this field, from our point of view AFM/MFM represents a powerful technique to be included in the set of microscopy based approaches (which include also electron or synchrotron X-rays microscopy) for the micro- and nano-scale mapping of nanomaterials in biological samples and animal and human tissues in order to back studies on neurodegenerative disease and other age related pathologiesCitation51-Citation53 as well as in nanotoxicology researches.Citation54,Citation55
MFM can be used to detect biomolecules by labeling them with magnetic nanomaterials conjugated to specific antigens, and therefore used as magnetic markers. Amemiya et al.Citation56 used MFM for the detection of streptavidin on glass surfaces using magnetosomes conjugated with biotin, observing a sensitivity of MFM 100 times higher than that of conventional fluorescent detection systems. Moskalenko et al.Citation57 have recently reported the use of MFM to investigate the spatial distribution of endothelin receptors on the surface
of biotinylated smooth muscle cells from Wistar rats by detecting anti-biotin coated microbeads.
Finally, MFM represents a promising technique to study the cellular uptake of MNPs, which requires minimal sample preparation and thus can be a powerful alternative to transmission electron microscopy (TEM). Pioneering studies in this sense have been focused on the study of the interaction between MNPs and cancer cells. Shen et al.Citation58 used MFM to analyze the uptake of antisense oligonucleotides coupled silica coated iron oxide MNPs into human leukemia cells and to study the consequent induced apoptosis. Zhang et
al.Citation59 mapped the uptake of MNPs into human breast carcinoma epithelial cells, stressing how the quantification from MFM images of statistics of aggregation size and depth under the cell membrane is still a challenge which requires the development of suitable models to simulate the MFM response and accurate experimental studies. Following this outlined direction, Wang et al.Citation60 have recently reported the MFM study of several human cancer cell lines labeled with iron oxide MNPs, where MFM images were analyzed using a simplified mathematical model to evaluate the iron content in single cells which was found in fairly good agreement with quantitative colorimetric iron assay results.
Results and Discussion
Magnetoferritin molecules
As a first example of application, MFM was used to verify the production of magnetoferritin from apoferritin. Ferritin from Pyrococcus furiosus was used as spherical protein to stabilize magnetic iron nanoparticles. Ferritin represents a noteworthy class of proteins the primarily function of which is to sequester iron as ferrihydrite. All ferritins consist of 24 subunits which self-assemble in a cage-like structure with a well defined inner and outer diameter of 8 nm and 12 nm, respectively.Citation61 These proteins occur in a wide variety of organisms, from prokaryotes to mammals. In particular, the ferritin from the Archeon, hyperthermophilic, and anaerobe P. furiosus is characterized by high thermal stability which enables easy purification and wider application conditions.Citation62,Citation63 The ferritin cage is an optimal environment to grow NPs with controlled dimensions.Citation64,Citation65 However, it is first necessary to remove the Fe originally contained by reducing the metallic core in an anaerobic environment, followed by chelation of the free, reduced Fe with an appropriate ligand, and by extensive dialysis. AFM and MFM have been used to verify the effectiveness of such a process.
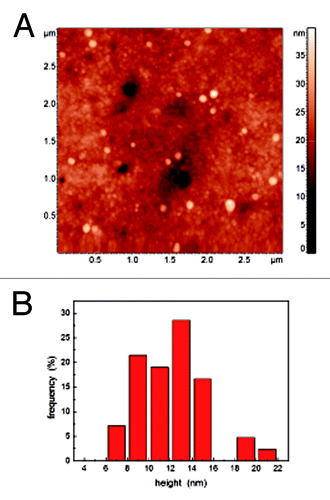
AFM topographical images have been used to analyze shape and dimension of the magnetoferritin molecules. As an example, in the topography of an area with size 3x3 μm2 is reported where magnetoferritin molecules (the circular features which appear brighter, i.e., which are higher, than the substrate) are clearly visible. To analyze their dimension, the height of different molecules (corresponding to the molecule diameter) observed on randomly selected areas have been measured, the obtained statistics being reported in from which the diameter of magnetoferritin molecules can be evaluated as 11 ± 3 nm. It should be noted that the presence of residuals of the buffer on the substrate prevents one from more accurately evaluating the molecules height. As a result, the bare analysis of the molecules height obtained with standard AFM topographical reconstruction does not allow us to definitely distinguish between magnetoferritin and apoferritin, the diameters of which have been reported as high as 10 nm and 12 nm, respectively.Citation66
Figure 2. (A) Typical AFM topographic reconstruction of magnetoferritin molecules on Si substrate. (B) Statistics of the distribution of the molecules diameter obtained from images of different areas of the sample.
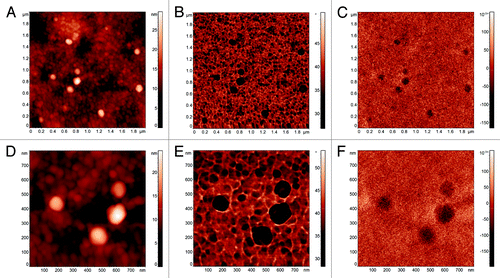
An example of AFM/MFM characterization of magnetoferritin molecules on a selected area is reported in , which has been performed by acquiring the topography () and the standard phase image () during the first pass in tapping mode and the MFM phase image in the second pass (). A detail of the area (800 × 800 nm2), where four magnetoferritin molecules are visible, is reported in (topography), 3e (standard phase image), and 3f (MFM phase image). The characterization of the same area has been repeated several times with different values of lift height Δz in the range 15–100 nm. In particular, shows the topography of an area with size 2 × 2 μm2 where magnetoferritin molecules are visible, the lateral dimensions of which appear wider than their real ones are due to the convolution effect with the tip shape. Indeed, from the curvature radius of the coated tip (namely, Rct where Rct = Rt+c being Rt the radius of the uncoated AFM tip and c the thickness of the magnetic coating) can be estimated in the range 110–280 nm, significantly higher than that reported by the producer for a new tip. In order to confirm such values, scanning electron microscopy (SEM) coupled with energy dispersive X-ray (EDX) spectroscopy and mapping has been used to image the tips we used, revealing values of Rct as high as a few hundreds of nanometers. Simultaneously to the topographical reconstruction, the standard phase image is acquired which is reported in . Despite showing a relevant contrast in correspondence of the magnetoferritin molecules (about 10 deg), phase images do not allow one to definitely distinguish between the molecules and the substrate. Indeed, in tapping mode where cantilever oscillation amplitude is maintained constant by the AFM feedback loop, such a contrast reflects variations in the energy dissipation during a cycle of tapping.Citation67,Citation68 Therefore, the contrast in may suggest the presence on the substrate around the molecules of residuals of apoferritin. Conversely, a clear contrast in correspondence of the magnetoferritin molecules is observed in the MFM phase image obtained with Δz = 15 nm, which is reported in , which unambiguously demonstrates the presence of magnetic material in the core of the molecules. Therefore, MFM phase images confirm presence of a magnetic core in the molecules, and thus the production of magnetoferritin from apoferritin.
Figure 3. AFM standard tapping mode topographical reconstruction of and area of the magnetoferritin sample (A) with the corresponding tapping mode phase image (B) and MFM phase image (C). A detail of four magnetoferritin molecules showing the topography (D), the tapping mode phase image (E) and the MFM phase image (F).
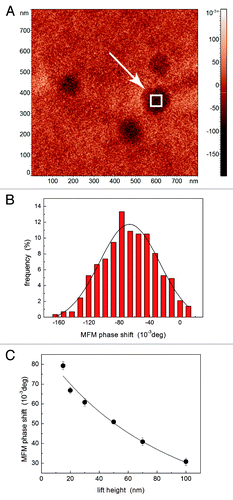
In order to quantitatively analyze MFM measurements, for each magnetoferritin molecule the maximum value of the MFM phase shift was evaluated by selecting a small area in correspondence of the top of the molecule (as illustrated in , where the square corresponding to the selected area is actually enlarged for the sake of clearness) and determining the mean value and the standard deviation of the MFM phase shift from the Gaussian fit of the obtained histogram, as exemplified in . Such a procedure has been repeated for each magnetoferritin molecule and for each value of lift height Δz. For each magnetoferritin molecule, the MFM phase shift has been plotted as a function of Δz, as illustrated in . In accordance with a relatively well established approach,Citation29,Citation42 MFM phase shift data can be analyzed by describing both the tip and MNPs as magnetic dipoles. In particular, as far as the MNPs are regarded, such an assumption is reasonable in consideration of their negligible dimensions with respect to the decay length of the magnetic field along z axis. In such an approximation, the MFM phase shift is the gradient of the magnetic interaction force between to magnetic dipoles the moments of which are aligned along the same z axis and is given by the equation
Figure 4. Example of the quantitative analysis of MFM images of magnetoferritin. In a MFM image (A), the phase values corresponding to the center of a molecule are analyzed to obtain the MFM phase shift (B). For each molecule, the value of the MFM phase shift is plotted as a function of the lift height (C): the experimental data (symbols) are fitted using the model in Eq. (5) (solid line).
(4)
where: μ0 is the vacuum magnetic permeability; kc and Qc are the spring constant and the quality factor of the cantilever, respectively; ms and mct are the magnetic moments of the nanoparticle and the coated tip, respectively; Δz+hts is the distance between the magnetic centers of the tip and the sample during the second pass. As an example, if both the sample and the tip can be modeled as spheres, hts = d/2+s+Rct+δ where d and s are the diameter of the magnetic core and the thickness of the nonmagnetic shell of magnetoferritin molecule, respectively, and δ is amplitude of the cantilever oscillation in the first pass.Citation29 As for mct, it can be approximated as, where Mc is the saturation magnetization of the magnetic coating of the tip.Citation29 For the sake of simplicity, Eq. (4) can be rewritten as
(5)
Having introduced the parameter A defined as
(6)
For each magnetoferritin molecule, experimental Δφ vs. Δz data have been analyzed using Eq. (5), as exemplified in (solid line), thus obtaining the best fitting values of hts and A. As for the former, hts = 210 ± 15 nm is obtained, which is coherent with the values of Rct observed with blind reconstruction and SEM analysis. As for the latter, A = (4 ± 1) x 10−35 mCitation5deg is calculated. For comparison, an approximated theoretical value of A can be roughly calculated from Eq. (6) as follows. Qc/kc ≈100 can be assumed. Being mct ≈10−16 AmCitation2 reported by the producer for a brand new tip (Rct = 35 nm and c = 25 nm are reasonable values), assuming the same value of c and the measured values of Rct, its actual value can be estimated as 100 x 10−16 AmCitation2, which is the case of our tips. If the theoretical value for maghemite is assumed for ms,Citation66 the approximated value of A ≈1 x 10⁻³⁵ mCitation5deg is obtained, in good agreement with our experimental data. We would explicitly note that the overestimation of A is expected as nonmagnetic (e.g, electrostatic) effects give a not negligible contribution to the MFM signal roughly as high as 40% of the total MFM signal which with the present experimental setup we are not able to reduce, as detailed in Materials and Methods section.Citation69-Citation71 It is worth mentioning that, if the experimental values of ms observed for magnetoferritin are assumed,Citation66 A ≈6 x 10−37 mCitation5deg is calculated which is significantly lower than the value we experimentally determined. Really, the main contribution to the uncertainty in MFM quantitative analysis results from that in the magnetic properties of the tip. Therefore, although in recent years MFM has been used to quantitatively study the magnetic properties of ferritin and nanometer sized MNPs,Citation29,Citation39,Citation41,Citation42 in order to definitely assess the magnetic properties of magnetoferritin and other molecules at the nanoscale the value of mct should be calibrated using a reference sample. Recently, an approach has been proposed in which such a calibration is performed for a fixed value of Δz using MNPs with traceably determined magnetization dispersed on a Si surface as a MFM reference sample.Citation30 Following the approach illustrated in this work, using a suitable MFM reference sample to experimentally determine the parameters A and hts would result in the calibration of mct – relatively independently of the used values of lift height – and thus in the capability of MFM of quantitatively measuring the magnetic momentum of single MNPs with nanometrical lateral resolution. As a final consideration, we would notice that the measurements on magnetoferritin can be used to retrieve information on the sensitivity of our technique. Indeed, with the present experimental setup and with the used tips, due to the noise in correspondence of nonmagnetic substrate we can hardly detect MFM phase shifts smaller than 30 mdeg. Therefore, MNPs with diameter of a few nanometers like the core of magnetoferritin molecules can detected up to a tip-sample distance of 100 nm while at larger lift heights these MNPs are hardly detectable. Apparently, such a request on the limit in the lift height is easy to satisfy as in MFM characterizations the investigated MNPs are generally deposited on the surface of flat nonmagnetic substrates. Nevertheless, such a limit implies that a few nanometers thick MNPs buried under the surface of samples cannot be visualized unless they are located close to the interface. Thus, it represents a severe limitation to be overcome in order to the use MFM for the subsurface imaging of buried MNPs, e.g., in the case of MNPs internalized in cells.
Magnetic nanoparticles in vesicles
Vesicular systems - and among them niosomes, which are non-ionic surfactant vesicles - have attracted constantly increasing attention for drug delivery applications.Citation72,Citation73 In particular, different configurations have been engineered where vesicles are coupled with magnetic nanomaterials (e.g., Fe based nanoshells or MNPs) to be employed as magnetically guided nanocarries.Citation74,Citation75 To this aim, referring to the inclusion of Fe based MNPs in niosomes, the Fe entrapment efficiency (e.e.) represents a critical parameter in terms of both the overall Fe content and the uniformity of Fe content in different vesicles of the sample. While the overall Fe content can be determined through different techniques such as inductively coupled plasma mass spectrometry (ICP-MS), microscopy based approaches are required in order to examine the number and the diameter of MNPs into each vesicle and the uniformity of these data in different vesicles of the same batch. Transmission electron microscopy (TEM) can be effectively used to visualized the MNPs inside the vesicles although the sample preparation is not straightforward. Standard AFM enables one to directly visualize the niosomes without any specific sample preparation but the bare deposition on a flat substrate, although their inner remains inaccessible. Conversely, the sensitivity of MFM to MNPs makes it a promising technique which combines the capability of visualizing internalized MNPs and the simple specimen preparation. In this section, this is demonstrated through a AFM/MFM survey of MNPs loaded niosomes: qualitative magnetic imaging of MNPs loaded niosomes is reported and a quantitative approach is illustrated to deduce the diameter of the MNP inside the vesicles. Analyzed vesicular systems were prepared by Tween 20 (Tw20)/Cholesterol mixture and loaded by hydrophilic magnetite nanoparticles.
The size data reported in show that there is not a significant increase of vesicular dimensions after entrapment of MNPs. This is probably related to the preferential partition of hydrophilic MNPs inside vesicular aqueous core. MNPs loaded Tw20 vesicles show a decrease in ζ-potential values; the MNPs could be placed not only in the aqueous core but also on the vesicle surface, inside the PEG coating, eliciting a variation in ζ-potential values with respect to empty vesicles. Dynamic light scattering (DLS) provides also valuable information on the homogeneity of the suspension by the analysis of the PDI values, which in both samples are characteristic of a single population of scattering particles. The e.e. data confirm the presence of MNPs inside vesicular structure and show a good capability of niosomal vesicle to entrap MNPs. To better evaluate the influence of MNPs entrapment on vesicle bilayer, fluorescence analyses were performed in order to evaluate bilayer polarity and microviscosity (). The MNPs encapsulation maintains the IE/IM and I1/I3 values rather constant in the case of Tw20 vesicles-MNPs and Tw20 empty vesicles. This could be related to a non-insertion of hydrophilic MNPs in vesicular bilayer and to a non perturbation of polarity and microviscosity of the bilayer in comparison to empty vesicles.
Table 1. Experimental values of the hydrodynamic diameter (Dh), ζ-potential, polydispersity index (PDI), Fe entrapment efficiency (e.e.), microviscosity and polarity for the empty and MNPs loaded vesicles
Before analyzing the sample of MNPs loaded vesicles, a preliminary AFM/MFM characterization have been performed on isolated MNPs agglomerates deposited on a Si substrate. MNPs agglomerates with different diameter dNP have been imaged at different lift height values Δz (images not shown), thus obtaining a Δφ vs. Δz curve for each MNP cluster. As an example, the experimental curves relative to three agglomerates with diameters 76 nm, 87 nm and 185 nm are reported in . It is worth observing that such curves can be hardly rationalized using the model in Eq. (4). Recently, a more realistic model has been proposed, which includes not only the spherical apex but also the effect of the magnetic material on the tip cone Citation76 which nevertheless does not seem to describe adequately our results. Therefore, we performed SEM characterizations coupled with elemental analysis by EDX of several either new or used MFM tips from different batches. Although different typologies were observed, far more frequently we found that used tips had flattened tips with damaged coatings in correspondence of the apex, the damaged area having dimensions of some hundreds of nanometers, in good agreement with AFM blind reconstruction of the tip. Therefore, we describe the tip as a ring magnetized along the z direction with internal radius Ri , height hr and finite thickness that we assume equal to the thickness of the coating c. The height of the remaining uncoated apex is hun (. To calculate the MFM response, let us consider a magnetic dipole with moment md aligned along the z axis and placed at a distance R from the latter (. This produces a magnetic field, the vertical component of which (Bz) in a point of the z axis at distance r from the dipole is given by
Figure 5. (A) MFM phase shift as a function of lift height for three different agglomerates of the MNPs used to load niosomes. Experimental values of MFM phase shift in correspondence of MNPs agglomerates with different dNP (symbols) have been fitted using the model in EquationEq. (11) (solid lines). (B) Proposed model for the tip described as magnetized ring while the MNP is assumed as a cube. (C) Sketch of the out of axis magnetic dipole producing a magnetic field on the z axis.
Let us suppose that each MNP is constituted of a single magnetic domain and thus with its magnetization reaches the saturation value Msat. For the sake of simplicity, let us assume that the MNP is a cube with side dimension dNP small with respect to Ri so that the magnetic field can be approximated with its value along the axis. The gradient of the force acting on a MNP with volume VNP is
As the MFM phase shift is proportional to the gradient of the force acting on the tip Ft’ = -FNP’, we obtain
Assuming the thickness hr negligible, we can calculate Ft‘ due to the whole ring as
Finally, the MFM phase shift is given by
being. Contrary to Eq. (5), EquationEq. (11) satisfactorily accounts for the dependence of Δφ on Δz (solid lines in . As for the parameters retrieved from the fitting, neglecting hun for the sake of simplicity the value of Ri = 4500 ± 200 nm seems overestimated even if both SEM imaging and AFM tip blind reconstruction indicate a tip radius of some hundreds of nanometers, much bigger than the values reported by the vendor for new tips. Therefore, the calculated value of Ri should be regarded as an ‘effective’ one. As for the parameter A it is found to be almost constant at least for the two smaller agglomerates of 76 and 87 nm. In particular, A = 1110 ± 20 deg is obtained for 76 nm and 87 nm, while for the bigger agglomerate we obtained A = 220 deg. This incongruence can be rationalized considering that for big agglomerates the assumption of a cubic MNP with magnetic field uniform and equal to its value on the axis leads to the overestimation of the interaction force, resulting in the underestimation of the parameter A. A second effect to be considered, due to the absence of the external magnetic field the magnetization of the MNPs is produced by the field of the tip. As discussed in Materials and Methods, this may lead to the magnetization of only a portion of bigger agglomerates and therefore to a reduced ‘apparent’ magnetization of the sample (roughly from our data only one fifth of the agglomerate is effectively magnetized) and thus, again, to the underestimation of A. Therefore, the results reported in represent a further (indirect) confirmation that the tip is not capable of magnetizing big agglomerates. Nonetheless, despite such limitation and being still too approximated, the proposed model describes our experimental results better than that represented by Eq. (5). Also, our results indicate that such MNPs can be detected in a nonmagnetic matrix down to a depth of about 2 µm. Having a diameter of about 200 nm, niosomes represent an ideal sample to demonstrate the capability of MFM of detecting MNPs under the surface of soft materials.
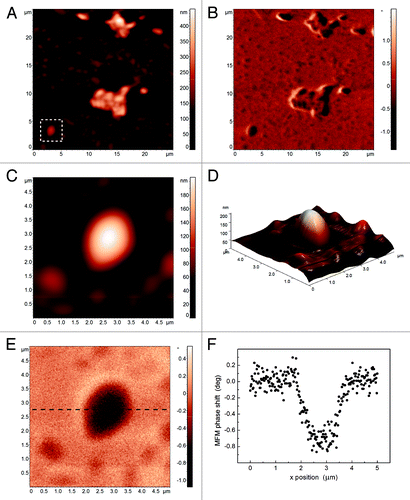
First, empty niosomes were characterized by AFM/MFM (). AFM topographical reconstruction () shows either isolated circular vesicles or groups of elliptical ones, where the not symmetric shape is probably due to the coalescence of two niosomes. Isolated vesicles have a height ranging from 100 to 150 nm (), lower than the diameter measured with DLS as a result of their flattening on the substrate. The corresponding MFM phase image () shows a small, but appreciable above the experimental noise, phase shift (approximately 0.1 deg), the origin of which at present is not completely rationalized but seems to indicate an electrostatic repulsive interaction between the tip and the vesicle surface. The AFM topographical characterization of MNPs loaded niosomes does not highlight differences with the empty ones (), while the MFM phase image shows a significant negative contrast in correspondence of the niosomes (). The top view () and the three dimensional rendering () of an isolated circular vesicle confirm the almost circular shape and the height of 160 nm, so that the bare morphological AFM reconstruction does not allow one to distinguish between empty and MNPs loaded vesicles. Conversely, the MFM phase image () clearly indicates the presence of a magnetic core inside the vesicle. Indeed, as illustrated by the section in the phase shift (about 0.7 deg) is well above the noise level of the image. From such a value of phase shift, the diameter dNP of the MNP inside the vesicle can be roughly estimated as high as 70 nm. Indeed, we can suppose that MNPs are placed at the bottom of the niosome due to their density. As the image is recorded with lift height Δz = 50 nm and the vesicle height is 160 nm, such a diameter implies an actual distance between the tip and the top of the MNPs of 140 nm. From data in , the combination of dNP = 70 nm and the tip-MNPs distance 140 nm corresponds to a MFM phase shift of about 0.7 deg. Considering the dimension of the MNPs, MFM demonstrates the presence of a single MNP inside the niosome in . In conclusion, this case study demonstrates that MFM not only enables one to
Figure 6. AFM topographical image of empty niosomes on the substrate (A) and topography (B) and MFM phase image (C) of the detail of the area in the rectangle.
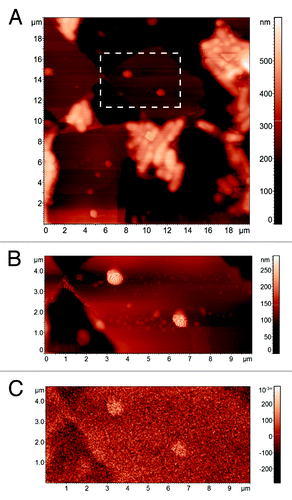
Figure 7. Topography (A) and MFM phase image (B) of MNPs loaded niosomes. Detail of the topography of an isolated niosome (C), its 3D reconstruction (D), the corresponding MFM phase image (E) with a MFM phase profile (F).
detect the presence of MNPs inside vesicles, but it also allows for the quantitative evaluation of the diameter of the MNPs into each niosome providing that the MFM phase response is calibrated on a suitable set of bare MNPs with different diameters and for different values of lift height. As for the model of tip-sample interaction, the reported example clearly demonstrates that the simple dipole-dipole interaction may be a not enough realistic model, leading to a misinterpretation of MFM data.
Superparamagnetic core shell nanoparticles for cell labeling
In the last decade, among the challenging field of nanotechnology, a huge variety of techniques and devices for applications in biology and medical diagnostics has been developed. Among these, nanoparticles emerged as an extremely versatile tool, since their composition and/or functionalization can be adapted to tune their properties. Indeed, these nanomaterials can be considered as multitasking systems able to play different roles in the same contest. For example, magnetite (Fe3O4) nanoparticles are commonly used as contrast agent for magnetic resonance imaging (MRI) for their superparamagnetic properties. However, the same magnetic features allow their confinement and concentration into tissues and organs by means of static magnetic fields. Moreover, the possibility of functionalizing nanoparticles with drugs and biological macromolecules makes them a suitable carrier for pharmacological treatment of different pathologies such as inflammations, bacterial infections and tumors.
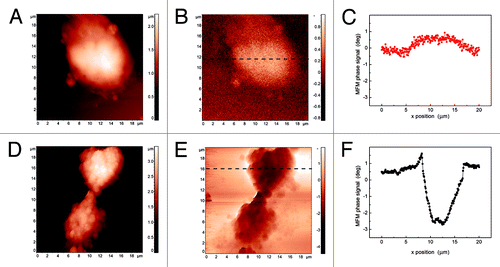
An interesting application of MFM has been performed using superparamagnetic core shell nanoparticles for cell labeling in vitro. For this purpose, we synthesized MNPsCitation77 constituted by a core of magnetite coated with a first shell of metallic Cu and a second shell of metallic Au (Fe3O4@Cu@Au), schematically represented in , which were then further functionalized with folic acid. Folic acid receptors are widely expressed on the membrane surface of all eukaryotic cells. Folic acid enters the biochemical mechanism of the DNA bases synthesis, therefore playing a crucial function for cell life. In transformed cells, i.e. in tumor cells, the number of folate receptors significantly increases because their enhanced proliferative activity requires larger amounts of purine and pyrimidine bases for the synthesis of nucleic acids. The presence of such a huge number of receptors might increase the uptake of folic acid coated MNPsCitation78 that could be then detected using MFM. In this work AFM and MFM were used to highlight the interaction of folic acid-coated MNPs with leukemic cells by exploiting the presence of folate receptors on the cell membrane surface. Besides the Fe3O4@Cu@Au core shell MNPs, the system we designed is characterized by a coating of poly-l-lysine/poly-ethylene-glycol (PLL-PEG) layer anchored throughout a covalent bond with NHS-ester-(R,S)-α-lipoic acid (LA),Citation79 which act as a linker between the surface Au shell and the polymer. To prepare the MNPs we combined and modified synthetic procedures reported in literature.Citation80,Citation81 The experimental evidences obtained show that the magnetite core guarantees the superparamagnetic behavior of the NPsCitation82,Citation83 and acts as condensation nucleus for the co-precipitation of other metals to form a multi phasic nanomaterial. The intermediate shell of Cu ensures a stable coating of MNPs with Au, while Au external coating makes this kind of NPs suitable for biomedical applications. As it is known, gold is a soft acid which reacts with alkanethiols, providing a stable covalent covering of organic molecules on the NPs surface. This layer contributes to particles dispersion in aqueous solution minimizing aggregation. The use of α−ω bifunctionalized alkanethiols containing functional groups such as -NH2, -COOH, -CHO or -NCS gives the additional possibility to obtain a reactive platform for binding a large variety of molecules and macromolecules even of biological interest, e.g., folic acid.Citation84,Citation85 In , a schematic representation of the whole system is reported. As a cell line for our experiments in vitro we chose immortalized and selected T lymphoblastoid leukemia cells (CCRF-CEM), which overexpress the folic acid receptors.Citation86 After 18 h of incubation of CCRF-CEM with acid folic-coated MNPs in RMPI-1640 growth medium, cells were still vital, as demonstrated by vitality test with Trypan blue. For both AFM and MFM a suspension of CEM cells incubated with Fe3O4@Cu@Au-LA-PLL-PEG-folic acid was deposited on p-doped Si (100), dried and fixed with glutaraldehyde. MFM allowed us to detect the presence of magnetic material bound to the folic acid receptors on the cell membrane. shows a typical AFM topographical image of wild-type CCRF-CEM cell. The simultaneously recorded MFM phase image reported in shows a positive MFM phase contrast of about 0.5 deg (see the profile reported in ), in analogy with what observed in the case of empty niosomes. The AFM topographical image of CCRF-CEM cells incubated with Fe3O4@Cu@Au-LAPLL- PEG-folic acid NPs is shown in . The corresponding MFM phase image () clearly exhibits a remarkable negative phase shift of about 3 deg (see the profile reported in ), which indicates the attractive magnetic interaction between the AFM tip and the MNPs bound to the folic acid receptors and forming an almost continuous covering of the cells. Shen et al.Citation58 observed the change in MFM images of MNPs incubated human leukemia cells as a consequence of the reversal of the scanning direction along the ‘slow scan’ axis, i.e., MNPs were detected near the top (bottom) edge of the cell when scanning the surface from top to bottom (from bottom to top), from which they deduced the successful internalization of MNPs into the cells. Conversely, the features of our MFM images remain unaltered if the scanning direction is reversed along the same axis and if the two axes are exchanged (i.e., images acquired from top to bottom and viceversa or from left to right and viceversa). Actually, data we collected do not allow to unequivocally determine whether and in which percentage the NPs have been internalized via the substrate-receptor interaction mediated by folic acid. For the sake of completeness, we must report that in some of our images we observe an effect analogous to the one described by Shen et al.Citation58 Nevertheless, as all the other features of the MFM images remain unvaried, we attribute this effect occasionally observed in our images to artifacts induced by the abrupt change of height at the cells edge.
Figure 8. (A) General scheme of core shell Fe3O4@Cu@Au nanoparticles. (B) Schematic representation of Fe3O4@Cu@Au-LA-PLL-PEG-folic acid nanoparticles.
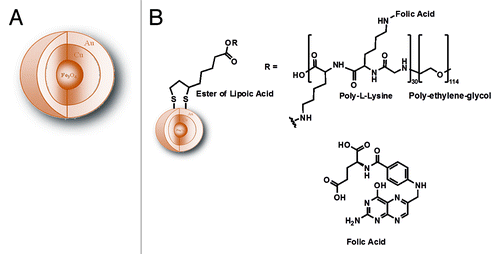
Figure 9. Topography (A), MFM phase image (B) and a MFM phase profile (C) of CCRF-CEM cells. Topography (D), MFM phase image (E) and a MFM phase profile (F) of CCRF-CEM cells incubated with Fe3O4@Cu@Au-LA-PLL-PEG-folic acid NPs.
It is worth noting that the MFM phase shift measured on isolated single MNP and aggregates is significantly lower than that measured on the MNPs labeled CCRF-CEM cells (roughly 0.1 deg for a MNPs aggregate with diameter of 100 nm). This can be rationalized considering that in the case of isolated (spaced enough) (aggregates of) MNPs on a substrate, the MFM phase shift is produced by the interaction with only one MNP magnetized by the tip. Conversely, in our case an almost continuous distribution of MNPs is present. Therefore, the tip senses the magnetic moment of a ‘disk’ with effective radius reff constituted by several MNPs. In particular, if the single MNP with diameter dNP has a momentum mNP and produces a phase shift ΔöNP∝43ðdNP3, a disk of the MNPs with thickness b and radius reff will have an effective momentum meff∝ðreff2b and will produce a phase shift Δφeff roughly given by
For example, assuming that the thickness of the layer coincides with the diameter of one aggregate of MNPs, b = dNP and from Eq. (12) we obtain, which predicts a phase shift compatible with that in for b = 100 nm and supposing the tip magnetizes a disk with radius reff = 600 nm. In the present case, the difficulty in the quantitative analysis of MFM images is due to the numerous and tight distribution of MNPs, which prevents the use of simple analytical models with isolated MNPs treated as punctiform objects. Comparing the MFM phase shift to that of not labeled cells, the experimental setup used in this work seems not adequate to visualize single MNPs internalized far from the cell surface. To this aim, the use of high momentum MFM probes should be taken into consideration.
Materials and Methods
AFM/MFM setup and equipment
AFM/MFM characterizations have been performed using a commercial AFM setup (Solver, NT-MDT, Russia) equipped with standard magnetically coated cantilevers.Citation31 In particular, the analysis of magnetoferritin and niosomes was performed using cantilevers (MESP-RC, Bruker Inc.) with nominal parameters: length L = 125 μm, width w = 30 μm, thickness t = 2 μm, spring constant kc = 5 N/m, first free resonance in air f0 = 170 kHz. The analysis of MNPs labeled cells was performed using cantilevers (MESP, Bruker Inc.) with nominal parameters: length L = 225 μm, width w = 28 μm, thickness t = 3 μm, spring constant kc = 3 N/m, first free resonance in air f0 = 80 kHz. The tips have a magnetic CoCr coating with thickness in the range 25–50 nm (actual composition not specified). Before experiments, MFM tips are magnetized by placing them on a permanent magnet. The correctness of the magnetization is then verified by imaging magnetic reference samples with periodic magnetic domains (i.e., standard floppy disks) as we describe in more details in a previous work [31]. Notably, the topographic images of such reference samples acquired in the first pass do not show any artifact induced by the magnetic signal. MFM relies on the accurate positioning of the tip at fixed distance from the surface during the second pass, which must be the very same at each point of the area. Therefore, if the magnetic signal affected the feedback one, the magnetically induced artifacts would be observed in the topographic reconstruction, analogously to those generated in AFM tapping mode topographic images acquired on mechanically not homogeneous samplesCitation3 or in scanning tunneling microscopy (STM) topographic images acquired on electrically not homogeneous samples .Citation87 Such artifacts may result in errors in the control of the tip-sample distance in the second pass. The absence of magnetically induced topographic artifacts indicates that in the first pass the tip-sample interaction is far bigger than the magnetic one and thus that the latter does not affect the control of the tip sample distance in the second pass.
All the samples were imaged after their deposition on clean flat substrates with roughness negligible with respect to the typical dimensions of the samples. In detail: atomically flat Si single crystals were used as substrates for magnetoferritin; polycrystalline Al2O3 for niosomes; Si single crystals and standard coverslips for MNPs labeled cells. All the measurements were conducted in air and at room conditions without applying an external magnetic field. We would explicitly note that while some authors pointed out the importance of the presence of an external field Citation29, Citation88 when performing MFM images of MNPs, other authors successfully performed MFM experiments without the external field, the magnetization of the MNPs being obtained as the result of the magnetic field produced by the MFM tip.Citation30,Citation70,Citation89,Citation90 In this work, in order to verify if the localized magnetic field produced by our tips were capable of magnetizing the MNPs preliminary tests have been performed using a permanent magnet under the sample. Thus, different configurations were compared (i.e., with or without external field, as well as with the tip magnetization parallel or antiparallel to the external magnetic field). When the tip magnetization was antiparallel to the external field, we observed that at the same tip-sample distance the tip-sample interaction was attractive (negative contrast) on MNPs of about 50–100 nm in diameter, while it is repulsive (positive contrast) on bigger agglomerates of some hundreds of nanometers (unpublished data). We deduced that the localized field of the tip is capable of magnetizing small MNPs, overcoming the effect of the permanent magnet. Nevertheless, as the field rapidly decays as the tip-sample distance increases, only a small portion of big agglomerates is oriented by the field of the tip while they are almost completely magnetized by the external field, which is almost constant on such scales. Therefore, we performed our experiments without the permanent magnet as the tip was capable of magnetizing the MNPs involved in this work. As a final consideration on the experimental setup used in this work, we should discuss the effect of nonmagnetic tip-sample interactions on MFM.Citation69 To this aim, we performed preliminary tests using nonmagnetic Cu NPs. Nevertheless the results of these tests must be considered only just as an indication as different NPs may lead to different effects. We found that the MFM phase shift on nonmagnetic NPs is approximately 40% of that measured on MNPs with the same diameters in the range of those used in this work. This ratio did not seem to vary significantly at different lift heights. Also, we found a sort of ‘saturation’ of this effect in case of big agglomerates of nonmagnetic NPs (unpublished results). As with the experimental setup we used in this work we cannot compensate the nonmagnetic effects as ingeniously done by other authors Citation69–Citation71, the MFM phase shift actually results from both magnetic and nonmagnetic interactions, the latter being the 40% of the total signal. Therefore, the true magnetic signal is about half of the measured one. As the results presented in this work must be considered only as semiquantitative, this limitation does not affect the findings here reported.
Magnetoferritin
Ferritin and apoferritin production was performed accordingly to previously reported procedures.Citation91 In particular, ferritin from P. furiosus was overproduced in E. Coli (gene code: PF0742),Citation62 and purified by a heat step. Apoferritin was prepared by reduction with sodium dithionite, chelation with 2,2’-bipyridine, and dialysis against MES/NaOH buffer 50 mM, pH 8.5. The prepared solution was de-aerated by bubbling nitrogen for 60 min at 60 °C. Furthermore, a FeSO4 solution (50 mM) in HCl/water pH2 was prepared anaerobically. Small aliquots were slowly added to the apoferritin in order to load up to 1000 Fe atoms in each magnetoferritin. The reaction was maintained under stirring at 60 °C for 30 min. The solution was purified via size exclusion chromatography by (PD-10 column, GE Healthcare) in order to exclude the ions not included inside the protein. The Fe concentration inside the magnetoferritin was determined by UV-Vis spectroscopy, whereas the protein concentration was calculated by means of the bicinchoninic method. UV-VIS spectroscopy in conjunction with protein concentration assays (BcA method), revealed a loading of 1000 Fe/cage. DLS measurements revealed an apoferritin diameter of 10.5 ± 2.4 nm, consistent with the literature data.Citation62 In order to perform AFM/MFM characterization, a drop of solution containing the obtained magnetoferritin was dropped on a clean atomically flat Si single crystal substrate.
Vesicles preparation
Unilamellar vesicles were prepared according to the ‘film’ method previously described.Citation92,Citation93 Tw20 concentration in the sample was always above its CMC (in water at 25 °C: Tween 20 = 0.006 g/dL). Tween 20 and Chol in equimolar ratio (15mM:15mM) were dissolved in a CHCl3/CH3OH (3:1) mixture in around bottomed flask. The solvent mixture was then evaporated and the resultant dried film was then hydrated adding the hydrophilic MNPs solution (3.58 mg/mL) in 10−2 M Hepes buffer solution at pH 7.4. The multilamellar dispersion was then sonicated for 5 min at 60 °C using a tapered microtip operating at 20 kHz at an amplitude of 16% (Vibracell-VCX 400-Sonics, USA) and an unilamellar dispersion was obtained. The purification of MNPs loaded unilamellar dispersion from the substances not included in vesicular structures was performed by gel filtration glass chromatography (glass column 50 x 1.2 cm) using Sephadex G75 as stationary phase and 10−2 M Hepes buffer solution at pH 7.4 as eluent. Drops of solutions
containing empty and MNPs loaded niosomes were deposited on clean flat polycrystalline Al2O3 substrates for AFM/MFM characterization.
Size and ζ-potential measurements
Dynamic light scattering (DLS) was used to determine mean size and size distribution of empty and MNPs loaded non-ionic surfactant vesicles. The vesicle dispersions were diluted 100 times with the same buffer used for their preparation to avoid multiscattering phenomena. Vesicle mean size and size distribution (polydispersity index, PDI) were measured at 25 °C using a Malvern Nano ZS90 light scattering apparatus (Malvern Instruments Ltd.,Worcestershire, UK) at a scattering angle of 90.0°.
The same apparatus was used for the evaluation of ζ-potential of empty and MNPs loaded vesicles, which were appropriately diluted (1:10) in distilled water at 25 °C. The ζ-potential value was calculated from the electrophoretic mobility in the Smoluchowsky approximation. Reported data represent mean of the ζ-potential and of the hydrodynamic diameter (Dh) for the surfactant vesicles. Reported average values and standard deviations of the results of DLS experiments were calculated using samples from three different batches.
Bilayer characterization
Fluorescence experiments on vesicles incorporating pyrene were performed (Perkin-Elmer LS55 spectrofluorometer with excitation wavelength 319 nm) to evaluate the micropolarity and viscosity of the vesicle bilayer. Pyrene allows the investigation of the lateral distribution and the dynamics of membrane compounds. Pyrene in the bilayer is present as excimers at high concentrations; after dilution inside the bilayer, the excimer fluorescence decreases and increases the monomer fluorescence signal. The pyrene monomer fluorescent spectrum consists of five peaks. The monomer and the excimer have different fluorescent signals and the ratio of the fluorescence intensities is directly related to the probe distribution in the lipid network. The ratio I1/I3 between the intensities of the first (I1) and third (I3) vibration bands of the pyrene fluorescence spectrum (corresponding to 372 nm and 382 nm, respectively) is related to the polarity of the pyrene environment.Citation94 Low values of the I1/I3 ratio correspond to a non-polar environment. This ratio increases as the polarity of the medium rises.Citation94 Since pyrene is solubilized inside the hydrocarbon chain of vesicles, the information obtained from fluorescence of pyrene in our systems refers to the bilayer of the vesicle pigeon-hole.Citation95 The process depends on the rate of conformational change of the molecule which is sensitive to the viscosity of the probe microenvironment.Citation96 Hence the IE/IM ratio, where IM and IE stand for the intensity of the monomer and the excimer fluorescence, respectively, is used to estimate the microviscosity. Because of its high hydrophobicity, the solubilization zone of pyrene is in the vesicle bilayer, as was established in the case of polymeric micellar solutions.Citation97 The pyrene probe may also evidence (only qualitatively) the micropolarity variation in the solubilization region, by the change in the ratio of monomer vibronic bands intensities measured at 377 nm and 397 nm.Citation98
Fe entrapment efficiency
Fe content in vesicles was quantified in terms of concentration using inductively coupled plasma mass spectrometry (ICP-MS) equipped with a dynamic reaction cell (DRC) (Elan DCR II, Perkin Elmer SCIEX, Norwalk, CT, USA). Before the instrumental analysis all samples were digested with an acidic mixture (H2O + HNO3 + HCl + H2O2) in two subsequent steps: the first consisting in a soft pre-digestion treatment and the second in the application of a stronger temperature program. Both steps were performed using a microwave oven with a probe to control the temperature. The digested solutions were properly diluted and analyzed in DRC mode to overcome possible problems due to the occurrence of specific interferences. In particular, ammonia was used as reaction gas by applying a flow of 0.6 mL/min and an RPq equal to 0.6. The quantification was performed on 56Fe with an external calibration.
Synthesis of Fe3O4@Cu@Au nanoparticles: Fe3O4 core
685 mg (1.75 mmol) of Mohr salt ((NH4)2Fe(SO4)2 • 6H2O), 817 mg (2.04 mmol) of Fe2(SO4)3 and 474 mg of polyvinylpyrrolidone (PVP) were dissolved in 100 mL of distilled water. The Fe2+/Fe3+ solution thus prepared was added into 300 mL of a 0.7 M ammonia solution under mechanical stirring and argon atmosphere. The solution was left to react for 30 min at room temperature, then it was heated to 80 °C for 30 min. After cooling down the reaction mixture, the product was separated by magnetic decantation, washed with NaCl 2M and double distilled water, and finally dried under vacuum.
Synthesis of Fe3O4@Cu@Au nanoparticles: Cu shell
176 mg (0.1 mmol) of ascorbic acid and 120 mg (0.5 mmol) of (Cu(NO3)2 • 3H2O) were dissolved in 10 mL of distilled water. The solution thus prepared was added to a dispersion of 173 mg of magnetite NPs in 100 mL of distilled H2O, thermostated at 47 °C and mechanically stirred, obtaining a Fe3O4/Cu(II) ratio 1.5:1. After 60 min reaction, the mixture was cooled down and washed several times with double distilled water. The precipitate was then separated by magnetic decantation.
Synthesis of Fe3O4@Cu@Au nanoparticles: shell
150 mg of Fe3O4@Cu NPs were dispersed in 25 mL of distilled water and sonicated for 15 min. 118 mg (0.3 mmol) of HAuCl4 were dissolved in 5 mL distilled water. Both the suspension and the solution were added to a 25 mL of a saturated solution of NaHCO3 thermostated at 60 °C. After 45 min reaction, the mixture was cooled down and washed several times with double distilled water. The precipitate was then separated by magnetic decantation and dried under vacuum.
Functionalization with lipoic acid (Fe3O4@Cu@Au-LA)
43 mg Fe3O4@Cu@Au nanoparticles were dispersed in 25 mL of chloroform and sonicated for 10 min. Twenty-two mg (0.07 mmol) of NHS-ester of (R,S)-α-lipoic acid were dissolved in 20 mL of chloroform and added dropwise to the NPs suspension. The mixture was made react 24 h at room temperature under mechanical stirring. After several washing with double distilled water, the precipitate was separated by magnetic decantation.
Coating with poly-l-lysine/polyethyleneglycole (PLL-PEG) block co-polymer (Fe3O4@Cu@Au-LA-PLL-PEG)
Three ml of phosphate buffer (PBS) solution at pH 8.2 containing 3.5 mg (3.48 x 10⁻⁴ mmol) of [PLL]30-[PEG]114 (average MW = 9900) were added dropwise to a suspension of 20 mg of Fe3O4@Cu@Au-LA nanoparticles in 27 mL of PBS cooled with an ice bath and mechanically stirred. After 2 h 30 min, the mixture was washed several times with double distilled water at room temperature and the product was separated by magnetic decantation.
Coating with folic acid (Fe3O4@Cu@Au-LA-PLL-PEG-folic acid)
For the coating with folic acid a double-step synthesis was performed in dark. First, 244 mg (1.3 mmol) of 1-ethyl-3-(3-dimethylaminopropyl)-carbodiimide (EDC) dissolved in 17 mL of distilled water were added to a 17 mL solution of DMSO containing 76 mg (0.17 mmol) of folic acid. Thirty mg (0.26 mmol) of N-hydroxy-succinimmide (NHS) were added to the mixture, which was left react for 15 min at room temperature in dark, under magnetic stirring. In the second step, the pH was adjusted to 8.5 and 20 mg of Fe3O4@Cu@Au-LA-PLL-PEG-folic acid nanoparticles were added. The mixture was left overnight at room temperature in dark under mechanical stirring. After several washing with double distilled water, the precipitate was separated by magnetic decantation.
Cell cultures and incubation with MNPs
Growth and incubation of cells with MNPs were performed in a sterile environment, in laminar flow hood, using sterile glassware. Immortalized and selected T lymphoblastoid leukemia cells (CCRF-CEM) were cultured in a RPMI-1640 medium with fetal bovine serum (FBS) (10%), L-glutamine, antibiotic antimycotic (1%) and sodium phenol red as pH indicator. Cells were incubated at 37 °C, 95% humidity and 5% carbon dioxide (CO2). For interaction with MNPs, 2 mL of cell suspension at density of 6.5 x 10⁵ cells/mL were mixed with with 0.5 mL of 1 mg/mL Fe3O4@Cu@Au-LA-PLL-PEG-folic acid. Vitality test with Trypan blue performed after 18 h incubation put in evidence that only 3% of cells died, while the 97% were alive and showed the canonical morphology expected for this cellular line.
Conclusion
MFM can be used to qualitatively and quantitatively investigate the nanoscale magnetic properties of biological samples, e.g., from the detection of the iron core of ferritin molecules to the analysis of the cellular uptake of MNPs. Among other applications, in this work we showed the use of MFM for the visualization of the maghemite core of magnetoferritin, for the quantification of the diameter of MNPs agglomerates in niosomes for drug delivery, and for the characterization of MNPs labeled cells. These three case studies cover a wide range of characteristic lengths, i.e., a few nanometers (magnetoferritin), a few hundreds of nanometers (niosomes), and some microns (cells). Also, they represent three different spatial locations of MNPs in systems of biological interest, i.e., systems spatially coincident with MNPs (magnetoferritin), MNPs
inside the sample and thus below the surface (MNPs loaded niosomes), or MNPs both on and inside the sample (MNPs labeled cells). In order to obtain quantitative information from MFM images it is crucial to develop suitable models. In the reported examples, we showed how the two dipoles model can be adequate (magnetoferritin) or not adequate due to both a non ideal shape of the tip (MNPs loaded niosomes) and not punctiform MNPs layers which the MFM tip interacts with. In addition, at present the quantification from MFM
images of internalized MNPs still remains a challenge, models being required to describe the MFM response in presence of MNPs agglomerates the size and depth of which are generally unknown. Notwithstanding such limitations to be overcome, MFM represents a promising tool for the quantitative characterization of magnetic properties of an increasing variety of samples of biological and biomedical interest.
References
- ButtHJ, CappellaB, KapplM. Force measurements with the atomic force microscope: technique, interpretation and applications. Surf Sci Rep2005; 59:1 - 152; http://dx.doi.org/10.1016/j.surfrep.2005.08.003
- PasseriD, BettucciA, GermanoM, RossiM, AlippiA, SessaV, FioriA, TamburriE, TerranovaML. Local indentation modulus characterization of diamond-like carbon films by atomic force acoustic microscopy two contact resonance frequencies imaging technique. Appl Phys Lett2006; 88:121910; http://dx.doi.org/10.1063/1.2188376
- PasseriD, RossiM, TamburriE, TerranovaML. Mechanical characterization of polymeric thin films by atomic force microscopy based techniques. Anal Bioanal Chem2013; 405:1463 - 78; http://dx.doi.org/10.1007/s00216-012-6419-3; PMID: 23052864
- GirardP. Electrostatic force microscopy: principles and some applications to semiconductors. Nanotechnology2001; 12:485 - 90; http://dx.doi.org/10.1088/0957-4484/12/4/321
- CadenaMJ, MisiegoR, SmithKC, AvilaA, PipesB, ReifenbergerR, RamanA. Sub-surface imaging of carbon nanotube-polymer composites using dynamic AFM methods. Nanotechnology2013; 24:135706; http://dx.doi.org/10.1088/0957-4484/24/13/135706; PMID: 23478510
- JespersenTS, NygardJ. Mapping of individual carbon nanotubes in polymer/nanotube composites using electrostatic force microscopy. Appl Phys Lett2007; 90:183108; http://dx.doi.org/10.1063/1.2734920
- FumagalliL, FerrariG, SampietroM, CasusoI, MartínezE, SamitierJ, GomilaG. Nanoscale capacitance imaging with attofarad resolution using ac current sensing atomic force microscopy. Nanotechnology2006; 17:4581 - 7; http://dx.doi.org/10.1088/0957-4484/17/18/009; PMID: 21727580
- CasusoI, FumagalliL, GomilaG, PedrosE. Nondestructive thickness measurement of biological layers at the nanoscale by simultaneous topography and capacitance imaging. Appl Phys Lett2007; 91:063111; http://dx.doi.org/10.1063/1.2767979
- PalermoV, PalmaM, SamorìP. Electronic characterization of organic thin films by Kelvin probe force microscopy. Adv Mater2006; 18:145 - 64; http://dx.doi.org/10.1002/adma.200501394
- GruvermanA, KalininSV. Piezoresponse force microscopy and recent advances in nanoscale studies of ferroelectrics. J Mater Sci2006; 41:107 - 16; http://dx.doi.org/10.1007/s10853-005-5946-0
- GruvermanA, AucielloO, TokumotoH. Imaging and control of domain structures in ferroelectric thin films via scanning force microscopy. Annu Rev Mater Sci1998; 28:101 - 23; http://dx.doi.org/10.1146/annurev.matsci.28.1.101
- ShinJ, RodriguezBJ, BaddorfAP, ThundatT, KarapetianE, KachanovM, GruvermanA, KalininSV. Simultaneous elastic and electromechanical imaging by scanning probe microscopy: theory and applications to ferroelectric and biological materials. J Vac Sci Technol B2005; 23:2102 - 8; http://dx.doi.org/10.1116/1.2052714
- KalininSV, RodriguezBJ, JesseS, KarapetianE, MirmanB, EliseevEA, MorozovskaAN. Nanoscale electromechanics of ferroelectric and biological systems: a new dimension in scanning probe microscopy. Annu Rev Mater Res2007; 31:189 - 238; http://dx.doi.org/10.1146/annurev.matsci.37.052506.084323
- HartmannU. Magnetic force microscopy. Annu Rev Mater Sci1999; 29:53 - 87; http://dx.doi.org/10.1146/annurev.matsci.29.1.53
- VezenovDV, NoyA, AshbyP. Chemical force microscopy: probing chemical origin of interfacial forces and adhesion. J Adhes Sci Technol2005; 19:313 - 64; http://dx.doi.org/10.1163/1568561054352702
- KienbergerF, EbnerA, GruberHJ, HinterdorferP. Molecular recognition imaging and force spectroscopy of single biomolecules. Acc Chem Res2006; 39:29 - 36; http://dx.doi.org/10.1021/ar050084m; PMID: 16411737
- NoyA. Chemical force microscopy of chemical and biological interactions. Surf Interface Anal2006; 38:1429 - 41; http://dx.doi.org/10.1002/sia.2374
- GmelinE, FischerR. Stitzinger r. Sub-micrometer thermal physics - an overview on SThM techniques. Thermochim Acta1998; 310:1 - 17; http://dx.doi.org/10.1016/S0040-6031(97)00379-1
- MajumdarA. Scanning thermal microscopy. Annu Rev Mater Sci1999; 29:505 - 85; http://dx.doi.org/10.1146/annurev.matsci.29.1.505
- ShiL, PlyasunovS, BachtoldA, McEuenPL, MajumdarA. Scanning thermal microscopy of carbon nanotubes using batch-fabricated probes. Appl Phys Lett2009; 77:4295 - 7; http://dx.doi.org/10.1063/1.1334658
- PasseriD, SassiU, BettucciA, TamburriE, ToschiF, OrlanducciS, TerranovaML, RossiM. Thermoacoustic emission from carbon nanotubes imaged by atomic force microscopy. Adv Funct Mater2012; 22:2956 - 63; http://dx.doi.org/10.1002/adfm.201200435
- MartinY, WickramasingheHK. Magnetic imaging by “force microscopy” with 1000 ˚A resolution. Appl Phys Lett1987; 50:1455 - 7; http://dx.doi.org/10.1063/1.97800
- SaenzJJ, GarciaN, GrutterP, MeyerE, HeinzelmannH, WiesendangerR, RosenthalerL, HidberHR, GuntherodtHJ. Observation of magnetic forces by the atomic force microscope. J Appl Phys1987; 62:4293 - 5; http://dx.doi.org/10.1063/1.339105
- SaenzJJ, GarciaN, SloczewskiJC. Theory of magnetic imaging by force microscopy. Appl Phys Lett1988; 53:1449 - 51; http://dx.doi.org/10.1063/1.99965
- de LozanneA. Application of magnetic force microscopy in nanomaterials characterization. Microsc Res Tech2006; 69:550 - 62; http://dx.doi.org/10.1002/jemt.20325; PMID: 16732543
- Sarid D. Scanning Force Microscopy. Oxford University Press (New York, U.S.A.); 1994.
- PorthunS, AbelmannL, LodderC. Magnetic force microscopy applied in magnetic data storage technology. J Magn Magn Mater1998; 182:238 - 73; http://dx.doi.org/10.1016/S0304-8853(97)01010-X
- KoblischkaMR, HewenerB, HartmannU, WienssA, ChristofferB, Persch-SchuyG. Magnetic force microscopy applied in magnetic data storage technology. Appl Phys, A Mater Sci Process2003; 76:879 - 84; http://dx.doi.org/10.1007/s00339-002-1968-5
- SchreiberS, SavlaM, PelekhovDV, IscruDF, SelcuC, HammelPC, AgarwalG. Magnetic force microscopy of superparamagnetic nanoparticles. Small2008; 4:270 - 8; http://dx.doi.org/10.1002/smll.200700116; PMID: 18247385
- SieversS, BraunKF, EberbeckD, GustafssonS, OlssonE, SchumacherHW, SiegnerU. Quantitative measurement of the magnetic moment of individual magnetic nanoparticles by magnetic force microscopy. Small2012; 8:2675 - 9; http://dx.doi.org/10.1002/smll.201200420; PMID: 22730177
- PasseriD, DongC, AngeloniL, PantanellaF, NataliziT, BerluttiF, MarianecciC, CiccarelloF, RossiM. Thickness measurement of soft thin films on periodically patterned magnetic substrates by phase difference magnetic force microscopy. Ultramicroscopy2014; 136:96 - 106; http://dx.doi.org/10.1016/j.ultramic.2013.08.001; PMID: 24056281
- MiyasakaM, NishideH. Magnetic force microscopy images of nanometer-sized, purely organic high-spin polyradical. Adv Funct Mater2003; 13:113 - 7; http://dx.doi.org/10.1002/adfm.200390016
- FukuzakiE, NishideH. Room-temperature high-spin organic single molecule: nanometer-sized and hyperbranched poly[1,2,(4)-phenylenevinyleneanisylaminium]. [1,2,(4)-phenylenevinyleneanisylaminium]J Am Chem Soc2006; 128:996 - 1001; http://dx.doi.org/10.1021/ja0569611; PMID: 16417391
- YanagiH, ManivannanA. Epitaxial growth of molecular magnetic thin films of lithium phthalocyanine. Thin Solid Films2001; 393:28 - 33; http://dx.doi.org/10.1016/S0040-6090(01)01088-4
- CavalliniM, Gomez-SeguraJ, Ruiz-MolinaD, MassiM, AlbonettiC, RoviraC, VecianaJ, BiscariniF. Magnetic information storage on polymers by using patterned single-molecule magnets. Angew Chem Int Ed Engl2005; 44:888 - 92; http://dx.doi.org/10.1002/anie.200461554; PMID: 15669030
- ZaidiNA, GiblinSR, TerryI, MonkmanAP. Room temperature magnetic order in an organic magnet derived from polyaniline. Polymer (Guildf)2004; 45:5683 - 9; http://dx.doi.org/10.1016/j.polymer.2004.06.002
- JaiswalMK, BanerjeeR, PradhanP, BahadurD. Thermal behavior of magnetically modalized poly(N-isopropylacrylamide)-chitosan based nanohydrogel. Colloids Surf B Biointerfaces2010; 81:185 - 94; http://dx.doi.org/10.1016/j.colsurfb.2010.07.009; PMID: 20702074
- NyamjavD, KinsellaJM, IvanisevicA. Magnetic wires with DNA cores: a magnetic force microscopy study. Appl Phys Lett2005; 86:093107; http://dx.doi.org/10.1063/1.1875748
- HsiehCW, ZhengB, HsiehS. Ferritin protein imaging and detection by magnetic force microscopy. Chem Commun (Camb)2010; 46:1655 - 7; http://dx.doi.org/10.1039/b912338e; PMID: 20177606
- MartinezRV, ChiesaM, GarciaR. Nanopatterning of ferritin molecules and the controlled size reduction of their magnetic cores. Small2011; 7:2914 - 20; http://dx.doi.org/10.1002/smll.201100366; PMID: 22102991
- DietzC, HerruzoET, LozanoJR, GarciaR. Nanomechanical coupling enables detection and imaging of 5 nm superparamagnetic particles in liquid. Nanotechnology2011; 22:125708; http://dx.doi.org/10.1088/0957-4484/22/12/125708; PMID: 21325711
- KimD, ChungNK, AllenS, TendlerSJB, ParkJW. Ferritin-based new magnetic force microscopic probe detecting 10 nm sized magnetic nanoparticles. ACS Nano2012; 6:241 - 8; http://dx.doi.org/10.1021/nn203464g; PMID: 22148318
- HergtR, HiergeistR, ZeisbergerM, SchulerD, HeyenU, HilgerI, KaiserWA. Magnetic properties of bacterial magnetosomes as potential diagnostic and therapeutic tools. J Magn Magn Mater2005; 293:80 - 6; http://dx.doi.org/10.1016/j.jmmm.2005.01.047
- ProkschRB, SchafferTE, MoskowitzBM, DahlbergED, BazylinskiDA, FrankelRB. Magnetic force microscopy of the submicron magnetic assembly in a magnetotactic bacterium. Appl Phys Lett1995; 66:2582 - 4; http://dx.doi.org/10.1063/1.113508
- AlbrechtM, JankeV, SieversUS. Siegner, Schuler D, Heyen U. Scanning force microscopy study of biogenic nanoparticles for medical applications. J Magn Magn Mater2005; 290:269 - 71; http://dx.doi.org/10.1016/j.jmmm.2004.11.206
- EberbeckD, JankeV, HartwigS, HeyenU, SchulerD, AlbrechtM, TrahmsL. Blocking of magnetic moments of magnetosomes measured by magnetorelaxometry and direct observation by magnetic force microscopy. J Magn Magn Mater2005; 289:70 - 3; http://dx.doi.org/10.1016/j.jmmm.2004.11.020
- WeiJD, KnittelI, LangC, SchulerD, HartmannU. Magnetic properties of single biogenic magnetite nanoparticles. J Nanopart Res2011; 13:3345 - 52; http://dx.doi.org/10.1007/s11051-011-0357-4
- GojzewskiH, MakowskiM, HashimA, KopcanskyP, TomoriZ, TimkoM. Magnetosomes on surface: an imaging study approach. Scanning2012; 34:159 - 69; http://dx.doi.org/10.1002/sca.20292; PMID: 21953296
- DunnJR, FullerM, ZoegerJ, DobsonJ, HellerF, HammannJ, CaineE, MoskowitzBM. Magnetic material in the human hippocampus. Brain Res Bull1995; 36:149 - 53; http://dx.doi.org/10.1016/0361-9230(94)00182-Z; PMID: 7895092
- DobsonJ. Nanoscale biogenic iron oxides and neurodegenerative disease. FEBS Lett2001; 496:1 - 5; http://dx.doi.org/10.1016/S0014-5793(01)02386-9; PMID: 11343696
- Grassi-SchultheissPP, HellerF, DobsonJ. Analysis of magnetic material in the human heart, spleen and liver. Biometals1997; 10:351 - 5; http://dx.doi.org/10.1023/A:1018340920329; PMID: 9353885
- DobsonJ. Investigation of age-related variations in biogenic magnetite levels in the human hippocampus. Exp Brain Res2002; 144:122 - 6; PMID: 11976766
- CollingwoodJ, DobsonJ. Mapping and characterization of iron compounds in Alzheimer’s tissue. J Alzheimers Dis2006; 10:215 - 22; PMID: 17119289
- OberdörsterG, OberdörsterE, OberdörsterJ. Nanotoxicology: an emerging discipline evolving from studies of ultrafine particles. Environ Health Perspect2005; 113:823 - 39; http://dx.doi.org/10.1289/ehp.7339; PMID: 16002369
- TassinariR, CubaddaF, MoracciG, AureliF, D’AmatoM, ValeriM, De BerardisB, RaggiA, MantovaniA, PasseriD, et al. Oral, short-term exposure to titanium dioxide nanoparticles in Sprague-Dawley rat: focus on reproductive and endocrine systems and spleen. Nanotoxicology2014; 8:654 - 62; http://dx.doi.org/10.3109/17435390.2013.822114; PMID: 23834344
- AmemiyaY, TanakaT, YozaB, MatsunagaT. Novel detection system for biomolecules using nano-sized bacterial magnetic particles and magnetic force microscopy. J Biotechnol2005; 120:308 - 14; http://dx.doi.org/10.1016/j.jbiotec.2005.06.028; PMID: 16111780
- MoskalenkoAV, YarovaPL, GordeevSN, SmirnovSV. Single protein molecule mapping with magnetic atomic force microscopy. Biophys J2010; 98:478 - 87; http://dx.doi.org/10.1016/j.bpj.2009.10.021; PMID: 20141762
- ShenHB, LongDH, ZhuLZ, LiXY, DongYM, JiaNQ, ZhouHQ, XinX, SunY. Magnetic force microscopy analysis of apoptosis of HL-60 cells induced by complex of antisense oligonucleotides and magnetic nanoparticles. Biophys Chem2006; 122:1 - 4; http://dx.doi.org/10.1016/j.bpc.2006.01.003; PMID: 16500021
- ZhangY, YangM, OzkanM, OzkanCS. Magnetic force microscopy of iron oxide nanoparticles and their cellular uptake. Biotechnol Prog2009; 25:923 - 8; http://dx.doi.org/10.1002/btpr.215; PMID: 19562741
- WangZ, CuschieriA. Tumour cell labelling by magnetic nanoparticles with determination of intracellular iron content and spatial distribution of the intracellular iron. Int J Mol Sci2013; 14:9111 - 25; http://dx.doi.org/10.3390/ijms14059111; PMID: 23624604
- UchidaM, KangS, ReichhardtC, HarlenK, DouglasT. The ferritin superfamily: Supramolecular templates for materials synthesis. Biochim Biophys Acta2010; 1800:834 - 45; http://dx.doi.org/10.1016/j.bbagen.2009.12.005; PMID: 20026386
- TaturJ, HagenWR, MatiasPM. Crystal structure of the ferritin from the hyperthermophilic archaeal anaerobe Pyrococcus furiosus.. J Biol Inorg Chem2007; 12:615 - 30; http://dx.doi.org/10.1007/s00775-007-0212-3; PMID: 17541801
- Kanbak-AksuS, Nahid HasanM, HagenWR, HollmannF, SordiD, SheldonRA, ArendsIW. Ferritin-supported palladium nanoclusters: selective catalysts for aerobic oxidations in water. Chem Commun (Camb)2012; 48:5745 - 7; http://dx.doi.org/10.1039/c2cc31401k; PMID: 22552755
- KasyutichO, IlariA, FiorilloA, TatchevD, HoellA, CeciP. Silver ion incorporation and nanoparticle formation inside the cavity of Pyrococcus furiosus ferritin: structural and size-distribution analyses. J Am Chem Soc2010; 132:3621 - 7; http://dx.doi.org/10.1021/ja910918b; PMID: 20170158
- GalvezN, FernandezB, ValeroE, SanchezP, CuestaR, Dominguez-VeraJM. Apoferritin as a nanoreactor for preparing metallic nanoparticles. C R Chim2008; 11:1207 - 12; http://dx.doi.org/10.1016/j.crci.2008.09.003
- Martínez-PérezMJ, de MiguelR, CarboneraC, Martínez-JúlvezM, LostaoA, PiquerC, Gómez-MorenoC, BartoloméJ, LuisF. Size-dependent properties of magnetoferritin. Nanotechnology2010; 21:465707; http://dx.doi.org/10.1088/0957-4484/21/46/465707; PMID: 20975213
- San PauloA, GarciaR. Tip-surface forces, amplitude, and energy dissipation in amplitude-modulation (tapping mode) force microscopy. Phys Rev B2001; 64:193411; http://dx.doi.org/10.1103/PhysRevB.64.193411
- San PauloA, GarciaR. Unifying theory of tapping-mode atomic-force microscopy. Phys Rev B2002; 66:041406; http://dx.doi.org/10.1103/PhysRevB.66.041406
- GomezRD, PakAO, AndersonAJ, BurkeER, LeyendeckerAJ, MayergoyzID. Quantification of magnetic force microscopy images using combined electrostatic and magnetostatic imaging. J Appl Phys1998; 83:6226 - 8; http://dx.doi.org/10.1063/1.367638
- NevesCS, QuaresmaP, BaptistaPV, CarvalhoPA, AraújoJP, PereiraE, EatonP. New insights into the use of magnetic force microscopy to discriminate between magnetic and nonmagnetic nanoparticles. Nanotechnology2010; 21:305706; http://dx.doi.org/10.1088/0957-4484/21/30/305706; PMID: 20610872
- JaafarM, Iglesias-FreireO, Serrano-RamónL, IbarraMR, de TeresaJM, AsenjoA. Distinguishing magnetic and electrostatic interactions by a Kelvin probe force microscopy-magnetic force microscopy combination. Beilstein J Nanotechnol2011; 2:552 - 60; http://dx.doi.org/10.3762/bjnano.2.59; PMID: 22003461
- RajeraR, NagpalK, SinghSK, MishraDN. Niosomes: a controlled and novel drug delivery system. Biol Pharm Bull2011; 34:945 - 53; http://dx.doi.org/10.1248/bpb.34.945; PMID: 21719996
- HadinotoK, SundaresanA, CheowWS. Lipid-polymer hybrid nanoparticles as a new generation therapeutic delivery platform: a review. Eur J Pharm Biopharm2013; 85:3 Pt A427 - 43; http://dx.doi.org/10.1016/j.ejpb.2013.07.002; PMID: 23872180
- AmstadE, ReimhultE. Nanoparticle actuated hollow drug delivery vehicles. Nanomedicine (Lond)2012; 7:145 - 64; http://dx.doi.org/10.2217/nnm.11.167; PMID: 22191783
- FuchigamiT, KitamotoY, NamikiY. Size-tunable drug-delivery capsules composed of a magnetic nanoshell. Biomatter2012; 2:313 - 20; http://dx.doi.org/10.4161/biom.22617; PMID: 23507895
- HäberleT, HaeringF, PfeiferH, HanL, KuerbanjiangB, WiedwaldU, HerrU, KoslowskiB. Towards quantitative magnetic force microscopy: theory and experiment. New J Phys2012; 14:043044; http://dx.doi.org/10.1088/1367-2630/14/4/043044
- PankhurstQA, ConnellyJ, JonesSK, DobsonJ. Applications of magnetic nanoparticles in biomedicine. J Phys D Appl Phys2003; 36:R167 - 81; http://dx.doi.org/10.1088/0022-3727/36/13/201
- StellaB, ArpiccoS, PeracchiaMT, DesmaëleD, HoebekeJ, RenoirM, D’AngeloJ, CattelL, CouvreurP. Design of folic acid-conjugated nanoparticles for drug targeting. J Pharm Sci2000; 89:1452 - 64; http://dx.doi.org/10.1002/1520-6017(200011)89:11<1452::AID-JPS8>3.0.CO;2-P; PMID: 11015690
- ScaramuzzoFA, SalvatiR, PaciB, GenerosiA, Rossi-AlbertiniV, LatiniA, BarteriM. Nanoscale in situ morphological study of proteins immobilized on gold thin films. J Phys Chem B2009; 113:15895 - 9; http://dx.doi.org/10.1021/jp907149m; PMID: 19899801
- WhitesidesGM, Christopher LoveJ. The art of building small. Sci Am2001; 285:38 - 47; http://dx.doi.org/10.1038/scientificamerican0901-38; PMID: 11524968
- GoetzeT, GansauC, BuskeN, RoederM, GornertP, BahrM. Biocompatible magnetic core/shell nanoparticles. J Magn Magn Mater2002; 252:399 - 402; http://dx.doi.org/10.1016/S0304-8853(02)00624-8
- BedantaS, KleemannW. Supermagnetism. J Phys D Appl Phys2009; 42:1 - 28; http://dx.doi.org/10.1088/0022-3727/42/1/013001
- BatlleX, LabartaA. Finite-size effects in fine particles: magnetic and transport properties. J Phys D Appl Phys2002; 35:15 - 42; http://dx.doi.org/10.1088/0022-3727/35/6/201
- LoveJC, EstroffLA, KriebelJK, NuzzoRG, WhitesidesGM. Self-assembled monolayers of thiolates on metals as a form of nanotechnology. Chem Rev2005; 105:1103 - 69; http://dx.doi.org/10.1021/cr0300789; PMID: 15826011
- ColettiD, ScaramuzzoFA, MontemiglioLC, PristeràA, TeodoriL, AdamoS, BarteriM. Culture of skeletal muscle cells in unprecedented proximity to a gold surface. J Biomed Mater Res A2009; 91:370 - 7; http://dx.doi.org/10.1002/jbm.a.32243; PMID: 18980225
- JansenG, WesterhofGR, JarmuszewskiMJ, KathmannI, RijksenG, SchornagelJH. Methotrexate transport in variant human CCRF-CEM leukemia cells with elevated levels of the reduced folate carrier. Selective effect on carrier-mediated transport of physiological concentrations of reduced folates. J Biol Chem1990; 265:18272 - 7; PMID: 2211701
- TamburriE, OrlanducciS, TerranovaML, ValentiniF, PalleschiG, CurulliA, BrunettiF, PasseriD, AlippiA, RossiM. Modulation of the electrical properties in single-walled carbon nanotube/conducting polymer composites. Carbon2005; 43:1213 - 21; http://dx.doi.org/10.1016/j.carbon.2004.12.014
- SavlaM, PandianRP, KuppusamyP, AgarwalG. Magnetic force microscopy of an oxygen-sensing spin-probe. Isr J Chem2008; 48:33 - 8; http://dx.doi.org/10.1560/IJC.48.1.33
- BraunKF, SieversS, AlbrechtM, SiegnerU, LandfesterK, HolzapfelV. Stability of the magnetic domain structure of nanoparticle thin films against external fields. J Magn Magn Mater2009; 321:3719 - 25; http://dx.doi.org/10.1016/j.jmmm.2009.07.023
- PacificoJ, van LeeuwenYM, Spuch-CalvarM, Sánchez-IglesiasA, Rodríguez-LorenzoL, Pérez-JusteJ, Pastoriza-SantosI, Liz-MarzánLM. Field gradient imaging of nanoparticle systems: analysis of geometry and surface coating effects. Nanotechnology2009; 20:095708; http://dx.doi.org/10.1088/0957-4484/20/9/095708; PMID: 19417504
- Honarmand EbrahimiK, HagedoornPL, JongejanJA, HagenWR. Catalysis of iron core formation in Pyrococcus furiosus ferritin. J Biol Inorg Chem2009; 14:1265 - 74; http://dx.doi.org/10.1007/s00775-009-0571-z; PMID: 19623480
- MarianecciC, RinaldiF, Di MarzioL, PozziD, CaraccioloG, MannoD, DiniL, PaolinoD, CeliaC, CarafaM. Interaction of pH-sensitive non-phospholipid liposomes with cellular mimetic membranes. Biomed Microdevices2013; 15:299 - 309; http://dx.doi.org/10.1007/s10544-012-9731-y; PMID: 23239124
- MarianecciC, RinaldiF, IngallinaC, PasseriD, SorboA, RossiM, CarafaM. Smart magnetic nanovesicles for theranostic application: preparation and characterization. Nuovo Cimento C.2013; 36:103 - 10
- KalyanasundaramK, ThomasJK. Environmental effects on vibronic band intensities in pyrene monomer fluorescence and their application in studies of micellar systems. J Am Chem Soc1977; 99:2039 - 44; http://dx.doi.org/10.1021/ja00449a004
- VanderkooiJM, CallisJB. Pyrene. A probe of lateral diffusion in the hydrophobic region of membranes. Biochemistry1974; 13:4000 - 6; http://dx.doi.org/10.1021/bi00716a028; PMID: 4415409
- ZachariasseKA. Intramolecular excimer formation with diarylalkanes as a microfluidity probe for sodium dodecyl sulphate micelles. Chem Phys Lett1978; 57:429 - 32; http://dx.doi.org/10.1016/0009-2614(78)85541-9
- VasilescuM, BandulaR, LemmetyinenH. Micropolarity and microviscosity of Pluronic L62 and L64 core-shell aggregates in water at various concentrations and additives examined by absorption and fluorescence probes. Colloid Polym Sci2010; 288:1173 - 84; http://dx.doi.org/10.1007/s00396-010-2247-1
- VasilescuM, AngelescuDG, BandulaR, StaikosG. Microstructure of polyelectrolyte nanoaggregates studied by fluorescence probe method. J Fluoresc2011; 21:2085 - 91; http://dx.doi.org/10.1007/s10895-011-0907-2; PMID: 21688051