Abstract
Background: Brain cancer stem-like cells (bCSC) are cancer cells with neural stem cell (NSC)-like properties found in glioblastoma multiforme (GBM) and they are assigned a central role in tumor initiation, progression and relapse. The Notch pathway is important for maintenance and cell fate decisions in the normal NSC population. Notch signaling is often deregulated in GBM and recent results suggest that this pathway plays a significant role in bCSC as well. We therefore wished to further elucidate the role of Notch activation in GBM-derived bCSC.
Methods: Human-derived GBM xenograft cells were cultured as NSC-like neurosphere cultures. Notch modulation was accomplished either by blocking the pathway using the γ-secretase inhibitor DAPT or by activating it by transfecting the cells with the constitutive active Notch-1 receptor.
Results: GBM neurosphere cultures with high endogenous Notch activation displayed sensitivity toward Notch inhibition with regard to tumorigenic features as demonstrated by increased G0/G1 population and reduced colony formation capacity. Of the NSC-like characteristics, only the primary sphere forming potential was affected, while no effect was observed on self-renewal or differentiation. In contrast, when Notch signaling was activated a decrease in the G0/G1 population and an enhanced capability of colony formation was observed, along with increased self-renewal and de-differentiation.
Conclusion: Based on the presented results we propose that active Notch signaling plays a role for cell growth and stem cell-like features in GBM neurosphere cultures and that Notch-targeted anti-bCSC treatment could be feasible for GBM patients with high endogenous Notch pathway activation.
Introduction
Gliomas are the most common primary brain tumors (PBT) in adults with an yearly incidence of approximately 6/100 000 in Western countries.Citation1 They are traditionally categorized as derived from glial tissue and further distinction is made based on their grade of anaplasia of which the astrocytic glioma, glioblastoma multiforme (GBM, WHO Grade IV) displays the highest degree. GBM accounts for 50–60% of gliomasCitation2 and is recognized as the most aggressive PBT in adults with a median survival around 15 mo.Citation3 The majority of GBMs are often difficult to operate, due to their location and infiltrative growth pattern, and non-surgical treatments (chemo- and radiation therapy) are often ineffective.Citation4,Citation5 As such, relapse is almost certain, which is why GBM thus far is considered incurable and new treatment modalities are in high demand.
Increasing evidence imply that a population of stem-like cells exist within the heterogeneous cell mass that comprise brain tumors, including GBM. These are, among others, designated brain cancer stem-like cells (bCSC) as they show close resemblance to the normal neural stem cells (NSC) of the human brain. The bCSC have been shown to drive tumor initiation and progression in an orthotopic GBM modelCitation6 and they are furthermore thought to exert a significant role in tumor angiogenesis, treatment resistance, and relapse,Citation7-Citation9 making them an interesting target in the search for improving GBM treatment. Using the serum-free neurosphere culture system and analysis, adopted from work with NSC, bCSC can be identified in vitro based on their NSC-like characteristics, namely, neurosphere formation, self-renewal, multipotency, and expression of NSC markers.Citation10-Citation14 In addition to NSC characteristics, bCSC are tumorigenic and capable of mimicking the characteristics of the original patient tumor when transplanted onto immunocompromised mice.Citation12,Citation13,Citation15 Results from our lab and others have shown that GBM cell cultures established during stem cell conditions more closely mirror the original patient tumor and maintain important GBM hallmarks, such as amplification and/or mutation of the epidermal growth factor receptor (EGFR),Citation16,Citation17 than GBM cells grown in the traditional serum containing culture systems. As such, establishing GBM neurosphere cell cultures that retain stem cell-like potential and GBM characteristics has provided us with a valuable model of the human disease for the present work.
The Notch signaling pathway is evolutionarily conserved and has a diverse impact on several cellular pathways and functions depending on the cellular context, the activating ligand as well as intervention from additional signaling pathways. The involvement of Notch in cell-fate decisions during development of the nervous system was originally outlined through studies in D. melanogaster, and it has been demonstrated that Notch signaling influences the balance between the NSC pool and its differentiated progeny through both lateral inhibition as well as inductive and restrictive cell fate determination.Citation18-Citation25 The Notch receptors have been associated with cells in neurogenic areas such as the subventricular zone, the dentate gyrus, and the rostromigratory stream of the postnatal mammalian brain,Citation26-Citation28 all areas where NSC are abundant.Citation29-Citation31 Clinically, GBM are often located in close association to such areas,Citation4,Citation32 thus it is no surprise that Notch pathway components often are found aberrantly expressed in GBM and thereof derived neurosphere cultures.Citation16,Citation33-Citation38 Furthermore, it has been suggested that Notch activity plays a central role in bCSC survival, tumorigenicity, and resistance mechanisms.Citation36,Citation39-Citation44
In the present study, we seek to further dissect the relevance of Notch signaling in bCSC by investigating the importance of an active Notch pathway in GBM neurosphere cultures. We show that human-derived GBM xenograft cells cultured during NSC conditions in vitro contain cells with NSC-like characteristics. We further found that Notch pathway activation differed between the cultures investigated and that inhibition of Notch signaling, using the γ-secretase inhibitor (GSI) DAPT, which inhibits the activating cleavage of the Notch receptor,Citation44 hampered cell growth and primary sphere formation only in GBM neurosphere cultures with high endogenous Notch activity. However, endogenous Notch activity did not seem to be important for additional stem cell characteristics such as self-renewal and differentiation status. On the contrary, by introducing a constitutively active form of the Notch-1 receptor (ICN-1) and thereby exogenously activate the pathway, both cell growth and stem cell characteristics could be affected in all cultures. Taken together these results suggest that Notch signaling is important for the growth of GBM neurosphere cells with high endogenous Notch expression and activation and that Notch activity can be increased to a level where it influences the NSC-like characteristics of all cultures. Thus, Notch-directed GBM therapy for targeting the bCSC population is likely a promising alternative or supplement to existing treatment regimes.
Results
GBM neurosphere cultures harbor neural stem-like cells
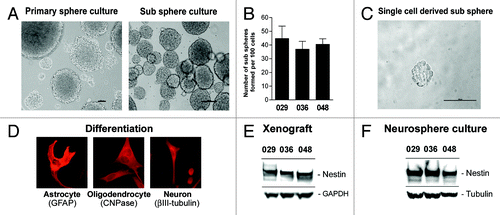
In the past decade several groups have identified and characterized bCSC from GBM based on their ability to form neurospheres during stem cell culturing conditions, their self-renewing capacity based on sub-sphere formation, their multi-differentiation potential and the expression of NSC markers.Citation10,Citation11,Citation14 Here GBM neurosphere cultures were established from human-derived GBM xenograft tissue as previously described.Citation17 All cultures observed were able to form both primary spheres and spheres after dissociation, i.e., sub-spheres (). To test the self-renewing capacity of the sphere-forming cells, sub-sphere formation was quantified as the number of spheres formed per 100 cells plated to approximately 35–45 spheres (). It should be noticed that the sub-sphere forming potential varied between passages, in most cases increasing with increasing passage number (Fig. S1), indicating an enrichment of sphere forming cells in the culture. All cultures were, furthermore, able to form spheres from a single cell plated (). Together these data indicate that the sphere-forming cells are self-renewing. To test whether multipotent cells were present in the cultures, dissociated sphere cells were subjected to serum-containing media in order to induce differentiation. Addition of serum made the cells grow adherently with a more differentiated morphology (data not shown). Immunocytochemical detection of GFAP, βIII-tubulin, and CNPase demonstrated that all cultures contained cells expressing neuronal and/or glial markers upon differentiation (), suggesting that the cultures harbored cells with multi-differentiating potential. Finally, all three xenografts and thereof derived following passages of neurosphere cultures expressed high levels of the stem cell marker Nestin (), compared with the commercial U251 GBM cell line used as a positive controlCitation45 (data not shown). All cultures have been injected intracranially into SCID mice and grown as orthotopic tumors (unpublished data), and similar cultures have been re-implanted and successfully established as secondary subcutaneous tumors on the flanks of nude mice,Citation17 together suggesting that cells within the neurosphere cultures have maintained their tumorigenic potential. Based on these results we believe that the neurosphere cultures used in this study can be categorized as harboring a bCSC population.
Figure 1. Neural stem-like cells are present in GBM xenografts. (A) Representative pictures of a primary and a sub sphere culture. Scale bar shows 100 µM. (B) Sub sphere formation in later cultures. Bar chart represents the mean number of sub spheres formed per 100 cells plated ± SEM (C) Representative sphere formed from a single cell. (D) Representative pictures of differentiated sphere cells expressing GFAP (astrocytic marker), CNPase (oligodendrocytic marker), or βIII-tubulin (neuronal marker) upon serum addition. Expression was detected by immunocytochemical staining. WB analysis of the NSC marker Nestin in (E) subcutaneous GBM xenografts and (F) thereof derived neurosphere cultures.
GBM neurosphere cultures express varying levels of Notch-1 and the Notch transcriptional target Hes-1
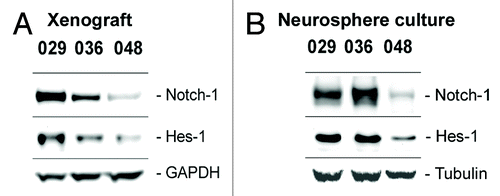
The Notch receptors, their ligands and downstream mediators have been found aberrantly expressed in various grades and types of gliomas, commercial glioma cells lines as well as in glioma-derived neurosphere cultures and it has been demonstrated that the Notch pathway plays a role in glioma cell survival and maintenance.Citation16,Citation33,Citation39,Citation40 We therefore wished to determine the Notch-1 protein level and the activity of the Notch pathway, as assessed by the Notch transcriptional target Hes-1, in the GBM neurosphere cultures and xenograft tumors used in this study. As shown in subcutaneous xenograft tumors from which the in vitro cultures were established expressed Notch-1 at various levels and the expression of Notch-1 was higher in the 029 and 036 xenografts than in the 048 xenograft. This expression pattern was also evident in the corresponding neurosphere cultures (). Expression of the Notch target Hes-1 was likewise higher in the 029 and 036 xenografts and in vitro cultures, as compared with 048 (). Taken together, the Notch-1 expression and pathway activation seems to be maintained from the xenografts to the in vitro cultures. Furthermore, we classified the 029 and 036 xenografts and cultures as having high endogenous Notch-1 expression and Notch pathway activation as compared with the 048 xenograft and culture which we classified as having low expression and activation.
Figure 2. Expression of Notch-1 and the Notch target Hes-1 is maintained from xenograft to culture. Basal protein expression of the Notch-1 receptor and the Notch transcriptional target Hes-1 in (A) subcutaneous xenograft tumors from which the neurosphere cultures used in this study were derived and in (B) the xenograft-derived GBM neurosphere cultures.
Notch inhibition induces cell cycle arrest without cell death in cultures with high endogenous Notch expression and activity
To investigate the effect of Notch pathway inhibition on our in vitro cultures, dissociated neurosphere cells were treated with 5 µM DAPT for 2 weeks, where after the cells were harvested for analyses. Q-RT-PCR analysis showed that the Hes-1 mRNA level was reduced in the 029 and 036 cultures upon DAPT treatment as compared with control (). However, no effect was observed in the 048 culture. On protein level downregulation of Hes-1 was observed in the 029 and 036 cultures both after 2 weeks () and 3 d (), whereas the downregulation was not as evident in the 048 culture, verifying the results from the Q-RT-PCR analyses. Thus, it is possible to hamper Notch signaling in cultures with high endogenous Notch-1 expression and pathway activation as assessed by Hes-1 expression, whereas Notch signaling in cultures with low Notch activity is less affected by γ-secretase inhibition.
Figure 3. Notch inhibition more profoundly affects cultures with high Notch expression and activation. (A) Q-RT-PCR analysis of Hes-1 mRNA expression. Bars represent mean normalized Hes-1 mRNA expression ± SEM in control and DAPT treated cultures from two independent experiments performed in duplicates. Comparisons of means between control and treated were based on the unpaired t-test performed on the normalized data. Stars represent the difference between the mean of control and treated. **P < 0.01. (B) WB detection of Hes-1 protein in DAPT and DMSO treated cultures. In (A and B) the cells were treated with 5 µM DAPT or DMSO for two weeks. (C) Cell cycle analysis of neurosphere cultures treated with 5 µM DAPT or DMSO for three days. Bars represent the difference in the G0/G1 fraction ± SEM between the DMSO control and the DAPT treated samples from three independent experiments. Positive bars correspond to an increase in the G0/G1 fraction in the DAPT treated samples compared with the control. Comparisons of means between control and treatment were based on the paired t-test performed on the untransformed data. Stars represent the difference between the mean of control and treated. **P < 0.01, ***P < 0.001. (D) WB detection of Hes-1, cell cycle regulators (CDK4 and p21), and apoptotic markers (cleaved caspase-3 and BAX) in neurosphere cells treated with 5 µM DAPT or DMSO for 3 d.
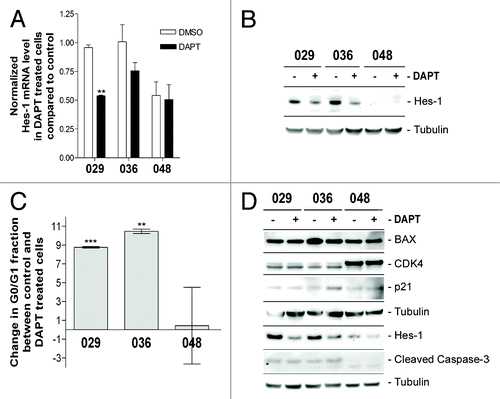
To explore the effect of Notch inhibition on a functional level, cell cycle analysis was performed. Dissociated neurosphere cells were treated with 5 µM DAPT for three days and subsequently fixed and labeled with propidium iodide for flowcytometric quantification of DNA content. Upon analysis of the cell cycle, we found the G0/G1, non-dividing cell fraction to be elevated by approximately 10% in the DAPT treated 029 and 036 cells, whereas there was no consistent response in the 048 cells as evident by the large error bars (). We were concerned that the increase in the 029 and 036 G0/G1 population reflected a decrease in the sub-G0/G1, dead cell fraction. However, when quantifying the fraction of dead cells in these cultures using trypan blue staining the total number of dead cells was not decreased upon treatment with neither 5 nor 10 µM DAPT (data not shown and Fig. S2). To further explore this, we analyzed the expression level of different apoptotic- and cell cycle markers upon treatment with 5 μM DAPT for three days. As shown in no change in the apoptotic markers cleaved caspase-3 or BAX could be observed upon Notch inhibition. The cell cycle regulator CDK4 was likewise not affected while a slight upregulation of the cell cycle inhibitor p21 could be detected in the 036 culture which correlates with inhibition of the cell cycle.
Tumorigenicity is obstructed by Notch inhibition in cultures with high Notch activation
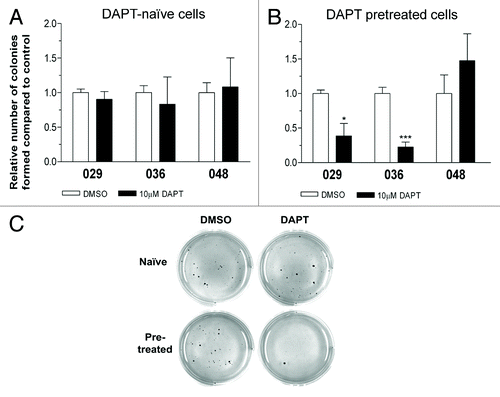
We then tested if Notch inhibition targeted additional in vitro tumorigenic features of the GBM neurosphere cells such as the ability to grow independently of anchorage and cell–cell contact. As such, cells left untreated (DAPT-naïve) or cells pretreated with DAPT or DMSO were plated in semi-solid agar with the addition of DAPT or DMSO. The number of clonogenic colonies formed was evaluated after 2 weeks. As displayed in , no effect on the colony formation was seen when DAPT-naïve cells were subjected to this assay. However, pretreatment with DAPT almost abolished the ability to form colonies in the 029 and 036 cultures (), suggesting that these cells had lost some of their malignant phenotype. Again, no effect and thus no decrease in colony formation was observed in the low Notch expressing 048 culture. Representative pictures of a DAPT responsive culture are shown in .
Figure 4. Notch inhibition hampers in vitro tumorigenic potential. Colony formation assay in soft-agar with the addition of 10 µM DAPT or DMSO performed on (A) DAPT-naïve cells or (B) DAPT-pretreated cells. Bars shows the relative mean of colonies formed after 14 d ± SEM. Stars represent the difference between the mean of control and treated. *P < 0.05, ***P < 0.001. (C) Representative photos of the colony formation assay.
DAPT treatment hampers neurosphere formation in primary culture but not in later passages and does not affect differentiation level
When GBM cells from tumor tissue are initially plated in NB-media in order to establish a primary in vitro culture, the bCSC can be identified by their ability to form neurospheres which are assumed to be clonal or aggregated proliferating cell aggregates.Citation47,Citation48 Thus the fraction of GBM cells forming spheres in the primary culture can be interpreted as a semi-quantification of the stem-like cell population in the tumor. To study the importance of Notch signaling for the primary neurosphere growth and thus quantifying the size of the bCSC fraction, single cells from acutely dissociated subcutaneous xenograft GBM tissue were subjected to a primary sphere forming assay with the addition of different concentrations of DAPT. In this assay, we included additional subcutaneous xenograft tumors derived from two other GBM patients, 017p4 and 047p2, with low and high Notch-1 expression, respectively (). The relative fraction of spheres formed per total number of cells plated is presented in . The ability to form spheres in the primary culture was notably inhibited in a DAPT concentration-dependent manner in the 029p5, 036p8, 036p15, and 047p2 cultures whereas no effect was observed in the 017p4 and 048p7 cultures. In , the Notch-1 expression in the xenograft tumors, from which the cultures used in the primary sphere assay were established, is presented. Together the results in indicate that DAPT treatment only affects primary sphere formation in cultures derived from xenografts defined as having high Notch-1 expression.
Figure 5. DAPT treatment affects primary neurosphere formation but not sub sphere formation or differentiation level. (A) Primary sphere formation assay performed on acutely dissociated GBM xenograft cells with the addition of 0, 1, 5, or 10 µM DAPT. Notice that 0µM DAPT was used as control for 029p5, 036p8, 047p2, and 048p7, while DMSO was used for 017p4 and 036p15. (B) WB detection of Notch-1 in xenograft tumor tissue from which the acutely dissociated GBM cells for the primary sphere assay were derived. (C) Sub-sphere formation assay performed on naïve cells treated with 5 µM DAPT or DMSO or (D) pretreated cells with the addition of 10µM DAPT or DMSO. In (A, C, and D) bars show relative mean of spheres formed after 14 d ± SEM. Stars represent the difference between the mean of control and treated. *P < 0.05, **P < 0.01, ***P < 0.001. N.A., not analyzed. (E and F) WB detection of markers for differentiation in neurosphere cells treated in parallel to (C and D) respectively. GFAP for astrocytes, βIII-tubulin for neurons and CNPase for Oligodendrocytes. Naïve cells are displayed in (E) and pretreated in (F).
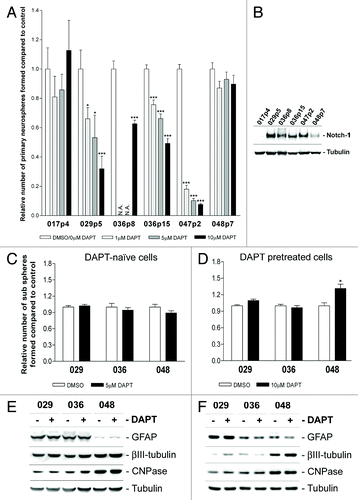
Others have shown that Notch pathway blockade reduces the self-renewal capacity in both normal NSC and in GBM sphere cultures as demonstrated by reduced sub-sphere formation upon γ-secretase inhibitor (GSI) treatment.Citation41,Citation49 In order to investigate if Notch activity was important for the self-renewing capacity in our GBM neurosphere cultures, neurosphere cells were subjected to a sub-sphere assay with the addition of DAPT. The assay was performed both on DAPT-naïve and pretreated cells as with the soft-agar assay. As shown in no inhibitory effect of DAPT on sub-sphere formation in either of the setups was observed.
Stem-like cells have the capacity to uphold an immature state and produce more differentiated daughter cells,Citation47,Citation50,Citation51 and it is suggested that Notch expressing cells during normal development are prevented from undergoing differentiation.Citation52 To test if Notch activity plays a role in maintaining an undifferentiated pool of cells within our GBM neurosphere cultures, naïve or pretreated neurosphere cells, in parallel to the sub-sphere assay were harvested for WB analyses of markers representing the three neural lineages; GFAP for astrocytes, CNPase for oligodendrocytes, and βIII-tubulin for neurons. As shown in , no consistent change in the expression of these differentiation markers was detected in either the naïve or pretreated GBM neurosphere cells. Furthermore, no effect on the expression of the NSC marker Nestin was observed (Fig. S3).
Notch activation affects neurosphere stem cell characteristics and increases tumorigenicity
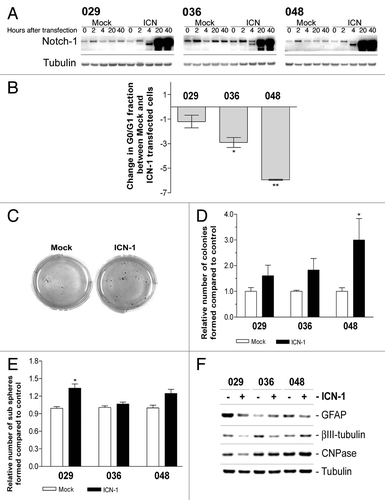
In order to study the effect of Notch pathway activation, we introduced a truncated, constitutively active form of the Notch-1 receptor (ICN-1) into our GBM neurosphere cultures by transient transfection. A time profile of total Notch-1 expression in ICN-1 and mock transfected neurosphere cells is shown in . Four hours after transfection a double band could be detected, where the upper band most likely represents the uncleaved transmembrane domain of endogenous Notch-1 and the lower band the intracellular Notch-1 domain, indicating successful transfection. At 20 and 40 h, the expression was further elevated compared with the mock transfected cells. It should be noticed that the transfection efficiency in general was highest in the 048 culture (~75%) and lowest in the 029 culture (<25%) and that it subsided after approximately nine days, estimated as the fraction of green fluorescent cells (data not shown). When transfected cells were subjected to cell cycle analysis a decrease in the fraction of cells in the G0/G1 phase could be detected in all three cultures (). The 048 culture displayed the largest decrease in the G0/G1 fraction, while the 029 culture did not respond to the same degree. Again, we were concerned that the decrease in the G0/G1 fraction reflected an increase in the sub-G0/G1 fraction. Therefore, ICN-1 and mock transfected cells were subjected to a soft-agar assay and the number of colonies was scored after two weeks. In general the ICN-1 transfected cells produced larger colonies than the mock transfected cells, indicating an increased cell cycle (representative photos are shown in ). When quantified, an increase in the colony forming potential was observed in the ICN-1 transfected cells as compared with the mock transfected cells (). This effect was more pronounced in the low Notch-1 expressing 048 culture. Finally, as DAPT treatment did not affect the stem cell characteristics of the neurosphere cells as exemplified by lack of effect on sub-sphere formation and differentiation status (), we performed the same experiments on ICN-1 transfected cells to explore if these stem cell characteristics could be affected by increasing the Notch activity. As demonstrated in , a slight increase in the number of sub-spheres formed was observed upon ICN-1 transfection. When analyzing the expression of neuronal and glial markers after ICN-1 transfection () all three markers were downregulated in the 029 culture implying de-differentiation, while the 036 and 048 cultures only showed downregulation of one of the markers, βIII-tubulin and GFAP respectively. The modest effect on sub-sphere formation and differentiation level might be due to the fact that the analyses were performed on the whole culture and not only the ICN-1 transfected cells. However, the above outlined results indicate that it is possible to activate Notch signaling to a degree where it affects the stem cell characteristics of the GBM neurosphere cultures.
Figure 6. Transfection with ICN-1 results in opposite effect from DAPT treatment and affects stem cell characteristics. (A) Expression of total Notch-1 in cultures transfected with ICN-1 or mock plasmid after 0, 2, 4, 20, or 40 h. (B) Cell cycle analysis of neurosphere cultures transfected with ICN-1 or Mock and left for three days. Bars represent the difference in the G0/G1 fraction ± SEM between Mock and ICN-1 transfected samples from at least two independent experiments performed in mono- or duplicates. Negative bars correspond to a decrease in the G0/G1 fraction in the ICN-1 transfected samples compared with the mock samples. Comparisons of means between Mock and ICN-1 were based in the paired t-test performed on the untransformed data. (C) Representative photos of soft-agar assay performed on cells transfected with ICN-1 or Mock. (D) Quantification of colonies formed in the soft-agar assay with ICN-1 or Mock transfection. Bars shows the relative mean of colonies formed after 14 d ± SEM (E) Sub sphere formation assay performed on cells transfected with ICN-1 or Mock. Bars show relative mean of spheres formed after 14 d ± SEM. For (B, D, and E) stars represent the difference between the mean of control and treated. *P < 0.05, **P < 0.01. (F) WB detection of markers for differentiation in neurosphere cells treated parallel to (E). GFAP for astrocytes, βIII-tubulin for neurons, and CNPase for oligodendrocytes.
Discussion
Given the potential role for bCSC in tumor development, maintenance, resistance to therapy, and relapse, it is of great importance to further understand the mechanism(s) involved in bCSC regulation. In the present study we have investigated the role of Notch signaling for the stem cell-like and tumorigenic potential of GBM neurosphere cells. We have established GBM neurosphere cultures from human-derived GBM xenografts and identified these as harboring cells with bCSC features. All cultures investigated in this study expressed Notch-1 and the downstream target Hes-1 at various levels. In cultures with high Notch-1 and Hes-1 expression, inhibition of Notch signaling led to decreased cell growth as displayed by decreased number of clonogenic colonies, most likely as a consequence of cell cycle inhibition. In opposite, when introducing a constitutively activated variant of Notch-1, an increase in cell growth was obtained. Furthermore, both the self-renewing capacity and de-differentiation level were increased in all cultures upon Notch activation. These stem-like features were, however, not affected by inhibition of endogenous Notch signaling. Nevertheless, as the primary sphere forming capacity was clearly reduced upon Notch inhibition, our data together imply that active Notch signaling plays a role in maintaining the bCSC population in the high Notch-1 expressing GBM cultures.
Others have shown that the Notch receptors and components of the Notch signaling pathway are differently expressed in GBM as well as in GBM-derived cultures.Citation16,Citation33-Citation37 In consensus, two of the cultures used in this study, the 029 and 036 cultures, showed elevated expression of the Notch-1 receptor and Hes-1 as compared with the 048 culture, indicating that the Notch pathway has a higher activation level in the former cultures. It should be considered that additional Notch receptors (Notch-2–4) and downstream targets, other than Hes-1, could be of importance for the outcome of Notch activity in these cultures and we can therefore not exclude that 048 has high Notch pathway activity. However, as this culture in general displayed insensibility toward Notch inhibition, this is not a likely scenario. Substantiating this, Hes-1 expression was most prominently downregulated upon DAPT treatment, as has been shown by others,Citation40,Citation41 in cultures that were also affected on a functional level, namely the 029 and 036 cultures. Hes-1 is a member of the bHLH family and mediates Notch signaling by acting as a transcriptional repressor and thousands of potential binding sites for Hes-1 have been identified.Citation53 Thus attenuation of Hes-1 expression has multiple potential functional effects. It is moreover important to hold in mind that several additional Notch targets have been reported. Besides Hes-2–7, also the bHLH transcriptional repressors Hey-1, -2, and -L,Citation54 GFAPCitation55 that, apart from being an astrocytic marker, also is expressed in postnatal NSC,Citation56,Citation57 the NSC marker NestinCitation58,Citation59 as well as the cell cycle regulators p21 and Cyclin D1Citation46,Citation60,Citation61 have been suggested as Notch targets and the list continues to elongate. Thus, as active Notch signaling has multiple targets and each target affects even more downstream mediators, it is naïve to conclude that Hes-1 is the sole explanation for the effects observed upon Notch modulation. Nevertheless, the functional effect of Hes-1 seems to be more prominent and severe than the effect of the other Hes proteins (reviewed in ref. Citation62). Furthermore, the data presented here suggest that the effect of γ-secretase inhibition can be predicted by the Hes-1 expression level, as DAPT treatment only had a functional effect on GBM neurosphere cultures with high endogenous Hes-1expression. It could therefore be speculated that Hes-1 could either be used as a predictive marker for Notch-directed targeted therapy or function as a therapeutic target itself.
To explore the functional role of Notch in our neurosphere cultures, different cellular in vitro assays evaluating cell growth were utilized. These assays combined can be interpreted as a measurement of the in vitro tumorigenic potential of the cells examined. Notch inhibition resulted in an increase in the G0/G1 cell fraction of the 029 and 036 cultures, whereas 048 remained unaffected. Furthermore, no obvious change in the number of dead cells was observed in 029 and 036, and an increase of p21 was seen in 036, a phenomenon also described by others.Citation46 These data indicate that inhibition of Notch signaling in GBM neurosphere cells with high endogenous Notch activity leads to cell cycle arrest or slowing of the cell cycle without induction of cell death, a notion supported by our results showing progression through G0/G1 upon artificial Notch activation. Others have shown that Notch-1 knock down leads to upregulation of p21 together with cell cycle arrest in G0/G1.Citation46,Citation61 These studies were however performed in different cancer types and they moreover detected an increase in apoptosis which is in contrast to our findings. Nevertheless, our results support previously published data on the effect of Notch inhibition on the cell cycle in NSC and various cancer types including GBMCitation40,Citation46,Citation60,Citation61,Citation63,Citation64 and as such we suggest that Notch activity is involved in GBM neurosphere cell growth and perhaps more specifically in the G0/G1–S phase transition. This statement is further supported by our results from the soft-agar clonogenic growth assay, which is a commonly used in vitro tumorigenic assay as it evaluates the capability for anchorage- and cell–cell contact independent clonogenic growth, a capability only cancer cells posses.Citation65,Citation66 We did not observe any difference in colony formation when naïve cells were treated with DAPT. However, when the cells were pretreated and then subjected to the assay the clonogenic growth potential was clearly reduced in the 029 and 036 cultures, which is in line with previous data from Fan et al.Citation40 This discrepancy between naïve and pretreated cells might reflect that Notch inhibition leads to increased differentiation of neurosphere forming cells, as has been shown by others in NSC, glioma cells and bCSC,Citation34,Citation41,Citation52 into lineage restricted progenitor cells that are still able to proliferate and form colonies. Progenitor cells do, however, not have the capability to self-renew and become proliferative exhausted over time (reviewed in refs. Citation67 and Citation68) and therefore DAPT-pretreated neurosphere forming cells that had have differentiated into progenitor cells would not form colonies upon replating. On the opposite, when the cells were transfected with the constitutively activated Notch-1 receptor we found an elevated capability to form colonies in soft agar. The effect of Notch activation was observed in all 3 cultures. However, as with the cell cycle analysis it was more prominent in 048, most likely due to the high transfection efficiency in this culture as compared with the other cultures. It could also be speculated that cells with high endogenous Notch activation, like the 029 and 036 cultures, do not benefit from increased ICN-1 levels to the same degree as the 048 culture with low Notch activation. Nevertheless, the above discussed results suggest that activated Notch signaling leads to increased clonogenic proliferation and thus enhanced malignant potential.
The above data support results recently published by Fan et al., who showed that Notch inhibition using different γ-secretase inhibitors led to decreased cell viability and Hes-1 expression in GBM neurosphere cultures whereas transfection of the cells with the intracellular Notch-2 receptor resulted in increased cell growth.Citation40 They stated that Notch-2 activation was sufficient to promote GBM neurosphere cell growth. It is however important to point out that γ-secretase inhibitors do not specifically target one Notch receptor, but instead inhibit activation of all 4 receptors. As such, it is at this point not possible to conclude if the two receptors are equally important for GBM neurosphere cell growth or if there is some kind of redundancy between the two receptors with regard to their functional relevance.
The role of Notch signaling during normal development including NSC regulation is firmly established; however, we are only beginning to elucidate its role in bCSC regulation.Citation36,Citation40-Citation42 NSC and bCSC are commonly identified by their sphere forming capacity in culture, and thus the number of spheres formed in primary culture from acutely dissociated tumor tissue can be interpreted as a semi-quantification of the bCSC population in the tumor tissue sample. A correlation between primary neurosphere formation and survival of glioma patients has been suggestedCitation69,Citation70 and it has been shown that the vast majority of GBM tumors could be established and maintained as neurosphere cultures, whereas lower grade gliomas mostly lacked this ability.Citation70 We have successfully established neurosphere cultures from every human-derived GBM xenograft tumor attempted in this and previous studies.Citation17 Furthermore, here we show that the ability for primary neurosphere formation could be reduced in a DAPT concentration-dependent manner in cultures with high endogenous Notch activity, indicating a decline in the bCSC population in the primary culture upon Notch inhibition. These observations are in line with previously published results showing that GSI treatment decreases the number of primary spheres formed from GBM and normal NSCCitation41 and support the idea of Notch inhibition as a way to target the bCSC population and improve patient survival. One might question, that despite the low level of Notch-1 protein in the 017p4 xenograft, these cells were still able to form spheres in the primary culture. This observation does, however, merely imply that additional pathways play a role for the bCSC capacity in the sphere forming GBM cells with low Notch activity.
Surprisingly, when the sphere assay was performed on latter passage cultures, no effect of DAPT treatment on neurosphere formation was observed. Thus, it seems as if Notch activity is only important for maintenance of the bCSC in the primary culture and not in later passages. This hypothesis was supported when we found no or little effect of DAPT on the expression of differentiation markers, which suggests that the differentiation level of the cultures was maintained despite of Notch inhibition. Taken together, these data suggest that although it is possible to inhibit neurosphere growth in primary cell cultures, neither the self-renewing capacity nor differentiation level, both reflecting stem-like features, are dependent on Notch signaling in any of our long-term neurosphere cultures, although Notch-1 expression and activity, as assessed by Hes-1 expression, are maintained.
One might argue that the primary, sub-sphere, and soft-agar assays all reflect a stem cell feature, namely the capability to form proliferating cell aggregates, and Notch inhibition as such should result in similar outcome in the different assays. There are, however, fundamental differences between the three assays. First of all, the soft-agar assay differs from the sub-sphere assay as the cells are embedded in a semi-solid agar with no possibility of cell–cell contact and signaling and are thus dependent on growth factors in the media and endogenic signaling for proliferative activity. In contrast, in the sub-sphere assay the cells float around in the media and are able to interact and as such, the formation of a neurosphere is not by certainty the result of clonogenic growth in the sub-sphere assay, which is in contrast to the case in the soft-agar assay. Furthermore, the cell–cell interaction in the sub-sphere assay might enable activation of additional pathways that overrule the Notch inhibition. Indeed pathways, such as the EGFR, Wnt, and SHH pathways, have been shown to be important for bCSC maintenance and growthCitation71,Citation72 (and reviewed in ref. Citation73), and it has furthermore been demonstrated that aggregation promotes proliferation of NSC.Citation48 This functional redundancy of pathways might reflect the fact that normal stem cells are crucial for upholding the organism and thus have multiple possibilities for self maintenance and protection. Second, when acutely dissociated cells from the xenograft tumor biopsy initially were subjected to NB-media, no cell sorting was performed. As such, all the different cell types present in the tumor were most likely present during establishment of the primary neurosphere culture. Over time and with increasing passages, the NB-media would select for cells with stem cell-like potential and their derivates, and fully differentiated cells that were present in the original tumor, such as stromal and endothelial cells would be eliminated. As activation of Notch signaling requires receptor–ligand interaction and as Notch signaling is known to occur between two adjacent cells (although cell autonomous ligand-receptor interaction has been demonstratedCitation74), it is reasonable to speculate that the Notch signaling is activated by different means in the primary culture as compared with later passage cultures. In that context, it has been shown that the Notch-1 receptor and the Notch ligands Dll-1 and -3 and Jag-1 and -2 are expressed in different brain regionsCitation26 and thus most likely by different cell types and that Dll-4 is expressed by GBM endothelial cells.Citation75 This means that in the primary sphere assay, Notch signaling in the bCSC could be activated by ligand-bearing cells of different origin, while it in the later passage cultures occurs between cells of the same origin. As such, it is possible that these two scenarios lead to different Notch activation levels in the primary and later passages cultures, and also that there is a threshold level for Notch activity, over which it has an influence on the stem cell-like features of the bCSC. Indeed, it has been shown that modulation of Notch activity has different outcome depending on the endogenous Notch activation level in NSC.Citation76 One could thus argue that in the primary culture Notch activity would be activated over the threshold level and thereby able to exert its effect on the bCSC population, whereas the activity would be below the threshold level in the later passage culture, and thus inhibition of Notch signaling would have no or little effect on the stem cell characteristics. This hypothesis was substantiated by our results using artificially activated Notch signaling. Here we did obtain an effect on the sub-sphere forming potential and differentiation level. The effect was not as convincing as the effect on the cell growth potential, but there was nevertheless a tendency toward an increase in the number of sub-spheres and a decrease in the expression of differentiation markers suggesting that the bCSC population was expanded. This was further supported by an increase in the clonogenic growth potential observed in the soft-agar assay when using constitutively activated Notch. Thus, even if inhibition of endogenous Notch signaling did not affect the stem cell characteristics of later passage neurosphere cultures, the Notch activity could be artificially boosted to a level where it indeed affected the stem cell-like potential.
Another explanation for the lack of effect from DAPT treatment on the stem-cell features in later passages could be that the bCSC population displaying Notch activity might only constitute a small fraction of the entire culture. It is thus not unlikely that the effect from Notch inhibition on the bCSC characteristics is too subtle to be appropriately detected. However, as we detected a pronounced decrease in clonogenic cell growth possibly due to reduced cell cycling upon inhibition of endogenous Notch signaling, our results indicate that also tumor cells without stem cell-like features, representing a non-bCSC population, are affected by Notch inhibition as has been shown by others.Citation34,Citation39
In conclusion, we have shown that it is possible to target both the tumorigenic potential and the stem cell-like features of GBM neurosphere cells by Notch pathway modulation and that Notch inhibition only affects cells with high endogenous Notch activity. The differences in Notch expression and activation, leading to differences in sensitivity toward Notch inhibition might reflect that the neurosphere cultures used in this study belong to different subtypes of GBM. Indeed, it has recently been published that GBM tumors can be divided into several subclasses based on their molecular expression profile and clinical appearance.Citation35,Citation38,Citation77 As such the 029 and 036 cultures might belong to a subclass characterized by Notch activation, whereas the 048 culture could belong to a subtype in which Notch signaling is of less importance. Taken together we suggest that using a treatment regime that includes Notch inhibition together with stratifying patients according to Notch pathway activity using, e.g., subtype profiling, could improve the prognosis for GBM patients by reducing both the bCSC and the non-bCSC populations.
Materials and Methods
Ethics statement
In a previous studyCitation17 patient GBM material (GBM_CPH017, GBM_CPH029, GBM_CPH036, GBM_CPH047, and GBM_CPH048) was obtained from surgery at Copenhagen University Hospital, Denmark, approved by the Scientific Ethical Committee for Copenhagen and Frederiksberg: (KF) 01-034/04 with the patients’ informed consent and maintained over several passages as subcutaneous xenografts on the flank of nude mice, according to Danish legislation.
Establishing and maintaining GBM xenografts as in vitro neurosphere cultures
Neurosphere cultures were established from acutely dissociated patient-derived subcutaneous xenograft tumors and maintained in NB-media (Neurobasal-A media supplemented with 1× B-27 Supplement, 1× l-glutamine, 10 ng/ml basic fibroblastic growth factor (bFGF), 10 ng/ml epidermal growth factor (EGF), 1% Pen Strep (penicillin–streptomycin) (all from Invitrogen), and 10 ng/ml leukemia inhibitory factor (LIF) (Chemicon) as previously described.Citation17 The cells were cultivated in uncoated cell culture flasks (NUNC) in a humidified chamber with 5% CO2 at 37 °C. Fresh media was added twice a week and spheres were mechanically dissociated at every passage. Three different neurosphere cultures were used in the present study: GBM_CPH029p7, NGBM_CPH036p7, and NGBM_CPH048p6, unless otherwise stated, corresponding to three different patient-derived xenograft tumors. pX indicates the mouse passage from which the individual cultures were established. The prefix “N” refers to that the xenograft has been transplanted onto rats for a period to remove mouse hepatitis infection. For simplicity, the three cultures are designated 029, 036, and 048 respectively.
Modulation of Notch signaling in neurosphere cultures
For Notch inhibition studies, neurospheres were dissociated into single cells and plated in NB-media in either petri dishes (10 cm Ø, NUNC) for pretreatment or directly in a suitable assay plate (see below) and allowed to grow overnight (ON) unless otherwise stated. The latter will be designated DAPT-naïve cells. N-[N-(3,5-difluorophenacetyl-l-alanyl)]-S-phenylglycine t-butyl ester [DAPT, γ-secretase inhibitor (GSI) IX, Calbiochem] dissolved in dimethyl-sulfoxide (DMSO) hybri-max (Sigma) was added the following day, unless otherwise stated, at a concentration of either 1, 5, or 10 µM. Equal volumes of DMSO were used as control, unless stated otherwise. Pretreated cells were re-dissociated at day seven, plated in a suitable assay plate corresponding to the DAPT-naïve cells and re-treated with compounds equivalent to pre-treatment. The DAPT concentrations used in this study were based on previous studies using DAPT and additional γ-secretase inhibitors.Citation40,Citation41,Citation44,Citation63
For Notch activation studies, the following plasmid vectors were used: pcDNA3.1(+)-i.c.Notch-1 (kindly provided by J. Aster) coding for the constitutively activated intracellular Notch-1 domain (ICN-1) and pcDNA3.1(+) (Invitrogen) used as a control. Neurospheres were dissociated into single cells and transfected for 3 h with 3 µg plasmid using 12 µL Lipofectamine 2000 in Opti-MEM Reduced Serum Medium (both from Invitrogen). Transfection efficiency was estimated by co-transfection with pEGFP-N1 (Clontech) and manual scoring of the proportion of cells expressing EGFP by fluorescence microscopy. Following transfection, the cells were re-plated in NB-media and left for one day before subjected to an assay unless otherwise mentioned.
Differentiation and immunocytochemistry
Spheres were mechanically dissociated into single cells and plated in an 8-well chamber slide (NUNC) in 100 µl of NB-media at a density of 25–100 cells/µl. 300 µl Dulbecco's modified Eagle medium (DMEM), with 10% fetal calf serum (FCS) and 1% Pen Strep (all from Invitrogen) was added. The cells were left to differentiate for 7 d and subsequently fixed using a 1:1 mix of acetone and methanol, permeabilized in a Triton X-100 solution and blocked using 3% bovine serum albumin (BSA, Sigma). The cells were then incubated ON with primary antibody diluted in 1% BSA in PBS followed by tetramethyl rhodamine isothiocyanate (TRITC) conjugated secondary antibody. Object glasses were mounted with Glycergel (Dako). TRITC was excitated at 557nm and positive cells were visualized using Nikon Eclipse TS100 microscope, Nikon digital camera DXM1200F, and software NIS-Elements F 3.0 Nikon. Primary antibodies: Rabbit polyclonal anti-Glial Fibrillary Acidic Protein (GFAP, Dako), Mouse monoclonal anti-CNPase [11-5B] (Abcam) and Mouse monoclonal anti-tubulin, β III isoform [TU-20] (βIII-tubulin, Chemicon). Secondary antibodies: TRITC-Conjugated polyclonal rabbit anti-mouse IgG, TRITC-Conjugated polyclonal swine anti-rabbit IgG (both from Dako).
Western blotting
Whole cell lysates were prepared from cell pellets by sonication in ice-cold RIPA buffer (50 mM Tris-HCL [pH 7.4], 1% NP40, 0.25% Na-deoxycholate, 150 mM NaCl, 1 mM EDTA) supplemented with protease and phosphatase inhibitor mixture II and III (Calbiochem). Protein concentrations were determined using the BCA protein assay (Pierce) according to manufactures instructions. For western blotting (WB) 30–50 µg protein was separated on either 4–12% NuPAGE Bis-Tris gels or 3–8% NuPAGE Tris-Acetat gels (Invitrogen) and electroblotted onto nitrocellulose membranes (Invitrogen) according to manufacturers’ protocol. The membranes were then blocked for 1 h in 5% non-fat milk at room temperature (RT) and incubated with primary antibody diluted in 5% non-fat milk ON at 4 °C followed by horseradish peroxidase (HRP) conjugated secondary antibodies for 1 h at RT. Blots were developed using the SuperSignal West Dura Extended Duration Substrate (Thermo Scientific) and the UVP, BioSpectrum® AC Imaging System and VisionWorks®LS software (UVP). Primary antibodies: goat polyclonal anti-Notch-1 [S-20], rabbit polyclonal anti-GAPDH (all from Santa Cruz), rabbit polyclonal anti-Hes-1 (kindly provided by Dr Tetsou Sudo, Toray Industries Inc.), mouse monoclonal anti-Nestin [10C2], mouse monoclonal anti-Tubulin, β III isoform [TU-20] (both from Chemicon), rabbit monoclonal anti-cleaved caspase-3 [5A1E], rabbit monoclonal anti-BAX, mouse monoclonal anti-CDK4 [DCS156], Mouse monoclonal p21 Waf1/Cip1 [DCS60], rabbit monoclonal anti-α-Tubulin [11H10] (all from Cell Signaling), rabbit polyclonal anti-Glial Fibrillary Acidic Protein (GFAP, Dako), mouse monoclonal anti-CNPase [11–5B], (Abcam). Secondary antibodies: rabbit polyclonal anti-mouse IgG, rabbit polyclonal anti-goat IgG, and swine polyclonal anti-rabbit IgG (all from Dako).
Quantitative real-time polymerase chain reaction
Total RNA was extracted from cell pellets using QIAshredder columns and RNeasy Mini KIT (both from Qiagen) according to manufacturer’s protocol. All RNA was DNase treated using the RNase-Free DNase Set from Qiagen. cDNA was synthesized followed by RNase H treatment according to manufacturers protocol using SuperScriptTM III Platinum® Two Step q-RT-PCR kit with SYBR® GREEN (Invitrogen) which was also used for the subsequently Quantitative Real-Time PCR (Q-RT-PCR) reactions. The ΔΔ-Ct method was used for calculating the normalized gene expression. All data was normalized to the expression of three housekeeping genes (TOP1, CYC1, and EIF4A2) included in the human geNorm housekeeping gene selection kit (Primerdesign). Primers used: Hes-1 forward: 5′-AGCGGGCGCA GATGAC-3′, Hes-1 reverse: 5′-CGTTCATGCA CTCGCTGAA-3′.
Primary sphere assay
Single cells from acutely dissociated xenograft tissue were plated in 96-well plates at a density of 10 cells/µl in 200 µl NB-media and directly treated with 1, 5, or 10 µM DAPT. For control 0 µM DAPT or equal volumes of DMSO was added. At day 14, the number of spheres per well was scored and primary sphere frequency calculated. It should be mentioned that the cultures presented in the primary sphere assay are not derived from the same xenograft tumor passage as the cultures used in the additional in vitro experiments, although they are derived from the same original patient tumor. The cultures presented in the primary sphere assay are NGBM_CPH017p4, NGBM_CPH029p5, NGBM_CPH036p8, NGBM_CPH036p15, NGBM_CPH047p2, and NGBM_CPH048p7. For simplicity, the cultures are designated 017p4, 029p5, 036p8, 036p15, 047p2, and 048p7 respectively. 017p4 and 047p2 are xenograft tumors derived from two additional patient tumors and only used in this assay. Furthermore, the 017p4 tumor has been cultured in vitro in NB-media between the primary xenograft tumor and the xenograft tumor from which the primary sphere assay was performed. For the 029p5, 038p8, 047p2, and 048p7 cultures, 0 μM DAPT was used as a control. For the 017p4 and 036p15, DMSO was the control.
Sub-sphere assay
Dissociated neurosphere cells from later passages, either transfected with ICN-1, DAPT-naïve, or pretreated with 10 µM DAPT as described above, were plated in 96-well plates at 100 cells per well in 200 µl NB-media. Cells were treated with 0, 5, or 10 µM DAPT and the total number of spheres was scored after 2 weeks. In addition dissociated sphere cells were plated by limiting dilution at 0.5 cells/well without modulation for observation of single cell-derived spheres.
Cell cycle analysis
Dissociated sphere cells were either transfected with ICN-1or treated with 5μM DAPT for 72 h where after the cells were harvested, fixed in 70% ice cold ethanol and resuspended in a propidium iodide solution (50 μg/ml of propidium iodide, 10 mM Tris, 5 mM MgCl2, 10 μg/ml of ribonuclease A, and 1 μl/ml of NP-40 (propidium iodide and ribonuclease A were purchased from Sigma-Aldrich). DNA content of the samples was quantified using a FACS Canto flow-cytometer and data were analyzed using the FACS Diva software program (BD Biosciences).
Soft-agar assay
1 × 10⁵ dissociated neurosphere cells, either transfected with ICN-1, DAPT-naïve, or pretreated with 10 µM DAPT as described above, were plated in semisolid agar with NB-media in a 6-well plate. DAPT-naïve and pretreated cells were supplemented with 10 μM DAPT in the assay. At day 14, the colonies were stained with 0.005% crystal violet and the number of colonies was visualized by the UVP BioSpectrum® AC Imaging System (UVP) and manually quantified.
Statistics
Except for western blot analyses, data from in vitro cellular assays were obtained from at least 3 independent experiments each performed in duplicates or more unless otherwise stated. The primary sphere assay was, however, only performed once and in sextuplicates, as repeats were not possible. Data are shown as mean ± standard error of the mean (SEM) unless otherwise stated. For statistic analyses data was log-transformed and comparisons of means between control and treatment were based on the one-way ANOVA test at 0.05 significance level unless otherwise stated.
| Abbreviations: | ||
| bCSC | = | brain cancer stem-like cells |
| DAPT | = | N-[N-(3,5-difluorophenacetyl-L-alanyl)]-S-phenylglycine t-butyl ester |
| GBM | = | glioblastoma multiforme |
| GSI | = | γ-secretase inhibitor |
| ICN-1 | = | intracellular Notch-1 domain |
| NSC | = | neural stem cells |
| G0/G1 | = | cell cycle phase where the cells are non-dividing |
Additional material
Download Zip (216.5 KB)Acknowledgments
We thank statistician Susanne Rosthøj for assistance performing the statistical analysis and technician Pia Pedersen for skilful technical assistance. We thank the following organizations for funding the project: The Faculty of Health Sciences, University of Copenhagen (211-0610/09-3012); Dansk Kraeftforsknings fond; Kong Christian den Tiendes Fond; Civilingenioer Frode V. Nyegaard og Hustrus Fond and Harboefonden.
Disclosure of Potential Conflicts of Interest
No potential conflict of interest was disclosed.
References
- Ohgaki H, Kleihues P. Population-based studies on incidence, survival rates, and genetic alterations in astrocytic and oligodendroglial gliomas. J Neuropathol Exp Neurol 2005; 64:479 - 89; PMID: 15977639
- Filippini G, Falcone C, Boiardi A, Broggi G, Bruzzone MG, Caldiroli D, et al, Brain Cancer Register of the Fondazione IRCCS (Istituto Ricovero e Cura a Carattere Scientifico) Istituto Neurologico Carlo Besta. Prognostic factors for survival in 676 consecutive patients with newly diagnosed primary glioblastoma. Neuro Oncol 2008; 10:79 - 87; http://dx.doi.org/10.1215/15228517-2007-038; PMID: 17993634
- Stupp R, Hegi ME, Mason WP, van den Bent MJ, Taphoorn MJ, Janzer RC, et al, European Organisation for Research and Treatment of Cancer Brain Tumour and Radiation Oncology Groups, National Cancer Institute of Canada Clinical Trials Group. Effects of radiotherapy with concomitant and adjuvant temozolomide versus radiotherapy alone on survival in glioblastoma in a randomised phase III study: 5-year analysis of the EORTC-NCIC trial. Lancet Oncol 2009; 10:459 - 66; http://dx.doi.org/10.1016/S1470-2045(09)70025-7; PMID: 19269895
- Globus JH, Kuhlenbeck H. The subependymal cell plate (matrix) and its relationship to brain tumors of the ependymal type. J Neuropathol Exp Neurol 1944; 3:1 - 35; http://dx.doi.org/10.1097/00005072-194401000-00001
- Guillamo JS, Lisovoski F, Christov C, Le Guérinel C, Defer GL, Peschanski M, et al. Migration pathways of human glioblastoma cells xenografted into the immunosuppressed rat brain. J Neurooncol 2001; 52:205 - 15; http://dx.doi.org/10.1023/A:1010620420241; PMID: 11519850
- Lathia JD, Gallagher J, Myers JT, Li M, Vasanji A, McLendon RE, et al. Direct in vivo evidence for tumor propagation by glioblastoma cancer stem cells. PLoS One 2011; 6:e24807; http://dx.doi.org/10.1371/journal.pone.0024807; PMID: 21961046
- Bao S, Wu Q, Sathornsumetee S, Hao Y, Li Z, Hjelmeland AB, et al. Stem cell-like glioma cells promote tumor angiogenesis through vascular endothelial growth factor. Cancer Res 2006; 66:7843 - 8; http://dx.doi.org/10.1158/0008-5472.CAN-06-1010; PMID: 16912155
- Liu G, Yuan X, Zeng Z, Tunici P, Ng H, Abdulkadir IR, et al. Analysis of gene expression and chemoresistance of CD133+ cancer stem cells in glioblastoma. Mol Cancer 2006; 5:67; http://dx.doi.org/10.1186/1476-4598-5-67; PMID: 17140455
- Bao S, Wu Q, McLendon RE, Hao Y, Shi Q, Hjelmeland AB, et al. Glioma stem cells promote radioresistance by preferential activation of the DNA damage response. Nature 2006; 444:756 - 60; http://dx.doi.org/10.1038/nature05236; PMID: 17051156
- Ignatova TN, Kukekov VG, Laywell ED, Suslov ON, Vrionis FD, Steindler DA. Human cortical glial tumors contain neural stem-like cells expressing astroglial and neuronal markers in vitro. Glia 2002; 39:193 - 206; http://dx.doi.org/10.1002/glia.10094; PMID: 12203386
- Singh SK, Clarke ID, Terasaki M, Bonn VE, Hawkins C, Squire J, et al. Identification of a cancer stem cell in human brain tumors. Cancer Res 2003; 63:5821 - 8; PMID: 14522905
- Galli R, Binda E, Orfanelli U, Cipelletti B, Gritti A, De Vitis S, et al. Isolation and characterization of tumorigenic, stem-like neural precursors from human glioblastoma. Cancer Res 2004; 64:7011 - 21; http://dx.doi.org/10.1158/0008-5472.CAN-04-1364; PMID: 15466194
- Yuan X, Curtin J, Xiong Y, Liu G, Waschsmann-Hogiu S, Farkas DL, et al. Isolation of cancer stem cells from adult glioblastoma multiforme. Oncogene 2004; 23:9392 - 400; http://dx.doi.org/10.1038/sj.onc.1208311; PMID: 15558011
- Günther HS, Schmidt NO, Phillips HS, Kemming D, Kharbanda S, Soriano R, et al. Glioblastoma-derived stem cell-enriched cultures form distinct subgroups according to molecular and phenotypic criteria. Oncogene 2008; 27:2897 - 909; http://dx.doi.org/10.1038/sj.onc.1210949; PMID: 18037961
- Singh SK, Hawkins C, Clarke ID, Squire JA, Bayani J, Hide T, et al. Identification of human brain tumour initiating cells. Nature 2004; 432:396 - 401; http://dx.doi.org/10.1038/nature03128; PMID: 15549107
- Lee J, Kotliarova S, Kotliarov Y, Li A, Su Q, Donin NM, et al. Tumor stem cells derived from glioblastomas cultured in bFGF and EGF more closely mirror the phenotype and genotype of primary tumors than do serum-cultured cell lines. Cancer Cell 2006; 9:391 - 403; http://dx.doi.org/10.1016/j.ccr.2006.03.030; PMID: 16697959
- Stockhausen MT, Broholm H, Villingshøj M, Kirchhoff M, Gerdes T, Kristoffersen K, et al. Maintenance of EGFR and EGFRvIII expressions in an in vivo and in vitro model of human glioblastoma multiforme. Exp Cell Res 2011; 317:1513 - 26; http://dx.doi.org/10.1016/j.yexcr.2011.04.001; PMID: 21514294
- Nye JS, Kopan R, Axel R. An activated Notch suppresses neurogenesis and myogenesis but not gliogenesis in mammalian cells. Development 1994; 120:2421 - 30; PMID: 7956822
- Lewis J. Neurogenic genes and vertebrate neurogenesis. Curr Opin Neurobiol 1996; 6:3 - 10; http://dx.doi.org/10.1016/S0959-4388(96)80002-X; PMID: 8794055
- Brennan K, Tateson R, Lewis K, Arias AM. A functional analysis of Notch mutations in Drosophila. Genetics 1997; 147:177 - 88; PMID: 9286678
- Wang S, Sdrulla AD, diSibio G, Bush G, Nofziger D, Hicks C, et al. Notch receptor activation inhibits oligodendrocyte differentiation. Neuron 1998; 21:63 - 75; http://dx.doi.org/10.1016/S0896-6273(00)80515-2; PMID: 9697852
- Lewis J. Notch signalling and the control of cell fate choices in vertebrates. Semin Cell Dev Biol 1998; 9:583 - 9; http://dx.doi.org/10.1006/scdb.1998.0266; PMID: 9892564
- Tanigaki K, Nogaki F, Takahashi J, Tashiro K, Kurooka H, Honjo T. Notch1 and Notch3 instructively restrict bFGF-responsive multipotent neural progenitor cells to an astroglial fate. Neuron 2001; 29:45 - 55; http://dx.doi.org/10.1016/S0896-6273(01)00179-9; PMID: 11182080
- Hämmerle B, Tejedor FJ. A novel function of DELTA-NOTCH signalling mediates the transition from proliferation to neurogenesis in neural progenitor cells. PLoS One 2007; 2:e1169; http://dx.doi.org/10.1371/journal.pone.0001169; PMID: 18000541
- Udolph G. Notch signaling and the generation of cell diversity in drosophila neuroblast lineages. In: Reichrath J, Reichrath S, ed(s). Notch signaling in embryology and cancer.New York, USA: Landes Bioscience and Springer+Business Media, 2012: 47-60.
- Stump G, Durrer A, Klein AL, Lütolf S, Suter U, Taylor V. Notch1 and its ligands Delta-like and Jagged are expressed and active in distinct cell populations in the postnatal mouse brain. Mech Dev 2002; 114:153 - 9; http://dx.doi.org/10.1016/S0925-4773(02)00043-6; PMID: 12175503
- Mizutani K, Yoon K, Dang L, Tokunaga A, Gaiano N. Differential Notch signalling distinguishes neural stem cells from intermediate progenitors. Nature 2007; 449:351 - 5; http://dx.doi.org/10.1038/nature06090; PMID: 17721509
- Beatus P, Lendahl U. Notch and neurogenesis. J Neurosci Res 1998; 54:125 - 36; http://dx.doi.org/10.1002/(SICI)1097-4547(19981015)54:2<125::AID-JNR1>3.0.CO;2-G; PMID: 9788272
- Eriksson PS, Perfilieva E, Björk-Eriksson T, Alborn AM, Nordborg C, Peterson DA, et al. Neurogenesis in the adult human hippocampus. Nat Med 1998; 4:1313 - 7; http://dx.doi.org/10.1038/3305; PMID: 9809557
- Kukekov VG, Laywell ED, Suslov O, Davies K, Scheffler B, Thomas LB, et al. Multipotent stem/progenitor cells with similar properties arise from two neurogenic regions of adult human brain. Exp Neurol 1999; 156:333 - 44; http://dx.doi.org/10.1006/exnr.1999.7028; PMID: 10328940
- Quiñones-Hinojosa A, Sanai N, Soriano-Navarro M, Gonzalez-Perez O, Mirzadeh Z, Gil-Perotin S, et al. Cellular composition and cytoarchitecture of the adult human subventricular zone: a niche of neural stem cells. J Comp Neurol 2006; 494:415 - 34; http://dx.doi.org/10.1002/cne.20798; PMID: 16320258
- Slowik F, Pásztor E, Szöllösi B. Subependymal Gliomas. Neurosurg Rev 1979; 2:79 - 86; http://dx.doi.org/10.1007/BF01649832
- Margareto J, Leis O, Larrarte E, Idoate MA, Carrasco A, Lafuente JV. Gene expression profiling of human gliomas reveals differences between GBM and LGA related to energy metabolism and notch signaling pathways. J Mol Neurosci 2007; 32:53 - 63; http://dx.doi.org/10.1007/s12031-007-0008-5; PMID: 17873288
- Kanamori M, Kawaguchi T, Nigro JM, Feuerstein BG, Berger MS, Miele L, et al. Contribution of Notch signaling activation to human glioblastoma multiforme. J Neurosurg 2007; 106:417 - 27; http://dx.doi.org/10.3171/jns.2007.106.3.417; PMID: 17367064
- Phillips HS, Kharbanda S, Chen R, Forrest WF, Soriano RH, Wu TD, et al. Molecular subclasses of high-grade glioma predict prognosis, delineate a pattern of disease progression, and resemble stages in neurogenesis. Cancer Cell 2006; 9:157 - 73; http://dx.doi.org/10.1016/j.ccr.2006.02.019; PMID: 16530701
- Zhang XP, Zheng G, Zou L, Liu HL, Hou LH, Zhou P, et al. Notch activation promotes cell proliferation and the formation of neural stem cell-like colonies in human glioma cells. Mol Cell Biochem 2008; 307:101 - 8; http://dx.doi.org/10.1007/s11010-007-9589-0; PMID: 17849174
- Hulleman E, Quarto M, Vernell R, Masserdotti G, Colli E, Kros JM, et al. A role for the transcription factor HEY1 in glioblastoma. J Cell Mol Med 2009; 13:136 - 46; http://dx.doi.org/10.1111/j.1582-4934.2008.00307.x; PMID: 18363832
- Verhaak RG, Hoadley KA, Purdom E, Wang V, Qi Y, Wilkerson MD, et al, Cancer Genome Atlas Research Network. Integrated genomic analysis identifies clinically relevant subtypes of glioblastoma characterized by abnormalities in PDGFRA, IDH1, EGFR, and NF1. Cancer Cell 2010; 17:98 - 110; http://dx.doi.org/10.1016/j.ccr.2009.12.020; PMID: 20129251
- Purow BW, Haque RM, Noel MW, Su Q, Burdick MJ, Lee J, et al. Expression of Notch-1 and its ligands, Delta-like-1 and Jagged-1, is critical for glioma cell survival and proliferation. Cancer Res 2005; 65:2353 - 63; http://dx.doi.org/10.1158/0008-5472.CAN-04-1890; PMID: 15781650
- Fan X, Khaki L, Zhu TS, Soules ME, Talsma CE, Gul N, et al. NOTCH pathway blockade depletes CD133-positive glioblastoma cells and inhibits growth of tumor neurospheres and xenografts. Stem Cells 2010; 28:5 - 16; PMID: 19904829
- Hu YY, Zheng MH, Cheng G, Li L, Liang L, Gao F, et al. Notch signaling contributes to the maintenance of both normal neural stem cells and patient-derived glioma stem cells. BMC Cancer 2011; 11:82; http://dx.doi.org/10.1186/1471-2407-11-82; PMID: 21342503
- Wang J, Wang C, Meng Q, Li S, Sun X, Bo Y, et al. siRNA targeting Notch-1 decreases glioma stem cell proliferation and tumor growth. Mol Biol Rep 2012; 39:2497 - 503; http://dx.doi.org/10.1007/s11033-011-1001-1; PMID: 21667253
- Hovinga KE, Shimizu F, Wang R, Panagiotakos G, Van Der Heijden M, Moayedpardazi H, et al. Inhibition of notch signaling in glioblastoma targets cancer stem cells via an endothelial cell intermediate. Stem Cells 2010; 28:1019 - 29; http://dx.doi.org/10.1002/stem.429; PMID: 20506127
- Wang J, Wakeman TP, Lathia JD, Hjelmeland AB, Wang XF, White RR, et al. Notch promotes radioresistance of glioma stem cells. Stem Cells 2010; 28:17 - 28; PMID: 19921751
- Aihara M, Sugawara K, Torii S, Hosaka M, Kurihara H, Saito N, et al. Angiogenic endothelium-specific nestin expression is enhanced by the first intron of the nestin gene. Lab Invest 2004; 84:1581 - 92; http://dx.doi.org/10.1038/labinvest.3700186; PMID: 15502861
- Wang Z, Zhang Y, Li Y, Banerjee S, Liao J, Sarkar FH. Down-regulation of Notch-1 contributes to cell growth inhibition and apoptosis in pancreatic cancer cells. Mol Cancer Ther 2006; 5:483 - 93; http://dx.doi.org/10.1158/1535-7163.MCT-05-0299; PMID: 16546962
- Engstrom CM, Demers D, Dooner M, McAuliffe C, Benoit BO, Stencel K, et al. A method for clonal analysis of epidermal growth factor-responsive neural progenitors. J Neurosci Methods 2002; 117:111 - 21; http://dx.doi.org/10.1016/S0165-0270(02)00074-2; PMID: 12100976
- Mori H, Ninomiya K, Kino-oka M, Shofuda T, Islam MO, Yamasaki M, et al. Effect of neurosphere size on the growth rate of human neural stem/progenitor cells. J Neurosci Res 2006; 84:1682 - 91; http://dx.doi.org/10.1002/jnr.21082; PMID: 17044035
- Gilbert CA, Daou MC, Moser RP, Ross AH. Gamma-secretase inhibitors enhance temozolomide treatment of human gliomas by inhibiting neurosphere repopulation and xenograft recurrence. Cancer Res 2010; 70:6870 - 9; http://dx.doi.org/10.1158/0008-5472.CAN-10-1378; PMID: 20736377
- Fuchs E, Tumbar T, Guasch G. Socializing with the neighbors: stem cells and their niche. Cell 2004; 116:769 - 78; http://dx.doi.org/10.1016/S0092-8674(04)00255-7; PMID: 15035980
- Alam S, Sen A, Behie LA, Kallos MS. Cell cycle kinetics of expanding populations of neural stem and progenitor cells in vitro. Biotechnol Bioeng 2004; 88:332 - 47; http://dx.doi.org/10.1002/bit.20246; PMID: 15486940
- Hitoshi S, Alexson T, Tropepe V, Donoviel D, Elia AJ, Nye JS, et al. Notch pathway molecules are essential for the maintenance, but not the generation, of mammalian neural stem cells. Genes Dev 2002; 16:846 - 58; http://dx.doi.org/10.1101/gad.975202; PMID: 11937492
- Heisig J, Weber D, Englberger E, Weise C, Wei C, Gessler M. Transcriptional regulation by Hey and Hes bHLH factors. At: The Notch Meeting V, Athens, Greece 2011.
- Katoh M, Katoh M. Integrative genomic analyses on HES/HEY family: Notch-independent HES1, HES3 transcription in undifferentiated ES cells, and Notch-dependent HES1, HES5, HEY1, HEY2, HEYL transcription in fetal tissues, adult tissues, or cancer. Int J Oncol 2007; 31:461 - 6; PMID: 17611704
- Ge W, Martinowich K, Wu X, He F, Miyamoto A, Fan G, et al. Notch signaling promotes astrogliogenesis via direct CSL-mediated glial gene activation. J Neurosci Res 2002; 69:848 - 60; http://dx.doi.org/10.1002/jnr.10364; PMID: 12205678
- Imura T, Kornblum HI, Sofroniew MV. The predominant neural stem cell isolated from postnatal and adult forebrain but not early embryonic forebrain expresses GFAP. J Neurosci 2003; 23:2824 - 32; PMID: 12684469
- Doetsch F, Caillé I, Lim DA, García-Verdugo JM, Alvarez-Buylla A. Subventricular zone astrocytes are neural stem cells in the adult mammalian brain. Cell 1999; 97:703 - 16; http://dx.doi.org/10.1016/S0092-8674(00)80783-7; PMID: 10380923
- Mellodew K, Suhr R, Uwanogho DA, Reuter I, Lendahl U, Hodges H, et al. Nestin expression is lost in a neural stem cell line through a mechanism involving the proteasome and Notch signalling. Brain Res Dev Brain Res 2004; 151:13 - 23; http://dx.doi.org/10.1016/j.devbrainres.2004.03.018; PMID: 15246688
- Shih AH, Holland EC. Notch signaling enhances nestin expression in gliomas. Neoplasia 2006; 8:1072 - 82; http://dx.doi.org/10.1593/neo.06526; PMID: 17217625
- Cohen B, Shimizu M, Izrailit J, Ng NF, Buchman Y, Pan JG, et al. Cyclin D1 is a direct target of JAG1-mediated Notch signaling in breast cancer. Breast Cancer Res Treat 2010; 123:113 - 24; http://dx.doi.org/10.1007/s10549-009-0621-9; PMID: 19915977
- Guo D, Ye J, Dai J, Li L, Chen F, Ma D, et al. Notch-1 regulates Akt signaling pathway and the expression of cell cycle regulatory proteins cyclin D1, CDK2 and p21 in T-ALL cell lines. Leuk Res 2009; 33:678 - 85; http://dx.doi.org/10.1016/j.leukres.2008.10.026; PMID: 19091404
- Fischer A, Gessler M. Delta-Notch--and then? Protein interactions and proposed modes of repression by Hes and Hey bHLH factors. Nucleic Acids Res 2007; 35:4583 - 96; http://dx.doi.org/10.1093/nar/gkm477; PMID: 17586813
- Borghese L, Dolezalova D, Opitz T, Haupt S, Leinhaas A, Steinfarz B, et al. Inhibition of notch signaling in human embryonic stem cell-derived neural stem cells delays G1/S phase transition and accelerates neuronal differentiation in vitro and in vivo. Stem Cells 2010; 28:955 - 64; http://dx.doi.org/10.1002/stem.408; PMID: 20235098
- Yoon JH, Kim SA, Kwon SM, Park JH, Park HS, Kim YC, et al. 5′-Nitro-indirubinoxime induces G1 cell cycle arrest and apoptosis in salivary gland adenocarcinoma cells through the inhibition of Notch-1 signaling. Biochim Biophys Acta 2010; 1800:352 - 8; http://dx.doi.org/10.1016/j.bbagen.2009.11.007; PMID: 19914349
- Freedman VH, Shin SI. Cellular tumorigenicity in nude mice: correlation with cell growth in semi-solid medium. Cell 1974; 3:355 - 9; http://dx.doi.org/10.1016/0092-8674(74)90050-6; PMID: 4442124
- Suzuki F, Suzuki K, Nikaido O. An improved soft agar method for determining neoplastic transformation in vitro. J Tissue Cult Methods 1983; 8:109 - 13; http://dx.doi.org/10.1007/BF01842703
- Singh SK, Clarke ID, Hide T, Dirks PB. Cancer stem cells in nervous system tumors. Oncogene 2004; 23:7267 - 73; http://dx.doi.org/10.1038/sj.onc.1207946; PMID: 15378086
- Dirks PB. Brain tumor stem cells: bringing order to the chaos of brain cancer. J Clin Oncol 2008; 26:2916 - 24; http://dx.doi.org/10.1200/JCO.2008.17.6792; PMID: 18539973
- Pallini R, Ricci-Vitiani L, Banna GL, Signore M, Lombardi D, Todaro M, et al. Cancer stem cell analysis and clinical outcome in patients with glioblastoma multiforme. Clin Cancer Res 2008; 14:8205 - 12; http://dx.doi.org/10.1158/1078-0432.CCR-08-0644; PMID: 19088037
- Laks DR, Masterman-Smith M, Visnyei K, Angenieux B, Orozco NM, Foran I, et al. Neurosphere formation is an independent predictor of clinical outcome in malignant glioma. Stem Cells 2009; 27:980 - 7; http://dx.doi.org/10.1002/stem.15; PMID: 19353526
- Soeda A, Inagaki A, Oka N, Ikegame Y, Aoki H, Yoshimura SI, et al. Epidermal growth factor plays a crucial role in mitogenic regulation of human brain tumor stem cells. J Biol Chem 2008; 283:10958 - 66; http://dx.doi.org/10.1074/jbc.M704205200; PMID: 18292095
- Clement V, Sanchez P, de Tribolet N, Radovanovic I, Ruiz i Altaba A. HEDGEHOG-GLI1 signaling regulates human glioma growth, cancer stem cell self-renewal, and tumorigenicity. Curr Biol 2007; 17:165 - 72; http://dx.doi.org/10.1016/j.cub.2006.11.033; PMID: 17196391
- Sutter R, Yadirgi G, Marino S. Neural stem cells, tumour stem cells and brain tumours: dangerous relationships?. Biochim Biophys Acta 2007; 1776:125 - 37; PMID: 17868999
- Sakamoto K, Ohara O, Takagi M, Takeda S, Katsube K. Intracellular cell-autonomous association of Notch and its ligands: a novel mechanism of Notch signal modification. Dev Biol 2002; 241:313 - 26; http://dx.doi.org/10.1006/dbio.2001.0517; PMID: 11784114
- Zhu TS, Costello MA, Talsma CE, Flack CG, Crowley JG, Hamm LL, et al. Endothelial cells create a stem cell niche in glioblastoma by providing NOTCH ligands that nurture self-renewal of cancer stem-like cells. Cancer Res 2011; 71:6061 - 72; http://dx.doi.org/10.1158/0008-5472.CAN-10-4269; PMID: 21788346
- Guentchev M, McKay RD. Notch controls proliferation and differentiation of stem cells in a dose-dependent manner. Eur J Neurosci 2006; 23:2289 - 96; http://dx.doi.org/10.1111/j.1460-9568.2006.04766.x; PMID: 16706837
- Brennan C, Momota H, Hambardzumyan D, Ozawa T, Tandon A, Pedraza A, et al. Glioblastoma subclasses can be defined by activity among signal transduction pathways and associated genomic alterations. PLoS One 2009; 4:e7752; http://dx.doi.org/10.1371/journal.pone.0007752; PMID: 19915670