Abstract
Although BRAFV600E is well known to play an important role in the tumorigenesis of melanoma, its molecular mechanism, particularly the epigenetic aspect, has been incompletely understood. Here, we investigated the role of BRAFV600E signaling in altering gene methylation in the genome of melanoma cells using a methylated CpG island amplification/CpG island microarray system and searched for genes coupled to the BRAFV600Esignaling through methylation aberrations. The results indicated that a wide range of genes with broad functions were linked to BRAFV600E signaling through their hyper- or hypomethylation. Expression of 59 genes hypermethylated upon BRAF knockdown was selectively tested and found to be largely correspondingly underexpressed, suggesting that these genes were naturally hypomethylated, and overexpressed with BRAFV600E in melanoma. This BRAFV600E-promoted hypomethylation was confirmed on genes selectively examined in primary melanoma tumors. Some of these genes were functionally tested and demonstrated to play a role in melanoma cell proliferation and invasion. As a mechanism of aberrant gene methylation driven by BRAFV600E, expression of the DNA methyltransferase 1 and histone methyltransferase EZH2 was profoundly affected by BRAFV600E. We have thus uncovered a previously unrecognized prominent epigenetic mechanism in the tumorigenesis of melanoma driven by BRAFV600E. Many of the functionally important genes controlled by the BRAFV600E signaling through aberrant methylation may prove to be novel therapeutic targets for melanoma.
Introduction
Cutaneous melanoma is the most lethal skin cancer, with a rapidly rising incidence in recent years.Citation1,Citation2 Patients with this cancer have a high mortality rate, particularly when metastasis occurs. A prominent oncogenic genetic event in melanoma is the BRAFT1799A mutation, which occurs in the majority of cases and results in the constitutively activated BRAFV600E kinase.Citation3,Citation4 Through driving the Ras/Raf/MEK/ERK signaling pathway (MAP kinase pathway), BRAFV600E signaling plays a fundamental role in the tumorigenesis of melanoma. It is also associated with poorer patient survival.Citation5 The remarkable responses of melanoma patients to a BRAFV600E inhibitor in recent clinical trials have reinforced the enthusiasm in this mutation and further supports its important pathologic role in melanoma.Citation6,Citation7
Many molecular aspects of the mechanism involved in the BRAFV600E-driven tumorigenesis of melanoma have not been well explored. In particular, little is known about its epigenetic aspects, such as the involvement of aberrations in gene methylation. Aberrant promoter methylation can profoundly affect gene expression; hyper- and hypomethylation of a gene is usually associated with its silencing and overexpression, respectively. Aberrant gene methylation thus plays a fundamental role in human tumorigenesis.Citation8,Citation9 Many of aberrantly methylated genes have functions involved in cell cycle control, apoptosis, cell signaling and cell invasion and metastasis, as seen for some cases in melanoma.Citation10 Given the paramount importance of aberrations in gene methylation in human cancer, we hypothesized that this could be a major molecular mechanism in the BRAFV600E-promoted tumorigenesis of melanoma. Using a methylated CpG island amplification (MCA)/CpG island microarray approach,Citation11 in the present study, we performed a genome-wide analysis of the relationship of the BRAFV600E signaling with aberrant DNA methylation to establish an epigenetic mechanism and to identify genes as methylation targets of the BRAFV600E signaling that may play an important role in the tumorigenesis of melanoma.
Results
Global identification of hyper-/hypomethylated genes mediated by BRAFV600E signaling in melanoma cells.
To explore the relationship between BRAFV600E signaling and aberrant DNA methylation on a genome scale, we used the shRNA approach to stably and nearly completely knockdown the expression of BRAF, resulting in virtually complete inhibition of the phosphorylation of ERK (p-ERK) in BRAFV600E-positive melanoma cells UACC62, A375 and M14 (). We subsequently generated PCR amplicons of the genomic DNA isolated from UACC62 cells with and without BRAF knockdown and performed MCA/CpG island microarray as illustrated in . Hyper- and hypomethylated DNA sites upon BRAF knockdown were visualized as red and green spots in the microarray, respectively. Normalized log2 ratio values of ≥ 0.6 and ≤ −1 were used as the cutoff for hypermethylation and hypomethylation, respectively. The correlation between two different MCA/CpG island microarray experiments was highly significant (p < 0.0001), with Pearson r-values of 0.91, 0.90 and 0.91, respectively, demonstrating the high reproducibility and reliability of the test (). Surprisingly, widespread alterations in DNA methylation in the genome, many sites of which represent specific genes, were revealed (). Using the matched CpG microarray database (University Health Network Human CpG Microarray Database, Toronto, Canada; http://data.microarrays.ca/cpg), we identified many genes that became hypermethylated upon BRAFV600E knockdown (genes in red color in ); that is, driven by the BRAFV600E signaling, these genes were naturally hypomethylated in melanoma cells. Numerous genes were also found to be hypomethylated upon BRAFV600E knockdown (genes in green color in ); that is, driven by the BRAFV600E signaling, these genes were naturally hypermethylated in melanoma cells. Ten such representative genes are presented in (lower box).
Unlike gene hypermethylation, gene hypomethylation has been generally poorly characterized in human cancers. The broad gene hypomethylation caused by BRAFV600E signaling in melanoma cells is, therefore, particularly interesting. We thus randomly selected 59 genes in this group that contained two or more SmaI/XmaI sites in their promoters (, upper box) for gene expression analysis and some of them for further functional studies. These genes have a broad range of important molecular and cellular functions, as summarized in the Table S1 (adapted from Table S4 of our recent studyCitation12).
Expression analysis and methylation validation of the genes that became hypermethylated upon BRAF knockdown in melanoma cells and primary melanoma tumors.
To be consistent with an important role of the DNA methylation in the regulation of genes, expression of most of the 59 genes selected for analysis that became hypermethylated upon BRAF knockdown was correspondingly decreased (represented by green color) in the UACC62 cell (). When comparing UACC62 with A375 cells, many of these genes were found to be underexpressed in both cells upon BRAF knockdown (). We randomly selected eight of these genes for quantitative methylation-specific PCR (QMSP) analysis, including ZBTB10, PPP5C, MTAP, NR4A2, FGD1, KLHL14, HMGB2 and HLX1. As shown in , knockdown of BRAFV600E could significantly increase the methylation levels of most of these genes in the two melanoma cells, confirming the MCA/CpG microarray results () and being consistent with their underexpression (). This again demonstrated the reliability of the MCA/CpG microarray approach to examine gene methylation. Comparison of UACC62 with M14 cells similarly showed many underexpressed genes shared in the two cells after BRAF knockdown (). Four of these genes were selected for promoter methylation analysis by QMSP and displayed hypermethylation in both cells (), consistent with the results of the MCA/CpG microarray () and gene expression () analyses. We subsequently used QMSP to examine the promoter methylation of these eight genes in 60 primary melanoma tumors with respect to the BRAFT1799A mutation status. As shown in , promoter methylation in most of these genes was generally lower in tumors harboring the BRAFT1799A mutation than tumors harboring the wild-type BRAF, and in several cases, this difference was statistically significant. This result was consistent with the occurrence of hypermethylation and underexpression of these genes upon BRAF knockdown in melanoma cell lines (). No HLX1 methylation was found in any of these primary melanoma samples (data not shown).
Pathway analysis of the genes hypermethylated upon BRAF knockdown.
To illustrate the importance of the genes coupled to the BRAFV600E signaling through aberrations in gene methylation, we selected the genes naturally hypomethylated by BRAFV600E signaling to map them to major biological pathway networks using the Ingenuity Pathways Analysis (IPA) (www.Ingenuity.com). As shown in Table S2 and Figure S1, many of these genes showed an extensive interaction in these networks; in fact, remarkably, the majority of the 59 genes examined above were found in the top 1–4 networks of IPA. Genes clustered in these networks are involved in a wide variety of biological functions, such as tissue development, cell proliferation, differentiation and death, carbohydrate metabolism and DNA replication, recombination and repair. These data thus provide strong implications on the importance of the genes that are naturally hypomethylated and, hence, overexpressed by the BRAFV600E signaling in the tumorigenesis of melanoma.
Functional studies of selected genes that became hypermethylated upon BRAF knockdown in melanoma cells.
We speculated that many of the genes controlled by the BRAFV600E signaling through altering their methylation might play a direct role in cellular functions of melanoma cells. To directly test this, we randomly chose six genes, including ZBTB10, NR4A2, FGD1, KLHL14, HMGB2 and HLX1, to examine their role in the proliferation and invasion of melanoma cell A375 by knocking down their expression using the shRNA approach (). These six genes became hypermethylated and underexpressed upon BRAF knockdown ( and ); they were naturally hypomethylated and overexpressed by BRAFV600E signaling. As shown in and C, partial knockdown of FGD1 could partially and significantly inhibit the proliferation and invasion of A375 cells. Knockdown of HMGB2 also, and even more profoundly, inhibited the invasion of A375 cells (), although it did not have detectable effect on cell proliferation (). The FGD1 and HMGB2 genes have a variety of important biological functions (Table S1) and are members of the top two IPA networks (Table S2). With these examples, it can be expected that many more genes controlled by the BRAFV600E signaling through alterations in their methylation may similarly play a direct and specific role in the tumorigenesis of melanoma cells.
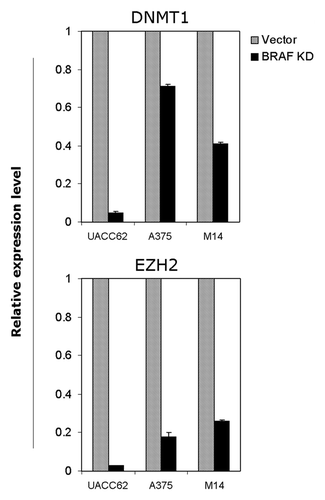
Coupling of the BRAFV600E signaling to the expression of DNA methyltransferase 1 (DNMT1) and the histone methyltransferase EZH2 in melanoma cells.
DNMT1 and EZH2 play a fundamental role in the epigenetic regulation of genes. To explore a possible mechanism involved in the epigenetic control of genes by the BRAFV600E signaling through aberrant gene methylation in melanoma cells, we analyzed the effect of BRAF knockdown on the expression of DNMT1 and EZH2 in melanoma cells UACC62, A375 and M14. As shown in , BRAF knockdown could significantly decrease the expression of DNMT1 in melanoma cells, particularly in UACC cells. Similarly, BRAF knockdown could dramatically inhibit the expression of EZH2 in these melanoma cells.
Discussion
We have used a high-throughput MCA/CpG island microarray system to demonstrate that the BRAFV600E signaling causes wide alterations in gene methylation in the genome of melanoma cells. Although previous studies identified an association of the BRAFT1799A mutation with hypermethylation of several tumor suppressor genes in thyroid cancerCitation13 and colon cancer,Citation14–Citation17 a direct functional relationship of the two events was not established in these studies. The present study also demonstrates that the impact of the BRAFV600E signaling on gene methylation is far more extensive and widespread in the genome and more important functionally than indicated previously on individual genes. The functional significance of these findings is further illustrated by the corresponding expression changes demonstrated on selected genes and the extensive involvement of these genes in the major intracellular pathway networks revealed by the IPA pathway analysis. Many tumor suppressor genes are likely among the genes revealed in the present study that are hypermethylated by the BRAFV600E signaling. Many of the genes hypomethylated by the BRAFV600E signaling are likely oncogenes and their overexpression conceivably has a significant impact on the tumorigenesis of melanoma, as supported by the fact that out of only six such genes examined, two (FGD1 and HMGB2) play a direct role in the proliferation or invasion of melanoma cells. The FGD1 gene is the susceptible gene for the Aarskog-Scott faciogenital dysplasia syndrome,Citation18 and its overexpression was shown to cause cell transformation.Citation19 For the HMGB2 gene, a previous study showed that its overexpression correlated with the progression of skin squamous cell carcinoma.Citation20
A previous gene expression profiling study showed that in the transcriptome of BRAFV600E, many overexpressed genes were potentially oncogenes.Citation21 It is conceivable that gene hypomethylation is involved in the overexpression of at least some of these genes driven by the BRAFV600E signaling. To be consistent with this, a recent study showed that aberrant activation of the MAP kinase pathway caused expression of the neuron-specific microtubule-associated protein MAP2 through its promoter demethylation in melanoma cells.Citation22 Another recent study demonstrated that the BRAFT1799A mutation was associated with overexpression and promoter hypomethylation of the CITED1 gene in thyroid cancer.Citation23 Although these findings are only on two individual genes, they are in line with our findings of the far more extensive genome-wide hypomethylation of genes promoted by the BRAFV600E signaling in melanoma cells. As seen in melanoma in the present study, our recent study showed that BRAFV600E also caused widespread alterations in gene methylation in papillary thyroid cancer, a cancer that also harbors BRAFV600E mutation with a high prevalence.Citation12 Interestingly, most of these target genes of BRAFV600E are identical in melanoma and papillary thyroid cancer, suggesting that these genes are commonly regulated by BRAFV600E through epigenetic mechanisms in human cancers.Citation12
One potential mechanism for BRAFV600E-promoted gene hypermethylation in melanoma cells is the upregulation of DNMT1 and EZH2, as supported by our finding that knockdown of BRAFV600E caused a dramatic decrease in the expression of both genes. Upregulation of DNMT1 by the MAP kinase pathway was shown in several other cancer cells.Citation24–Citation30 DNMT1 plays a fundamental role in gene methylation. EZH2, through methylating lysine 27 of histone H3, is also associated with gene hypermethylation.Citation9,Citation31 A previous study showed that EZH2 had a versatile function in the progression of glioblastoma, and that its expression could be regulated by miR-101.Citation32 The present study demonstrated for the first time a strong link of BRAFV600E signaling with EZH2 expression in melanoma. It would be interesting to see if miR-101 is involved in this process. While upregulation of the DNMT1 and EZH2 genes is likely an important mechanism in the hypermethylation of genes (e.g., tumor suppressor genes) driven by the BRAFV600E signaling in melanoma cells, the mechanism for the hypomethylation of other genes (e.g., oncogenes) driven by the BRAFV600E signaling at the same time remains to be defined.
In summary, this genome-wide methylation study demonstrates that, driven by the BRAFV600E signaling, numerous genes with important biological functions are altered in their methylation and, hence, expression in melanoma cells. Many of them, particularly those hypomethylated and, hence, overexpressed oncogenes, may play a direct role in the tumorigenesis of melanoma. Thus, the present study reveals a previously unrecognized important molecular mechanism in BRAFV600E-promoted tumorigenesis of melanoma. Many of these genes affected by the BRAFV600E signaling through altered promoter methylation may prove to be novel therapeutic targets for melanoma and other cancers. Further characterization of these genes will have a significant impact on understanding the BRAFV600E-driven tumorigenesis and on the development of novel treatments for melanoma and other human cancers that harbor the BRAFV600E mutation.
Materials and Methods
Melanoma cells, melanoma samples and DNA isolation.
The melanoma cell UACC62 was obtained from the National Cancer Institute, and the melanoma cells M14 and A375 were obtained from ATCC. All the three cell lines harbor the BRAFT1799A (BRAFV600E) mutation. Cells were all grown at 37°C and 5% CO2 in RPMI 1640 medium with 10% fetal bovine serum (FBS). With institutional review board approval, 60 paraffin-embedded primary cutaneous melanoma samples were used for this study. Genomic DNA was isolated from cell lines or melanoma samples as previously described in reference Citation33. Briefly, after an overnight treatment at room temperature with xylene to remove paraffin, tissues were digested with 1% SDS and 0.5 mg/ml proteinase K at 48°C for 48 h, with addition of several spiking aliquots of concentrated proteinase K to facilitate digestion. Pellets of cell lines were directly treated under these digestive conditions. DNA was subsequently isolated by standard phenol/chloroform extraction and ethanol precipitation.
Lentivirus-mediated RNA interference.
The lentiviral pSicoR-PGK-puro vectors (Addgene Inc.) encoding seven self-complementary hairpin RNA sequences were used to knockdown seven selected genes, including BRAF, HLX1, KLHL14, HMGB2, NR4A2, FGD1 and ZBTB10. The sequences are presented in Table S3. Lentiviral vector DNAs and packaging vectors were transfected into human embryonic kidey 293 cells (ATCC) to generate lentiviral particles. Cells were then exposed to lentivirus-containing supernatant for 48 h in the presence of Polybrene (8 µg/ml final concentration). After 2 d, transfected cells were serum-starved (0.5% FBS) and harvested 24 h later in RIPA lysis buffer. Western blotting assays were used to detect the protein expression of BRAF, HLX1, KLHL14, HMGB2, NR4A2, FGD1 and ZBTB10. Cell pools with stable transfection were selected using puromycin.
Western blotting assay.
Cells were lysed in RIPA buffer with standard protease inhibitors on ice. Protein lysates were separated on 10% SDS-polyacrylamide gel (SDS-PAGE) and transferred onto PVDF membranes (Amersham Pharmacia Biotech), followed by incubation with specific primary antibodies. Anti-BRAF (sc-166), anti-phospho-ERK (sc-7383), anti-ZBTB10 (sc 87402) and anti-actin (sc-1616-R) were purchased from Santa Cruz. Anti-HLX1 (AV100839), anti-KLHL14 (AV34677), anti-HMGB2 (AV31939), anti-NR4A2 (AV38753) and anti-FGD1 (AV31673) were purchased from Sigma. Antigen-antibody complexes were visualized using HRP-conjugated anti-mouse (sc-2005) or anti-rabbit (sc-2004) IgG antibodies and the ECL western blotting kit (GE Healthcare).
Methylated CpG island amplification (MCA).
MCA assay was performed as described previously in reference Citation34. Briefly, 5 µg each of genomic DNA from cells stably transfected with BRAF shRNA (termed “test” hereafter) and vector (termed “control” hereafter) was digested with 100 units of methylation-sensitive restriction endonuclease SmaI (New England Biolabs) for 16 h at 20°C in a total volume of 100 µl, followed by digestion with 20 units of methylation-insensitive restriction endonuclease XmaI for 6 h at 37°C, which leaves sticky ends (C/CCGGG). DNA fragments were then precipitated with ethanol and their sticky ends ligated with 0.5 nM unphosphorylated linkers RXMA-24/-12, as described in reference Citation34. The oligonucleotide sequences were as follows: (RXMA-24) 5′-AGC ACT CTC CAG CCT CTC ACC GAC-3′ and (RXMA-12) 5′-CCG GGT CGG TGA-3′. PCR reactions were performed using the digests as templates and subjected to 20 cycles of amplification as described previously in reference Citation11. Ten microliters of PCR product was resolved in 1.5% agarose gel and visualized under UV after ethidium bromide staining. Successful MCA reactions resulted in an amplicon smear ranging from 300 bp to 3 kb, with the most common amplicons around 1 kb. The PCR products were purified and reserved for fluorescence labeling.
CpG island microarray.
Incorporation of amino-allyl dUTP (aa-dUTP; Sigma) into 600 ng each of “test” and “control” amplicons was performed using the BioPrime DNA labeling system (Life Technologies, Inc.). Alexa 647 (red color) and Alexa 555 (green color) fluorescent dyes were coupled to aa-dUTP-labeled “test” and “control” amplicons, respectively. Equimolar amounts of the labeled amplicons were co-hybridized to the 12K Human CpG-island Array chip (Microarray Center, University Health Network), which contained 12,192 CpG-island clones that were originally created at the Sanger Institute.Citation35 Hybridized slides were scanned, and the acquired images were analyzed with the corresponding software. Two-step global lowess normalization was done using the background-subtracted median intensity of each spot, and the resultant log2 ratios were averaged from triplicate experiments. CpG island tags (or probes) hybridized predominately with the test amplicon, but not with the control amplicon, appear as red spots. Per convention, we set an arbitrary cutoff of 1.5 for the Alexa 647/555 ratio as previously defined for hypermethylation;Citation36,Citation37 loci with ratios ≥ 1.5 (equal to a log2 ratio ≥ 0.6) were identified as hypermethylated in the “test” samples. In contrast, CpG island tags hybridized predominately with the “control” amplicon, but not with the test amplicon, appear as green spots. We set a cutoff of 0.5 for the Alexa 647/555 ratio for hypomethylation; loci with ratios ≤ 0.5 (equal to a log2 ratio ≤ −1) were identified as hypomethylated in the “test” samples.Citation36,Citation37 Triplicate experiments were performed for each cell line, and they were averaged for data analyses.
Pathway and functional analyses of the genes that became hypermethylated upon BRAF knockdown by ingenuity pathway analysis (IPA).
Genes were uploaded to the IPA system (Ingenuity Systems Inc., www.Ingenuity.com), and pathway and functional analysis were performed. IPA is a commercial web-based interface that uses a variety of computational algorithms to identify and establish molecular and cellular pathway networks. The analysis uses a database of gene interactions culled from literature and updated quarterly in the year.
RNA extraction and real-time quantitative RT-PCR analysis.
RNA expression analysis was performed by real-time quantitative PCR using the ABI Prism 7900HT Sequence Detection System Instrument (Applied Biosystems). Two µg of total RNA underwent reverse transcription using SuperScript First-Strand Synthesis Kit according to the instructions of the manufacturer (Invitrogen). PCR reactions were performed using SYBR GreenER qPCR SuperMix according to the instructions of the manufacturer (Applied Biosystems). PCR primers were designed using Primer Express (Applied Biosystems) to span a large intron whose location and sequences are presented in Table S4. CT values were calculated by the ABI PRISM software, and the relative amount of RNA was presented for each sample according to the 2-ΔΔCt method.Citation38 The specificity of real-time quantitative PCR of samples was confirmed by running the PCR products on a 1.5% agarose gel to confirm single specific bands at the expected sizes (data not shown). Each sample was run in triplicate.
Quantitative methylation-specific PCR (QMSP).
Genomic DNA was subjected to bisulfite treatment as described previously in reference Citation39. A methylation-specific and SYBR-green-based quantitative PCR (QMSP) Citation40 was performed to validate the methylation status of selected eight genes on an ABI Prism 7900HT Sequence Detection System (Applied Biosystems) using iTaq SYBR Green Supermix (Bio-Rad) according to the instructions of the manufacturer, including ZBTB10, PPP5C, MTAP, NR4A2, FGD1, KLHL14, HMGB2 and HLX1. The methylation-specific primers were designed using Methyl Primer Express Software v1.0 (Applied Biosystems) and were presented in Table S5. Normal leukocyte DNA was methylated in vitro with Sss I methylase (New England Biolabs) to generate completely methylated DNA as a positive control. Each plate contained triplicate samples, multiple water blanks and serial dilutions of positive methylated control to construct the standard curves for each gene. The relative methylation level of each DNA sample was calculated as described previously in reference Citation41.
Cell proliferation and invasion assays.
For cell proliferation assay, cells (800/well) were seeded onto 96-well plates and cultured with 2.5% FBS. MTT assay was performed daily over a 5-d time course to evaluate cell proliferation. Cell culture was added with 10 µl of 5 mg/ml MTT agent (Sigma) and incubated for 4 h, followed by the addition of 100 µl of 10% SDS solution and a further incubation overnight. The plates were read on a microplate reader using the test wavelength of 570 nm and the reference wavelength of 670 nm. Three triplicates were done to determine each data point.
Cell invasion assay was performed using Matrigel-coated Transwell cell culture chambers with 8-µm pore (BD Biosciences). Briefly, 2.5 × 10⁴ cells were suspended in serum-free medium and seeded in the upper chamber of the Transwell insert. RPMI 1640 medium containing 10% fetal bovine serum was added to the lower chamber. After a 22 h incubation at 37°C with 5% CO2, non-invasive cells in the upper chamber were removed, and invasive cells that migrated to the underside of the membrane were fixed in 100% methanol and stained with 0.5% crystal violet in 2% ethanol. Photographs were taken, and the number of invasive cells was counted microscopically.
Statistical analysis.
The data presented are representatives of at least two similar experiments performed independently. DNA methylation and gene expression data were analyzed using program ScanAlyze as described by Michael Eisen (http://rana.lbl.gov/EisenSoftware.htm). Data were compared using the t-test. Statistical significance was defined as p < 0.05.
Disclosure of Potential Conflicts of Interest
No potential conflicts of interest were disclosed.
Authors' Contributions
M.X. conceived, guided and supervised the research project. P.H., D.L. and M.X. designed the experiments. P.H. and D.L. conducted the experiments. J.D. and M.X. provided tumor samples and research materials. P.H., D.L. and M.X. analyzed the data. P.H. and M.X. wrote the manuscript. All authors contributed to and approved the final version of the manuscirpt.
Figures and Tables
Figure 1 Procedures of the global identification of BRAFV600E signaling-mediated DNA methylation targets in melanoma cells using MCA/CpG island microarray. (A) Stable shRNA knockdown of BRAF and suppression of the signaling of the MAP kinase pathway in BRAFV600E-positive melanoma cells UACC62, A375 and M14. Cells were infected with lentivirus expressing BRAF shRNA, and stable populations were selected with 2 µg/ml puromycin. Transfection with the empty vector was used as a control. After a 2-week selection, cells were lysed and immunoblotted with BRAF and phosphorylated ERK (p-ERK) antibodies. The antibody against β-actin was used for quality control of western blotting. (B) Schematic diagram of the MCA/CpG island microarray procedure. Enrichment of methylated DNA and reduction of genome complexity were achieved by serial digestion with SmaI (methylation sensitive) and XmaI (methylation insensitive) restriction enzymes. The resulting amplicons, representative of the methylated fraction from cells stably transfected with BRAF shRNA and vector, were labeled with appropriate dyes and co-hybridized in a microarray platform as detailed in the Materials and Methods.
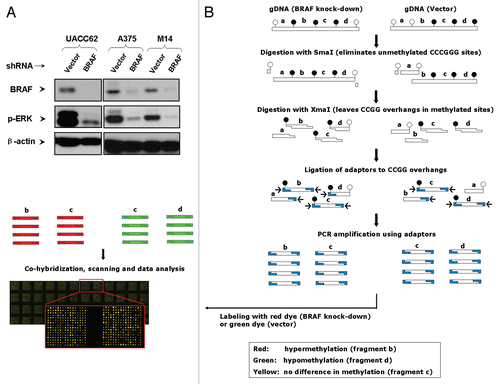
Figure 2 Detection of hyper- and hypomethylation DNA sites by the MCA/CpG island microarray approach and identification of specific genes with altered methylation status. (A) Reproducibility of the MCA/CpG island microarray analysis reflected by the close overall correlation among three independent experiments. (B) Results of examination of global DNA methylation in UACC62 cells by the MCA/CpG island microarray analysis after BRAF knockdown. Normalized log2 ratios of the methylation intensities of BRAF shRNA/vector of ≥ 0.6 and ≤ −1 were used as the cutoff values for hypermethylation and hypomethylation, respectively. Data are presented as mean values of three experiments, with red color representing high log2 ratios (hypermethylation); black color, no change and green color, low log2 ratios (hypomethylation). The matched CpG microarray database (University Health Network Human CpG Microarray Database, http://data.microarrays.ca/cpg) was used to identify specific genes whose promoter methylation was altered after BRAFV600E knockdown in UACC62 cells. The upper box frame in (B) illustrates 59 representative hypermethylated genes with high methylation intensity ratios (red) and the lower box frame in (B) illustrates 10 representative hypomethylated genes with low methylation intensity ratios (green). These genes contain two or more SmaI/XmaI sites in their promoters to maximize the chance of their promoter methylation identified by the MCA/CpG island microarray approach. The detailed experimental and technical descriptions are presented in Materials and Methods.
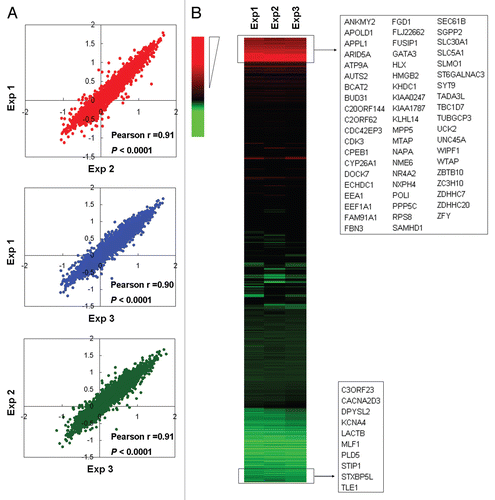
Figure 3 Analysis of the expression of genes hypermethylated upon BRAFV600E knockdown and quantitative methylation-specific PCR (QMSP) validation of the MCA/CpG island microarray results on selected genes in melanoma cells. (A) Quantitative RT-PCR analysis of the expression of the 59 genes hypermethylated upon BRAFV600E knockdown from in UACC62 cells in comparison with A375 cells. The genes presented in green are underexpressed. (B) QMSP validation of the hypermethylation status of genes revealed by the MCA/CpG island microarray analysis by similarly showing increased methylation upon BRAFV600E knockdown. Selected eight genes were tested that showed decreased expression in both UACC62 and A375 cells, which are indicted with a blue asterisk (*) in (A). (C) Quantitative RT-PCR analysis of the expression of the 59 genes hypermethylated upon BRAFV600E knockdown from in UACC62 cells in comparison with M14 cells. Shown are many underexpressed genes (green color), many of which are seen in both cells. (D) QMSP validation of the hypermethylation status of selected four genes revealed by the MCA/CpG island microarray analysis as in (B). These genes were underexpressed in both UACC62 and M14 cells as indicated with a blue asterisk (*) in (C). Details are described in the Materials and Methods. Significance of statistical analyses in (B and D): *p < 0.05; **p < 0.01.
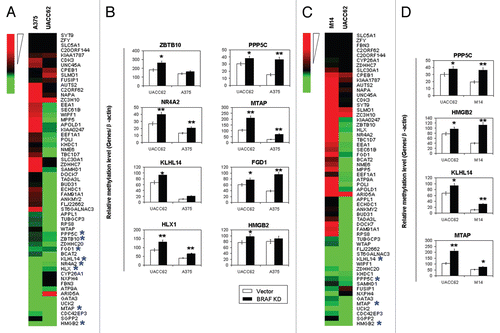
Figure 4 Analysis of the methylation status of selected eight genes in primary melanoma tumors that became hypermethylated as revealed by MCA/CpG island microarray analysis upon BRAF knockdown in melanoma cells. Methylation of genomic DNA isolated from 60 primary melanoma tumors with known BRAFT1799A mutation status was analyzed using QMSP. Details are described in the Materials and Methods. Results are presented for seven genes indicated at the top of each graph. The result for the HLX1 gene is not shown, as no methylation of this gene was found in any of these tumors. WT, wild-type BRAF; V600E, BRAFT1799A (V600E) mutation; the horizontal lines represents 95% confidence interval; *p < 0.05.
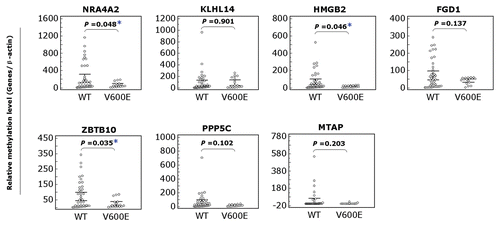
Figure 5 Effects of silencing genes that were hypomethylated and overexpressed by the BRAFV600E signaling on the proliferation and invasion of melanoma cells. (A) The expression of six selected genes, as indicated, was knocked down in melanoma A375 cells using vector-based RNA interference. Cells were infected with lentiviruses expressing shRNA targeting FGD1, HLX1, HMGB2, KLHL14, NR4A2 and ZBTB10. Stable cell pools obtained after selection with puromycin were lysed and immunoblotted with corresponding antibodies for the six proteins. Lentiviruses packaged with the empty vector were used as control. V, vector control; S, specific shRNA expression. (B) Cell proliferation assay of A375 cell pools with stable knockdown of the indicated genes. The proliferation rate was examined using MTT assay, and the OD values were measured daily over a 5-d time course. (C) Cell invasion assay of A375 cell pools with stable knockdown of the indicated genes. Cells were plated and cultured in Matrigel-coated transwell for 22 h, followed by examination and quantification of the invasive cells, as described in the Materials and Methods. The upper part shows representative results of invasive A375 cells with knockdown of each indicated gene. The bar graph in the lower part, corresponding to the upper part, shows the numbers of invasive cells.
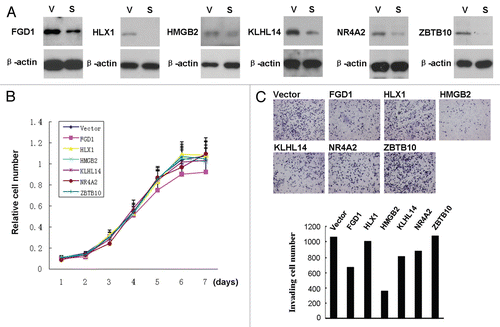
Figure 6 Suppression of the expression of DNMT1 and EZH2 by BRAFV600E knockdown in melanoma cells. Quantitative RT-PCR was performed to analyze the expression of DNMT1 and EZH2 genes in the three indicated melanoma cells stably transfected with the control empty vector (Vector) or BRAF-specific shRNA (BRAF KD). Relative gene expression in the BRAF-knockdown group against the control vector group is presented. The RT-PCR primer sequences for the two genes are presented in Table S4. The experimental details are described in the Materials and Methods.
Additional material
Download Zip (923.5 KB)Acknowledgments
This work was supported by NIH RO-1 grant CA113507 (to M. Xing).
References
- Miller AJ, Mihm MC Jr. Melanoma. N Engl J Med 2006; 355:51 - 65; PMID: 16822996; http://dx.doi.org/10.1056/NEJMra052166
- Altekruse SF, Kosary CL, Krapcho M, Neyman N, Aminou R, Waldron W, et al. SEER Cancer Statistics Review, 1975–2007 Bethesda, MD National Cancer Institute http://seer.cancer.gov/csr/1975_2007/, based on November 2009 SEER data submission, posted to the SEER web site 2010
- Davies H, Bignell GR, Cox C, Stephens P, Edkins S, Clegg S, et al. Mutations of the BRAF gene in human cancer. Nature 2002; 417:949 - 954; PMID: 12068308; http://dx.doi.org/10.1038/nature00766
- Corcoran RB, Settleman J, Engelman JA. Potential therapeutic strategies to overcome acquired resistance to BRAF or MEK inhibitors in BRAF mutant cancers. Oncotarget 2011; 2:336 - 346; PMID: 21505228
- Long GV, Menzies AM, Nagrial AM, Haydu LE, Hamilton AL, Mann GJ, et al. Prognostic and clinicopathologic associations of oncogenic BRAF in metastatic melanoma. J Clin Oncol 2011; 29:1239 - 1246; PMID: 21343559; http://dx.doi.org/10.1200/JCO.2010.32.4327
- Flaherty KT, Puzanov I, Kim KB, Ribas A, McArthur GA, Sosman JA, et al. Inhibition of mutated, activated BRAF in metastatic melanoma. N Engl J Med 2010; 363:809 - 819; PMID: 20818844; http://dx.doi.org/10.1056/NEJMoa1002011
- Bollag G, Hirth P, Tsai J, Zhang J, Ibrahim PN, Cho H, et al. Clinical efficacy of a RAF inhibitor needs broad target blockade in BRAF-mutant melanoma. Nature 2010; 467:596 - 599; PMID: 20823850; http://dx.doi.org/10.1038/nature09454
- Jones PA, Baylin SB. The epigenomics of cancer. Cell 2007; 128:683 - 692; PMID: 17320506; http://dx.doi.org/10.1016/j.cell.2007.01.029
- McCabe MT, Brandes JC, Vertino PM. Cancer DNA methylation: molecular mechanisms and clinical implications. Clin Cancer Res 2009; 15:3927 - 3937; PMID: 19509173; http://dx.doi.org/10.1158/1078-0432.CCR-08-2784
- Rothhammer T, Bosserhoff AK. Epigenetic events in malignant melanoma. Pigment Cell Res 2007; 20:92 - 111; PMID: 17371436; http://dx.doi.org/10.1111/j.1600-0749.2007.00367.x
- Estécio MR, Yan PS, Ibrahim AE, Tellez CS, Shen L, Huang TH, et al. High-throughput methylation profiling by MCA coupled to CpG island microarray. Genome Res 2007; 17:1529 - 1536; PMID: 17785535; http://dx.doi.org/10.1101/gr.6417007
- Hou P, Liu D, Xing M. Genome-wide alterations in gene methylation by the BRAFV600E mutation in papillary thyroid cancer cells. Endocr Relat Cancer 2011; 18:687 - 697; PMID: 21937738; http://dx.doi.org/10.1530/ERC-11-0212
- Xing M. Gene methylation in thyroid tumorigenesis. Endocrinology 2007; 148:948 - 953; PMID: 16946009; http://dx.doi.org/10.1210/en.2006-0927
- Kambara T, Simms LA, Whitehall VL, Spring KJ, Wynter CV, Walsh MD, et al. BRAF mutation is associated with DNA methylation in serrated polyps and cancers of the colorectum. Gut 2004; 53:1137 - 1144; PMID: 15247181; http://dx.doi.org/10.1136/gut.2003.037671
- Weisenberger DJ, Siegmund KD, Campan M, Young J, Long TI, Faasse MA, et al. CpG island methylator phenotype underlies sporadic microsatellite instability and is tightly associated with BRAF mutation in colorectal cancer. Nat Genet 2006; 38:787 - 793; PMID: 16804544; http://dx.doi.org/10.1038/ng1834
- Nagasaka T, Koi M, Kloor M, Gebert J, Vilkin A, Nishida N, et al. Mutations in both KRAS and BRAF may contribute to the methylator phenotype in colon cancer. Gastroenterology 2008; 134:1950 - 1960; PMID: 18435933; http://dx.doi.org/10.1053/j.gastro.2008.02.094
- Ang PW, Li WQ, Soong R, Iacopetta B. BRAF mutation is associated with the CpG island methylator phenotype in colorectal cancer from young patients. Cancer Lett 2009; 273:221 - 224; PMID: 18778891; http://dx.doi.org/10.1016/j.canlet.2008.08.001
- Shalev SA, Chervinski E, Weiner E, Mazor G, Friez MJ, Schwartz CE. Clinical variation of Aarskog syndrome in a large family with 2189delA in the FGD1 gene. Am J Med Genet A 2006; 140:162 - 165; PMID: 16353258
- Whitehead IP, Abe K, Gorski JL, Der CJ. CDC42 and FGD1 cause distinct signaling and transforming activities. Mol Cell Biol 1998; 18:4689 - 4697; PMID: 9671479
- Yamada S, Maruyama I. HMGB1, a novel inflammatory cytokine. Clin Chim Acta 2007; 375:36 - 42; PMID: 16979611; http://dx.doi.org/10.1016/j.cca.2006.07.019
- Hoeflich KP, Eby MT, Forrest WF, Gray DC, Tien JY, Stern HM, et al. Regulation of ERK3/MAPK6 expression by BRAF. Int J Oncol 2006; 29:839 - 849; PMID: 16964379
- Maddodi N, Bhat KM, Devi S, Zhang SC, Setaluri V. Oncogenic BRAFV600E induces expression of neuronal differentiation marker MAP2 in melanoma cells by promoter demethylation and downregulation of transcription repressor HES1. J Biol Chem 2010; 285:242 - 254; PMID: 19880519; http://dx.doi.org/10.1074/jbc.M109.068668
- Sassa M, Hayashi Y, Watanabe R, Kikumori T, Imai T, Kurebayashi J, et al. Aberrant promoter methylation in overexpression of CITED1 in papillary thyroid cancer. Thyroid 2011; 21:511 - 517; PMID: 21449767; http://dx.doi.org/10.1089/thy.2010.0295
- MacLeod AR, Rouleau J, Szyf M. Regulation of DNA methylation by the Ras signaling pathway. J Biol Chem 1995; 270:11327 - 11337; PMID: 7744770; http://dx.doi.org/10.1074/jbc.270.19.11327
- Deng C, Yang J, Scott J, Hanash S, Richardson BC. Role of the ras-MAPK signaling pathway in the DNA methyltransferase response to DNA hypomethylation. Biol Chem 1998; 379:1113 - 1120; PMID: 9792444; http://dx.doi.org/10.1515/bchm.1998.379.8-9.1113
- Bigey P, Ramchandani S, Theberge J, Araujo FD, Szyf M. Transcriptional regulation of the human DNA Methyltransferase (dnmt1) gene. Gene 2000; 242:407 - 418; PMID: 10721735; http://dx.doi.org/10.1016/S0378-1119(99)00501-6
- Deng C, Kaplan MJ, Yang J, Ray D, Zhang Z, McCune WJ, et al. Decreased Ras-mitogen-activated protein kinase signaling may cause DNA hypomethylation in T lymphocytes from lupus patients. Arthritis Rheum 2001; 44:397 - 407; PMID: 11229472; http://dx.doi.org/10.1002/1529-0131(200102)44:2<397::AID-ANR59>3.0.CO;2-N
- Pruitt K, Ulkü AS, Frantz K, Rojas RJ, Muniz-Medina VM, Rangnekar VM, et al. Ras-mediated loss of the pro-apoptotic response protein Par-4 is mediated by DNA hypermethylation through Raf-independent and Raf-dependent signaling cascades in epithelial cells. J Biol Chem 2005; 280:23363 - 23370; PMID: 15831492; http://dx.doi.org/10.1074/jbc.M503083200
- Gazin C, Wajapeyee N, Gobeil S, Virbasius CM, Green MR. An elaborate pathway required for Ras-mediated epigenetic silencing. Nature 2007; 449:1073 - 1077; PMID: 17960246; http://dx.doi.org/10.1038/nature06251
- Lu R, Wang X, Chen ZF, Sun DF, Tian XQ, Fang JY. Inhibition of the extracellular signal-regulated kinase/mitogen-activated protein kinase pathway decreases DNA methylation in colon cancer cells. J Biol Chem 2007; 282:12249 - 12259; PMID: 17307743; http://dx.doi.org/10.1074/jbc.M608525200
- Simon JA, Lange CA. Roles of the EZH2 histone methyltransferase in cancer epigenetics. Mutat Res 2008; 647:21 - 29; PMID: 18723033; http://dx.doi.org/10.1016/j.mrfmmm.2008.07.010
- Smits M, Nilsson J, Mir SE, van der Stoop PM, Hulleman E, Niers JM, et al. miR-101 is downregulated in glioblastoma resulting in EZH2-induced proliferation, migration and angiogenesis. Oncotarget 2010; 1:710 - 720; PMID: 21321380
- Hou P, Liu D, Shan Y, Hu S, Studeman K, Condouris S, et al. Genetic alterations and their relationship in the phosphatidylinositol-3-kinase/Akt pathway in thyroid cancer. Clin Cancer Res 2007; 13:1161 - 1170; PMID: 17317825; http://dx.doi.org/10.1158/1078-0432.CCR-06-1125
- Toyota M, Ho C, Ahuja N, Jair KW, Li Q, Ohe-Toyota M, et al. Identification of differentially methylated sequences in colorectal cancer by methylated CpG island amplification. Cancer Res 1999; 59:2307 - 2312; PMID: 10344734
- Heisler LE, Torti D, Boutros PC, Watson J, Chan C, Winegarden N, et al. CpG Island microarray probe sequences derived from a physical library are representative of CpG Islands annotated on the human genome. Nucleic Acids Res 2005; 33:2952 - 2961; PMID: 15911630; http://dx.doi.org/10.1093/nar/gki582
- Yan PS, Chen CM, Shi H, Rahmatpanah F, Wei SH, Caldwell CW, et al. Dissecting complex epigenetic alterations in breast cancer using CpG island microarrays. Cancer Res 2001; 61:8375 - 8380; PMID: 11731411
- Shi H, Yan PS, Chen CM, Rahmatpanah F, Lofton-Day C, Caldwell CW, et al. Expressed CpG island sequence tag microarray for dual screening of DNA hypermethylation and gene silencing in cancer cells. Cancer Res 2002; 62:3214 - 3220; PMID: 12036936
- Livak KJ, Schmittgen TD. Analysis of relative gene expression data using real-time quantitative PCR and the 2(-Delta Delta C(T)) method. Methods 2001; 25:402 - 408; PMID: 11846609; http://dx.doi.org/10.1006/meth.2001.1262
- Hou P, Ji M, Xing M. Association of PTEN gene methylation with genetic alterations in the phosphatidylinositol-3-kinase/AKT signaling pathway in thyroid tumors. Cancer 2008; 113:2440 - 2447; PMID: 18831514; http://dx.doi.org/10.1002/cncr.23869
- Hattermann K, Mehdorn HM, Mentlein R, Schultka S, Held-Feindt J. A methylation-specific and SYBR-green-based quantitative polymerase chain reaction technique for O6-methylguanine DNA methyltransferase promoter methylation analysis. Anal Biochem 2008; 377:62 - 71; PMID: 18384736; http://dx.doi.org/10.1016/j.ab.2008.03.014
- Hu S, Liu D, Tufano RP, Carson KA, Rosenbaum E, Cohen Y, et al. Association of aberrant methylation of tumor suppressor genes with tumor aggressiveness and BRAF mutation in papillary thyroid cancer. Int J Cancer 2006; 119:2322 - 2329; PMID: 16858683; http://dx.doi.org/10.1002/ijc.22110