Abstract
Metformin is a well-established diabetes drug that prevents the onset of most types of human cancers in diabetic patients, especially by targeting cancer stem cells. Metformin exerts its protective effects by functioning as a weak “mitochondrial poison,” as it acts as a complex I inhibitor and prevents oxidative mitochondrial metabolism (OXPHOS). Thus, mitochondrial metabolism must play an essential role in promoting tumor growth. To determine the functional role of “mitochondrial health” in breast cancer pathogenesis, here we used mitochondrial uncoupling proteins (UCPs) to genetically induce mitochondrial dysfunction in either human breast cancer cells (MDA-MB-231) or cancer-associated fibroblasts (hTERT-BJ1 cells). Our results directly show that all three UCP family members (UCP-1/2/3) induce autophagy and mitochondrial dysfunction in human breast cancer cells, which results in significant reductions in tumor growth. Conversely, induction of mitochondrial dysfunction in cancer-associated fibroblasts has just the opposite effect. More specifically, overexpression of UCP-1 in stromal fibroblasts increases β-oxidation, ketone body production and the release of ATP-rich vesicles, which “fuels” tumor growth by providing high-energy nutrients in a paracrine fashion to epithelial cancer cells. Hence, the effects of mitochondrial dysfunction are truly compartment-specific. Thus, we conclude that the beneficial anticancer effects of mitochondrial inhibitors (such as metformin) may be attributed to the induction of mitochondrial dysfunction in the epithelial cancer cell compartment. Our studies identify cancer cell mitochondria as a clear target for drug discovery and for novel therapeutic interventions.
Introduction
The role mitochondrial function in cancer pathogenesis remains a controversial topic.Citation1-Citation8 Although it is generally agreed upon that cancer cells undergo metabolic re-programming,Citation1-Citation8 the exact nature of these metabolic changes varies widely, and has not previously been correlated with clinical outcome in cancer patients.
Recently, Skrtic and colleagues have identified an inhibitor of mitochondrial protein translation (tigecycline) as a novel anticancer therapeutic that selectively kills cancer cells, but not normal cells.Citation9 Also, it is widely recognized that many cancer cell lines are “addicted” to glutamine,Citation10 which functions as a high-energy mitochondrial fuel. So, cancer cells are even more dependent on mitochondrial function. Independent clinical studies with cancer patients (from Dana-Farber and MD Anderson Cancer Centers) have now shown that cancer cells with “healthy mitochondria” are in fact more resistant to conventional therapy, whereas patients whose cancer cells contain “unhealthy mitochondria” are more responsive to therapy and show strikingly better clinical outcomes.Citation11 These clinical findings are in accordance with recent studies showing that metformin (a well-known mitochondrial poison) actually prevents the onset of nearly every type of cancer studied in diabetic patients.Citation12-Citation14
So, if cancer cells are critically dependent on efficient mitochondrial function, the question then becomes where do cancer cells get to all the necessary mitochondrial fuels or high-energy nutrients for them to burn, via oxidative phosphorylation (OXPHOS)? The simple answer is the “host,” or cancer patient.Citation15-Citation17 A logical prediction of this hypothesis is that tumors must consist of two distinct metabolic compartments: one that provides the fuel (the host tumor stroma), and the other that burns the energy (the epithelial cancer cells).Citation15-Citation17 This hypothesis has now been directly validated in vivo by functionally assessing mitochondrial activity in frozen sections derived from primary breast cancers and metastatic lymph nodes from breast cancer patients.Citation18,Citation19 Relative to the tumor stroma and normal adjacent epithelial cells, epithelial cancer cells have dramatically amplified their capacity to undergo oxidative mitochondrial activity.Citation18,Citation19
Another important question is: what are the favorite mitochondrial “fuels” or high-energy foods that cancer cells consume? And, how do cancer cells convince host cells to feed them? We and others have now shown that genetic changes in epithelial cancer cells (conveyed by either oncogenic mutations or by loss of tumor suppressor function) induce the production of hydrogen peroxide by cancer cells.Citation20-Citation22 Hydrogen peroxide released from cancer cells then functions to fertilize their surrounding microenvironment via the induction of oxidative stress in tumor stromal cells, especially cancer-associated fibroblasts.Citation20-Citation22
Cancer-associated fibroblasts, which suffer from oxidative stress, then undergo a variety of catabolic processes to produce mitochondrial fuels in order to feed cancer cells.Citation15,Citation16,Citation23-Citation26 These catabolic cellular programs include autophagy, mitophagy and aerobic glycolysis. Cellular catabolism in the tumor microenvironment induces stromal mitochondrial dysfunction, driving the production of high-energy mitochondrial fuels, such as L-lactate, ketone bodies, glutamine and free fatty acids.Citation15,Citation16,Citation23-Citation26 Thus, cancer cells functionally behave as metabolic “parasites,” by removing energy from their local environment, via a simple energy-transfer mechanism.Citation15
Here, to further address the relevance of mitochondrial dysfunction in tumorigenesis, we used a molecular genetic approach. More specifically, we recombinantly overexpressed mitochondrial uncoupling proteins (UCPs) in either stromal fibroblasts or epithelial cancer cells (MDA-MB-231) to genetically induce mitochondrial dysfunction. This allowed us to functionally assess the compartment-specific effects of mitochondrial dysfunction on tumor growth. Our results now show that UCP-induced mitochondrial dysfunction in epithelial cancer cells significantly inhibits tumor growth. And, conversely, UCP-induced mitochondrial dysfunction in stromal fibroblasts dramatically promotes tumor growth, via increased β-oxidation and ketone production, independently of neo-angiogenesis. Our findings provide further genetic proof that we should strongly re-consider mitochondrial metabolism as a key target for designing novel anticancer therapies. These studies also validate the “two-compartment tumor metabolism” model of tumorigenesis.Citation21,Citation27-Citation34
Results
Fibroblasts overexpressing UCP1, but not UCP2 or UCP3, stimulate breast cancer tumor growth, without promoting angiogenesis
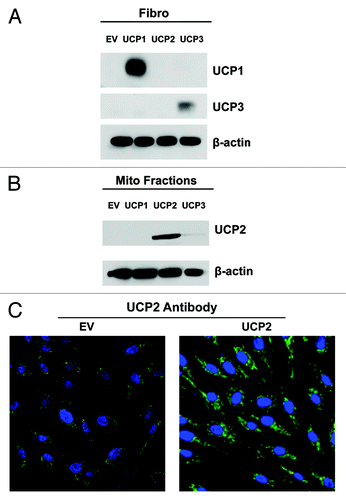
To study the effect(s) of mitochondrial dysfunction in stromal cells, we overexpressed the three isoforms of the mitochondrial uncoupling protein (UCP1, UCP2, UCP3) in human immortalized fibroblasts (hTERT-BJ1 cells) using lentiviral vectors. Empty-vector (EV) control cells were generated in parallel. Immunoblot analysis with isoform-specific UCP antibodies demonstrates the overexpression of UCP1 and UCP3 in total cell lysates. However, UCP2 expression was undetectable (). To detect UCP2 expression, enriched mitochondrial fractions were isolated from empty vector (EV), UCP1, UCP2 or UCP3 fibroblasts. Immunoblotting with UCP2 antibodies demonstrates UCP2 overexpression (). UCP2 overexpression was also confirmed by immunostaining with UCP2 antibodies, showing a mitochondrial pattern ().
Figure 1. Overexpression of UCP1, UCP2 or UCP3 in human fibroblasts. (A) Human immortalized fibroblasts were transduced with a lentiviral vector encoding mitochondrial uncoupling proteins UCP1, UCP2, UCP3 or the empty-vector alone control (EV). After selection, the cells were subjected to immunoblot analysis with specific antibodies. β-actin is shown as equal loading control. Immunoblot analysis validates the expression of UCP1 and UCP3 in total cell lysates. However, UCP2 was undetectable. (B) To detect the expression of UCP2, enriched mitochondrial fractions were isolated from EV, UCP1, UCP2, or UCP3 fibroblasts. Immunoblotting with UCP2 antibodies demonstrates UCP2 overexpression. (C) Immunostaining of empty-vector and UCP2 fibroblasts confirms the expression of UCP2, showing a mitochondrial-like staining pattern. Original magnification, 40X.
We first evaluated the effect of fibroblasts overexpressing UCPs on breast cancer tumor growth using a xenograft model. To this end, MDA-MB-231 breast cancer cells were co-injected with empty-vector, UCP1, UCP2 or UCP3 fibroblasts into the flanks of nude mice. Interestingly, only UCP1-overexpressing fibroblasts enhanced the in vivo growth rates of breast cancer cells (), resulting in a 2.4- to-3.6-fold increase in tumor weight and volume () relative to empty-vector control fibroblasts. Conversely, fibroblasts overexpressing UCP2 or UCP3 did not promote tumor growth.
Figure 2. Fibroblasts overexpressing UCP1, but not UCP2 or UCP3, promote breast cancer tumor growth, without a significant increase in neo-angiogenesis. MDA-MB-231 breast cancer cells were co-injected with empty-vector (EV), UCP1, UCP2 or UCP3 fibroblasts into the flanks of athymic nude mice. Tumor weights and volumes were measured at 22 d post-injection. (A) A time course of tumor growth (volume) is shown. Note that fibroblasts overexpressing UCP1, but not UCP2 or UCP3, significantly promote tumor growth. (B) Tumor growth (weights and volumes) is shown after tumor excision on day 22 post-injection. Fibroblasts overexpressing UCP1 induce an ~2.4-fold increase in tumor weight, and a ~3.6-fold increase in tumor volume, relative to EV fibroblasts. Conversely, fibroblasts overexpressing UCP2 or UCP3 do not promote tumor growth. p-values are as shown. n = 10 tumors per experimental group. (C) Tumor Angiogenesis. Tumor-derived frozen sections were immunostained with anti-CD31 antibodies. Quantification of vascular density (number of CD31-positive vessels per field) indicates that the enhanced tumor growth is not due to increased angiogenesis.
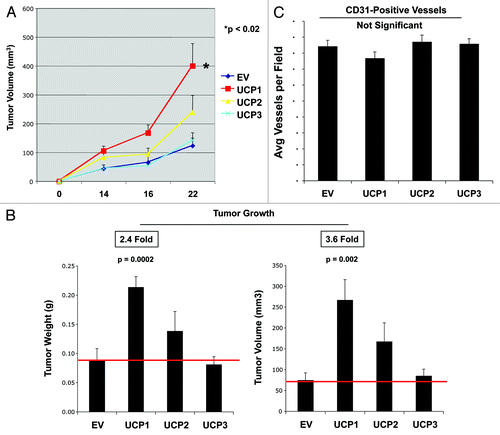
Studies have shown that increased tumorigenic potential can be due to increased angiogenesis. Thus, tumor angiogenesis was measured using immunostaining of tumor xenografts with the endothelial cell marker CD31. shows that quantitation of vascular density (number of CD31-positive vessels per field) indicates that the enhanced tumor growth does not correlate with significant changes in neo-vascularization.
Overexpression of UCP1, UCP2, or UCP3 induces the downregulation of Cav-1 expression, with increased autophagy in human fibroblasts
To understand how fibroblasts overexpressing UCP1 promote tumor growth, we explored the hypothesis that increased tumor growth is due to the onset of a catabolic stromal phenotype, which can support the anabolic growth of cancer cells via stromal-epithelial metabolic coupling. Thus, we first evaluated the expression levels of Cav-1 and MCT4. A loss of stromal Cav-1 and an upregulation of stromal MCT4 are markers of oxidative stress associated with poor clinical outcome in breast cancer.Citation34-Citation42 shows that fibroblasts overexpressing UCP1, UCP2 and UCP3 all induce the downregulation of Cav-1 expression and increase MCT4 levels, as compared with control cells.
Figure 3. Overexpression of UCP1, UCP2, or UCP3 induces the downregulation of Cav-1 expression, with increased autophagy in human fibroblasts. UCP1-, UCP2-, or UCP3-overexpressing fibroblasts and vector-alone control cells (EV) were grown for 48 h in complete media. (A) Immunoblot analysis using antibodies against Cav-1. Note that UCP1 and UCP2 and, to a lesser extent, UCP3 isoforms induce the downregulation of Cav-1 expression, as compared with EV control. (B) Immunoblot analysis with antibodies directed against MCT4 shows that UCP1, UCP2, or UCP3 overexpression increases MCT4 levels. (C) Immunoblot analysis with antibodies directed against a panel of autophagy markers. Note that all three UCP isoforms induce autophagy, as assessed by upregulation of BNIP3 and LC3, relative to control fibroblasts. However, only UCP1 significantly increases the expression levels of the lysosomal/autophagy markers Lamp-1 and cathepsin B. For all, β-actin was used as equal loading control.
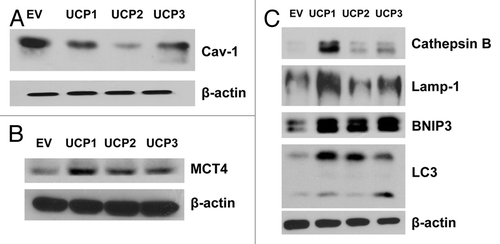
We next evaluated if UCP overexpression leads to autophagy, by immunoblot analysis using antibodies directed against a panel of autophagy markers. shows that fibroblasts overexpressing UCP1, UCP2 and UCP3 all induce autophagy, as assessed by upregulation of BNIP3 and LC3, relative to empty-vector control fibroblasts. However, only fibroblasts overexpressing UCP1 display elevated expression of the lysosomal/autophagy markers Lamp-1 and cathepsin B. These results indicate that UCP1 might preferentially promote lysosomal biogenesis and enhanced degradation in stromal fibroblasts.
Expression of UCP1, but not UCP2 or UCP3, induces a catabolic stroma, with increased generation of ketone bodies and ATP-rich vesicles
To further evaluate if UCP-overexpressing fibroblasts induce a catabolic stroma, we evaluated the accumulation of the ketone body β-hydroxybutyrate in the conditioned media derived from empty-vector, UCP1, UCP2 or UCP3 fibroblasts. shows that fibroblasts overexpressing UCP1 display an up to a 1.9-fold increase in ketone body accumulation relative to control fibroblasts. Conversely, UCP2 and UCP3 fibroblasts show similar ketone production to control cells.
Figure 4. Expression of UCP1, but not UCP2 or UCP3, induces a catabolic stroma, with increased generation of ketone bodies, fatty acids and ATP-rich vesicles. (A) β-Hydroxybutyrate assay. Empty-vector (EV), UCP1, UCP2, or UCP3 fibroblasts were grown in phenol red-free DMEM, containing 2% FBS. After 48h, the concentration of β-Hydroxybutyrate was measured in the cell culture media and was normalized for protein concentration (left) or cell number (right). Note that fibroblasts overexpressing UCP1 display an up to 1.9-fold increase in β-Hydroxybutyrate accumulation, relative to control fibroblasts. Conversely, UCP2 and UCP3 fibroblasts show similar levels of β-Hydroxybutyrate production, as control cells. P values are as shown. (B) Fatty acid β-oxidation, using [3H]-palmitic acid as a substrate. Empty-vector (EV), UCP1, UCP2, or UCP3 fibroblasts were grown for 48h in complete media. Six replicates were performed for each condition. Results are expressed as mean ± SD (p = 0.0007 for UCP1 fibroblasts vs. empty-vector control fibroblasts). Note that UCP1, but not UCP2 or UCP3, promotes a 1.5-fold increase in the rate of fatty acid β-oxidation in human fibroblasts. (C) Quinacrine staining of ATP-□lled vesicles. Empty-vector or UCP1 fibroblasts were stained with quinacrine and immediately observed under the microscope. Where indicated, prior to quinacrine incubation, cells were treated with 25 µM chloroquine for 24 h. The Upper panels shows quinacrine staining (green). Lower panel show the overlay of quinacrine-staining and phase-contrast. Original magnification, 40x. The fluorescence staining indicates that ATP is mainly distributed in granular vesicles. The high 〉uorescence distributed within the cytoplasm demonstrates that UCP1 overexpression increases vesicular intracellular stores of ATP. The levels of green 〉uorescence (ATP accumulation) were dramatically decreased, following treatment with chloroquine.
![Figure 4. Expression of UCP1, but not UCP2 or UCP3, induces a catabolic stroma, with increased generation of ketone bodies, fatty acids and ATP-rich vesicles. (A) β-Hydroxybutyrate assay. Empty-vector (EV), UCP1, UCP2, or UCP3 fibroblasts were grown in phenol red-free DMEM, containing 2% FBS. After 48h, the concentration of β-Hydroxybutyrate was measured in the cell culture media and was normalized for protein concentration (left) or cell number (right). Note that fibroblasts overexpressing UCP1 display an up to 1.9-fold increase in β-Hydroxybutyrate accumulation, relative to control fibroblasts. Conversely, UCP2 and UCP3 fibroblasts show similar levels of β-Hydroxybutyrate production, as control cells. P values are as shown. (B) Fatty acid β-oxidation, using [3H]-palmitic acid as a substrate. Empty-vector (EV), UCP1, UCP2, or UCP3 fibroblasts were grown for 48h in complete media. Six replicates were performed for each condition. Results are expressed as mean ± SD (p = 0.0007 for UCP1 fibroblasts vs. empty-vector control fibroblasts). Note that UCP1, but not UCP2 or UCP3, promotes a 1.5-fold increase in the rate of fatty acid β-oxidation in human fibroblasts. (C) Quinacrine staining of ATP-□lled vesicles. Empty-vector or UCP1 fibroblasts were stained with quinacrine and immediately observed under the microscope. Where indicated, prior to quinacrine incubation, cells were treated with 25 µM chloroquine for 24 h. The Upper panels shows quinacrine staining (green). Lower panel show the overlay of quinacrine-staining and phase-contrast. Original magnification, 40x. The fluorescence staining indicates that ATP is mainly distributed in granular vesicles. The high 〉uorescence distributed within the cytoplasm demonstrates that UCP1 overexpression increases vesicular intracellular stores of ATP. The levels of green 〉uorescence (ATP accumulation) were dramatically decreased, following treatment with chloroquine.](/cms/asset/93a93c28-8eb7-4972-848a-d62ea6035b62/kccy_a_10923058_f0004.gif)
Previous results have shown that UCP2 and UCP3 expression augments fatty acid oxidation. Thus, we next evaluated if UCP overexpression promotes increased fatty acid β-oxidation using [3H]-palmitic acid as a substrate. Interestingly, expression of UCP1, but not UCP2 or UCP3, promotes a 1.5-fold increase in the rate of fatty acid β-oxidation in fibroblasts ().
Previous studies have shown that astrocytes can release ATP via vesicular exocytosis, and ATP-filled vesicles function in the cross-talk between astrocytes and neurons.Citation43,Citation44 To evaluate if a UCP overexpression might facilitate the accumulation of ATP-filled vesicles, empty-vector or UCP1 fibroblasts were stained with quinacrine, an acridine derivative widely used to visualize ATP-containing subcellular compartments in live cells. shows that fibroblasts overexpressing UCP1 display a strong increase in intracellular stores of ATP. We next tested if inhibition of autophagy blocks the accumulation of ATP-enriched vesicles. To this end, prior to quinacrine incubation, cells were pre-treated with the autophagy inhibitor chloroquine. shows that the levels of fluorescence were dramatically decreased following treatment with chloroquine. These results demonstrate that autophagy is a key mechanism underlying the increased release of ATP. However, UCP2 and UCP3 fibroblasts showed similar or only slightly increased quinacrine staining (data not shown), indicating that the increased release of ATP-rich vesicles is specific for UCP1 fibroblasts.
Fibroblasts overexpressing UCP1 show impaired mitochondrial activity, but promote mitochondrial activity in adjacent epithelial cancer cells
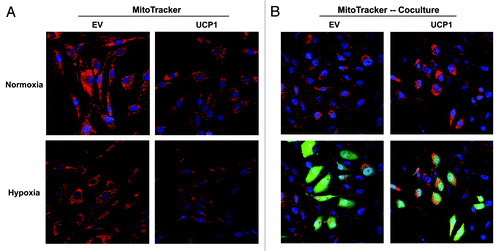
As we observed that UCP1 overexpression leads to increased mitophagy, as assessed by elevated BNIP3 expression, we next evaluated if fibroblasts overexpressing UCP1 show impaired mitochondrial activity. To this end, empty-vector (EV) and UCP1 fibroblasts were stained with MitoTracker, which accumulates in functional mitochondria with an active membrane potential and, thus, correlates with mitochondrial activity.
shows that fibroblasts overexpressing UCP1 exhibit decreased MitoTracker staining relative to control cells in normoxia, and especially under hypoxia, consistent with impaired mitochondrial activity. We have previously shown that fibroblasts with impaired mitochondrial function can boost mitochondrial activity in adjacent cancer cells, likely via an energy-transfer mechanism. Thus, we next evaluated if UCP1 fibroblasts enhance mitochondrial activity in adjacent cancer cells, using a co-culture system of fibroblasts and MDA-MB-231 cells. shows that fibroblasts overexpressing UCP1 promote mitochondrial activity in adjacent cancer cells, relative to control cells.
Figure 5. Expression of UCP1 decreases mitochondrial activity in fibroblasts. MitoTracker staining was used to visualize mitochondrial activity in homotypic cultures and in co-cultures of fibroblasts and GFP-positive MDA-MB-231 cells. MitoTracker accumulates in functional mitochondria with an active membrane potential, thus correlating with mitochondrial activity. (A) Fibroblast homotypic cultures were maintained under normoxia (upper panel) or hypoxia for 6h (Lower panel). DAPI was used to visualize nuclei (blue). Fibroblasts expressing UCP1 exhibit decreased MitoTracker staining (red), relative to empty vector (EV) control cells, consistent with impaired mitochondrial activity, in normoxia, and especially under hypoxia. (B) Fibroblasts (harboring EV or UCP1) and GFP-positive MDA-MB-231 cells were co-cultured for 48 h and maintained in hypoxia for 6 h prior to MitoTracker staining. Note that fibroblasts overexpressing UCP1 promote the mitochondrial activity in adjacent cancer cells, relative to empty vector (EV) control cells. In the top panels, only the red channel is shown, to appreciate the increased MitoTracker staining (red) of GFP-positive MDA-MB-231 cancer cells (green). Original magnification, 40X.
MDA-MB-231 cells overexpressing UCP1, UCP2, or UCP3 display increased autophagy and decreased mitochondrial activity
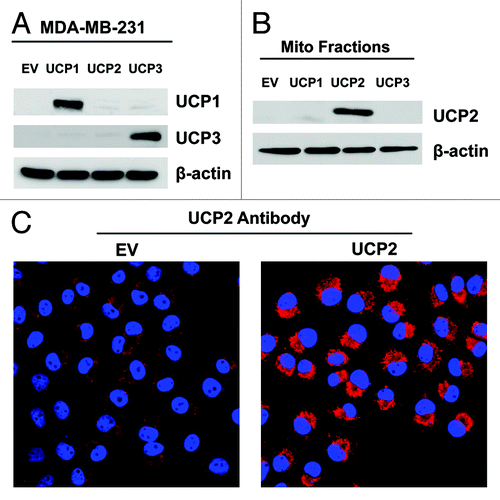
To evaluate the compartment-specific role of UCP overexpression in tumor growth, we also overexpressed UCP1, UCP2 or UCP3 in MDA-MB-231 breast cancer cells, using a lentiviral approach. Empty vector (EV) control cells were generated in parallel. Immunoblot analysis validated the expression of UCP1 and UCP3 in total cell lysates () and the expression of UCP2 in mitochondria-enriched fractions (). Immunocytochemistry confirmed the expression of UCP2, showing a mitochondrial-like staining pattern ().
Figure 6. Overexpression of UCP1, UCP2 or UCP3 in MDA-MB-231 human breast cancer cells. MDA-MB-231 triple-negative breast cancer cells were transduced with a lentiviral vector encoding UCP1, UCP2, UCP3 or the vector-alone control (EV). After selection, cells were subjected to immunoblot analysis, with specific antibody probes. β-actin is shown as an equal loading control. (A) Immunoblot analysis validates the expression of UCP1 and UCP3 in total cell lysates and (B) the expression of UCP2 in mitochondrial-enriched fractions. (C) Immunostaining confirms the expression of UCP2, showing a mitochondrial-like pattern. Original magnification, 40X.
We first evaluated if, similarly to fibroblasts overexpressing UCPs, UCP-overexpressing breast cancer cells display an increase in autophagy markers and decreased mitochondrial function. shows that all three UCP isoforms induce autophagy in breast cancer cells by upregulating the expression levels of Lamp1, BNIP3 and LC3.
Figure 7. MDA-MB-231 cells overexpressing UCP1, UCP2 or UCP3 display increased autophagy and decreased mitochondrial activity. UCP1, UCP2, UCP3 overexpressing breast cancer cells and vector-alone (EV) control cells were grown for 48h in complete media. (A) Immunoblot analysis using antibodies directed against a panel of autophagy markers. Note that all three UCP isoforms induce autophagy, by upregulating the expression levels of Lamp1, BNIP3 and LC3. (B) MitoTracker staining (red) was used to visualize mitochondrial activity. Nuclei were stained with DAPI (blue). Note that cancer cells harboring UCP1, UCP2 or UCP3 show reduced MitoTracker staining, relative to control cells, thus indicating decreased mitochondrial activity.
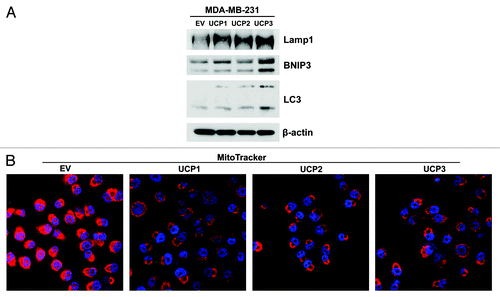
shows that cancer cells harboring UCP1, UCP2 or UCP3 show reduced MitoTracker staining relative to control cells, indicative of decreased mitochondrial activity.
MDA-MB-231 cells overexpressing UCP1, UCP2, or UCP3 display decreased tumor growth
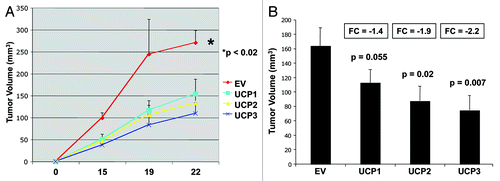
To evaluate if UCP overexpression in cancer cells modulates tumor growth, MDA-MB-231 breast cancer cells harboring the empty-vector (EV), UCP1, UCP2 or UCP3 were injected into the flanks of athymic nude mice. show that breast cancer cells overexpressing UCP1, UCP2 or UCP3 all reduce tumor growth, up to 2.2-fold, relative to EV control cells.
Figure 8. MDA-MB-231 cells overexpressing UCP1, UCP2, or UCP3 display decreased tumor growth. MDA-MB-231 breast cancer cells harboring the empty-vector (EV), UCP1, UCP2 or UCP3 were injected into the flanks of athymic nude mice. (A) Time course of tumor growth (volume) is shown up to 3 weeks post-injection. (B) Tumor volume is shown after tumor excision on day 22 post-injection. Note that breast cancer cells overexpressing UCP1, UCP2 or UCP3 all reduce tumor growth, relative to control cells. p-values are as shown. n = 10 tumors per experimental group.
Discussion
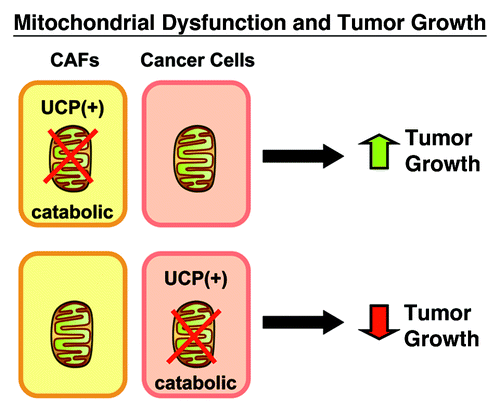
Here, we studied the compartment-specific role of mitochondrial function in breast cancer tumorigenesis using a genetic approach. For this purpose, we recombinantly overexpressed mitochondrial uncoupling proteins (UCPs) to genetically induce mitochondrial dysfunction selectively, either in cancer-associated fibroblasts or epithelial cancer cells (). Our results directly show that the effects of mitochondrial dysfunction are truly compartment-specific. More specifically, mitochondrial dysfunction in cancer-associated fibroblasts significantly promotes tumor growth via the generation of high-energy mitochondrial fuels (such as ketone bodies), independently of tumor angiogenesis. Conversely, mitochondrial dysfunction in epithelial cancer cells (MDA-MB-231) inhibits tumor growth by inducing catabolism in the cancer cells themselves. As such, cancer may be viewed as a simple energy-transfer process, where catabolism in the tumor stroma produces mitochondrial fuels that promote the anabolic growth of epithelial cancer cells via oxidative mitochondrial metabolism (OXPHOS).Citation15,Citation16
Figure 9. Mitochondrial dysfunction and tumor growth. In summary, our results directly demonstrate that genetic induction of mitochondrial dysfunction in cancer-associated fibroblasts (CAFs), via UCP expression, metabolically promotes tumor growth via ketone production. Conversely, genetic induction of mitochondrial dysfunction in epithelial cancer cells, has just the opposite effect, and inhibits tumor growth. Thus, the effects of mitochondrial dysfunction are clearly compartment-specific. We believe that this model of “two-compartment tumor metabolism” can be used to explain the protective effects of Metformin (a mitochondrial “poison”), which acts as a chemo-preventative agent.
In accordance with the idea that ketones can fuel tumor growth, we have previously demonstrated that ketone bodies induce mitochondrial biogenesis in epithelial cancer cells,Citation31 and that i.p. injection of xenografted mice with ketone bodies increases tumor growth by ~2.5-fold, without any increase in tumor angiogenesis.Citation45 Moreover, ketone-treated human breast cancer cells (MCF7) were subjected to genome-wide transcriptional profiling and used to generate prognostic gene signatures.Citation46 These ketone-induced gene signatures accurately predicted increased tumor recurrence, metastasis and poor clinical outcome in human breast cancer patients.Citation46 Similarly, genetic induction of ketone body production in cancer-associated fibroblasts (by expression of ATG16L1 or HMGCS2, or via silencing of the BRCA1 gene) promotes both tumor growth and/or metastasis.Citation27,Citation32,Citation47 Finally, genetic induction of mitochondrial biogenesis in cancer cells (by expression of PGC1-α/β; POLRMT; or MitoNEET) promotes tumorigenesis.Citation48 Thus, we have identified (1) stromal ketone production and (2) mitochondrial biogenesis in epithelial cancer cells as two key metabolic components which are energetically driving tumor cell growth and cancer cell metastasis.Citation31,Citation32
Our current studies predict that mitochondrial inhibitors would be a beneficial anticancer strategy, as they would induce mitochondrial dysfunction in epithelial cancer cells. In fact, numerous clinical studies have now shown that metformin (which functions as complex I inhibitor and mitochondrial “poison”) is an effective anticancer agent, as it prevents the onset of nearly every type of cancer studied in human diabetic patients patients.Citation12-Citation14
In accordance with these findings, we recently showed that ketone bodies produced by stromal fibroblasts can confer tamoxifen-resistance in ER(+)-human breast cancer cells (MCF7), by promoting epithelial mitochondrial function.Citation49,Citation50 Conversely, administration of tamoxifen plus metformin reverses this drug-resistance by inducing mitochondrial dysfunction in epithelial cancer cells.Citation49 Mechanistically, mitochondrial dysfunction induces catabolic metabolism in epithelial cancer cells and sensitizes them to stress-induced programmed cell death, which is induced by anticancer agents such as tamoxifen.Citation15
Thus, the use of mitochondrial inhibitors, such as metformin, should be considered further for cancer prevention studies, especially in high-risk patient populations, and for reversing drug-resistance in cancer patients that have failed conventional therapy. As such, understanding the compartment-specific role of mitochondrial dysfunction in cancer pathogenesis may be the key to unlocking new anticancer therapies and preventing the onset of drug resistance in cancer patients.Citation1-Citation8
Materials and Methods
Materials
Antibodies and their source were as follow: anti-UCP1 (ab10983, Abcam); anti-UCP2 (11081–1-AP, Proteintech); anti-UCP3 (PA1–24895, Pierce); anti-BNIP3 (ab10433, Abcam); anti-Cathepsin B (sc-13985, Santa Cruz); anti-LC3B (ab48394, Abcam); anti-MCT4 (sc-50329, Santa Cruz); anti-Lamp-1 (611043, BD Transduction Laboratories, Sigma-Aldrich); anti-Cav-1 (clone 2297, 610407, BD Transduction Laboratories); anti-β-actin (A5441, Sigma-Aldrich).
Lentiviruses
Lentiviral plasmids, packaging cells and reagents were from Genecopoeia. Forty-eight hours after seeding, 293Ta packaging cells were transfected with lentiviral vectors encoding UCP1 (Ex-C0618-Lv105), UCP2 (X-Z7480-Lv105), UCP3 (Ex-Z0087-Lv105) or empty vector (EX-NEG-Lv105), using Lenti-PacTM HIV Expression Packaging Kit according to the manufacturer’s instructions. Two days post-transfection, lentivirus-containing culture medium was passed through a 0.45 µm filter and added to the target cells (human hTERT-BJ1 fibroblasts or human MDA-MB-231 cancer cells) in the presence of 5µg/ml Polybrene. Transduced fibroblasts were selected with 1.5 µg/ml puromycin. Finally, transduced MDA-MB-231 cells were selected with 2.5 µg/ml puromycin.
Cell culture
Human immortalized fibroblasts (hTERT-BJ1, Clontech) and human MDA-MB-231 breast cancer cells, stably transfected with GFP (kindly donated by Dr. A. Fatatis, Drexel University), were cultured in Dulbecco’s modified Eagle’s medium (DMEM) supplemented with 10% (v/v) fetal bovine serum (FBS), 1% L-glutamine (Gibco), penicillin (100 U/mL) and streptomycin (100 µg/ml). Cells were incubated at 37°C in an atmosphere of 95% air-5% CO2 with 90–95% humidity. For co-culture experiments, fibroblasts (harboring the empty vector (EV) or UCP1) and GFP-positive MDA-MB-231 cells were co-plated onto glass coverslips in 12-well plates in complete media. Cells were seeded at a 5:1 fibroblast to MDA-MB-231 cell ratio, and the total number of cells per well was 1 × 10⁵. After 24 h, media was replaced by DMEM containing 10% NuSerum (BD Bioscience). For hypoxic culture conditions, cells were transferred for 6 h to a hypoxia gas mixer chamber (Ruskinn Invivo2 Hypoxia Workstation, Baker BioScience Solutions) and flushed with a gas mixture containing 0.5% O2 balanced with 5% CO2 and N2 at 37°C.
Immunoblot analysis
Cells were harvested in lysis buffer (10mM Tris pH 7.5, 150mM NaCl, 1% Triton X-100, and 60mM n-octyl-glucoside), containing protease (Roche Applied Science) and phosphatase inhibitors (Sigma). After rotation at 4°C for 40 min, cell lysates were centrifuged at 10,000 g for 15 min at 4°C to remove insoluble debris. Protein concentrations were measured using the BCA reagent (Pierce). Cell lysates were then separated by SDS-PAGE (12% to 15% acrylamide) and transferred to nitrocellulose membranes. After blocking for 1h in TBST (10mM Tris pH 8.0, 150mM NaCl, 0.05% Tween 20) supplemented with 5% nonfat dry milk, membranes were incubated with primary antibodies diluted in TBST with 1% bovine serum albumin (BSA). Horseradish peroxidase-conjugated secondary antibodies [anti-mouse, 1:6000 dilution (Pierce) or anti-rabbit, 1:5000 dilution (BD PharMingen)] were used to visualize bound primary antibodies, with enhanced chemiluminescence (ECL) substrate (Pierce).
Mitochondrial purification
Fibroblasts and cancer cells were grown to confluence, then cells were detached by treatment with trypsin/EDTA and collected by centrifugation. Enriched mitochondrial fractions were isolated using a cell fractionation kit (MS861, Mitosciences, Inc.).
Immunofluorescence
Cells were plated onto coverslips in 12-well plates for 48h in complete media. Then, cells were rinsed with Dulbecco’s phosphate buffered saline (PBS) containing 0.1mM CaCl2 and 1mM MgCl2 (PBS/CM) and fixed with 2% paraformaldehyde in PBS/CM for 30 min. After fixation, cells were washed three times with PBS/CM and permeabilized with IF buffer (PBS/CM, 0.1% Triton-X100, 0.2% BSA) for 10 min. After quenching with 50 mM NH4Cl in PBS/CM for 10 min, cells were rinsed and incubated with anti-UCP2 antibody for 1 h at room temperature. Cells were washed with IF buffer and incubated with fluorescent secondary antibodies (Molecular Probes) for 30 min. After washing, nuclei were counterstained with DAPI and cells were then mounted using a Prolong Gold antifade reagent (P36934, Invitrogen).
Mitochondrial staining
Fibroblasts were seeded on glass coverslips alone or in co-culture with GFP-MDA-MB-231 cells in 12-well plates. After 48 h, cells were incubated with the pre-warmed MitoTracker staining solution (25 nM MitoTracker Orange CMTMRos, M7510, Invitrogen) for 15 min at 37°C. Then, cells were washed in PBS/CM three times and fixed with 2% paraformaldehyde. Nuclei were counterstained with DAPI. Samples were mounted with a Prolong Gold antifade reagent.
Confocal microscopy
Images were collected with a Zeiss LSM510 meta confocal system equipped with oil immersion lens (40X). Images of fluorophore-labeled cells were acquired using a 405-nm diode excitation laser with a band pass filter of 420–480 nm, a 488-nm Argon excitation laser with a band pass filter of 505–550 nm, and a 543-nm HeNe excitation laser with a 561–604-nm filter.
β-hydroxybutyrate assay
Cells were seeded at a density of 9 × 10⁴ in 12-well plates in complete media. The day after, the media was changed to DMEM without phenol red containing 2% FBS. After 48 h, the media were collected. β-hydroxybutyrate concentration was determined using the β-Hydroxybutyrate Assay Kit (K632–100, BioVision) and was normalized either for protein concentration or cell number.
Fatty acid β-oxidation
β-oxidation of fatty acids was assessed as previously described, with minor modifications.Citation2 Briefly, fibroblasts were seeded at a density of 90,000 per well in 24-well plates in complete media and allowed to growth for 2 d. Six replicates were performed for each condition. Fibroblasts were washed with PBS. Then, the media was replaced with 200 µl of PBS/CM pH 7.4, containing 1 mM L-carnitine (Sigma), [9,10(n)-3H] palmitic acid (50.0 Ci/mmol, TRK909, Amersham) bound to fatty-acid-free BSA (final concentration 125 μM, palmitate:albumin 2:1, Sigma), and cells were incubated for 2h at 37°C. At the end of the incubation period, the supernatant from each well was transferred to a microfuge tube containing cold 10% trichloroacetic acid to stop the reaction. Samples were centrifuged at 2200 g for 10 min at 4°C, and the supernatant was transferred to a tube containing 6N sodium hydroxide. Samples were then applied to a column containing 0.5 g/ml Dowex-1X8 ion-exchange resin (217425–100G, Sigma) and eluted with 1 ml deionized water. 3H2O was quantified by scintillation counting. Radioactive 3H2O secreted into the medium was normalized to the cellular protein content in each well.
Quinacrine staining
ATP-rich vesicles were stained with quinacrine (Quinacrine mustard dihydrochloride, Q2876–5MG, Sigma), an acridine derivative widely used to visualize ATP-containing subcellular compartments in live cells. To this end, fibroblasts were seeded at a density of 90,000 onto coverslips in 12-well plates in complete media. After 48 h, cells were washed with PBS and incubated with 40 µM quinacrine for 20 min at 37°C. After two washes with PBS, cells were mounted using SlowFade Gold antifade reagent (S36937, Invitrogen) and immediately observed under the microscope.
Animal studies
One × 106 MDA-MB-231 cancer cells were injected alone or with 3 × 10⁵ fibroblasts [either empty vector (EV), UCP1 or UCP2 or UCP3] in 100 µl of sterile PBS into the flanks of athymic NCr nude mice (NCRNU; Taconic Farms; 6–8 weeks of age). After 22 d, mice were sacrificed, and tumors were dissected out to determine weight and size using calipers. Tumor volume was calculated using the formula X2Y/2, where X and Y are the short and long tumor dimensions, respectively. Tumors were either fixed with 10% formalin or flash-frozen in liquid nitrogen-cooled isopentane.
CD31 immunohistochemistry
Frozen sections (6 µm) were fixed with 4% paraformaldehyde in PBS for 10 min at 4°C and washed 3x with PBS. A 3-step biotin-streptavidin-horseradish peroxidase method was used for antibody detection. After fixation, the sections were blocked with 10% rabbit serum and incubated overnight at 4°C with either rat monoclonal CD31 antibody (550274, BD Biosciences). The sections were then incubated with biotinylated rabbit anti-rat IgG (Vector Labs) and streptavidin-HRP (Dako). Immunoreactivity was revealed with 3, 3′ diaminobenzidine.
Statistical analysis
Data were analyzed with the Student’s t-test. P values lower than 0.05 were considered statistically significant.
Acknowledgments
F.S. was the recipient of a Young Investigator Award from the Breast Cancer Alliance. U.E.M. was supported by a Young Investigator Award from the Margaret Q. Landenberger Research Foundation. Funds were also contributed by the Margaret Q. Landenberger Research Foundation (to M.P.L.). R.S.A. was supported by National Institute on Alcohol Abuse and Alcoholism (NIAAA) training grant T32 AA007467.
This work was also supported, in part, by a Centre grant in Manchester from Breakthrough Breast Cancer in the UK and an Advanced ERC Grant from the European Research Council.
Disclosure of Potential Conflicts of Interest
No potential conflicts of interest were disclosed.
References
- Fiaschi T, Marini A, Giannoni E, Taddei ML, Gandellini P, De Donatis A, et al. Reciprocal metabolic reprogramming through lactate shuttle coordinately influences tumor-stroma interplay. Cancer Res 2012; 72:5130 - 40; http://dx.doi.org/10.1158/0008-5472.CAN-12-1949; PMID: 22850421
- Nieman KM, Kenny HA, Penicka CV, Ladanyi A, Buell-Gutbrod R, Zillhardt MR, et al. Adipocytes promote ovarian cancer metastasis and provide energy for rapid tumor growth. Nat Med 2011; 17:1498 - 503; http://dx.doi.org/10.1038/nm.2492; PMID: 22037646
- Kaambre T, Chekulayev V, Shevchuk I, Karu-Varikmaa M, Timohhina N, Tepp K, et al. Metabolic control analysis of cellular respiration in situ in intraoperational samples of human breast cancer. J Bioenerg Biomembr 2012; 44:539 - 58; http://dx.doi.org/10.1007/s10863-012-9457-9; PMID: 22836527
- Nakajima EC, Van Houten B. Metabolic symbiosis in cancer: Refocusing the Warburg lens. Mol Carcinog 2012; In press http://dx.doi.org/10.1002/mc.21863; PMID: 22228080
- Zhao X, He Y, Chen H. Autophagic tumor stroma: Mechanisms and roles in tumor growth and progression. Int J Cancer 2013; 132:1 - 8; http://dx.doi.org/10.1002/ijc.27664; PMID: 22684793
- Lozy F, Karantza V. Autophagy and cancer cell metabolism. Semin Cell Dev Biol 2012; 23:395 - 401; http://dx.doi.org/10.1016/j.semcdb.2012.01.005; PMID: 22281437
- Hanahan D, Coussens LM. Accessories to the crime: functions of cells recruited to the tumor microenvironment. Cancer Cell 2012; 21:309 - 22; http://dx.doi.org/10.1016/j.ccr.2012.02.022; PMID: 22439926
- Wallace DC. Mitochondria and cancer. Nat Rev Cancer 2012; 12:685 - 98; http://dx.doi.org/10.1038/nrc3365; PMID: 23001348
- Skrtić M, Sriskanthadevan S, Jhas B, Gebbia M, Wang X, Wang Z, et al. Inhibition of mitochondrial translation as a therapeutic strategy for human acute myeloid leukemia. Cancer Cell 2011; 20:674 - 88; http://dx.doi.org/10.1016/j.ccr.2011.10.015; PMID: 22094260
- Wise DR, Thompson CB. Glutamine addiction: a new therapeutic target in cancer. Trends Biochem Sci 2010; 35:427 - 33; http://dx.doi.org/10.1016/j.tibs.2010.05.003; PMID: 20570523
- Ni Chonghaile T, Sarosiek KA, Vo TT, Ryan JA, Tammareddi A, Moore VdelG, et al. Pretreatment mitochondrial priming correlates with clinical response to cytotoxic chemotherapy. Science 2011; 334:1129 - 33; http://dx.doi.org/10.1126/science.1206727; PMID: 22033517
- Goodwin PJ, Stambolic V. Obesity and insulin resistance in breast cancer--chemoprevention strategies with a focus on metformin. Breast 2011; 20:Suppl 3 S31 - 5; http://dx.doi.org/10.1016/S0960-9776(11)70291-0; PMID: 22015290
- Thompson MD, Thompson HJ. A systems pharmacokinetic and pharmacodynamic approach to identify opportunities and pitfalls in energy stress-mediated chemoprevention: the use of metformin and other biguanides. Curr Drug Targets 2012; In press PMID: 23140331
- Muti P, Berrino F, Krogh V, Villarini A, Barba M, Strano S, et al. Metformin, diet and breast cancer: an avenue for chemoprevention. Cell Cycle 2009; 8:2661; http://dx.doi.org/10.4161/cc.8.16.9226; PMID: 19571669
- Martinez-Outschoorn UE, Pestell RG, Howell A, Tykocinski ML, Nagajyothi F, Machado FS, et al. Energy transfer in “parasitic” cancer metabolism: mitochondria are the powerhouse and Achilles’ heel of tumor cells. Cell Cycle 2011; 10:4208 - 16; http://dx.doi.org/10.4161/cc.10.24.18487; PMID: 22033146
- Martinez-Outschoorn UE, Sotgia F, Lisanti MP. Power surge: supporting cells “fuel” cancer cell mitochondria. Cell Metab 2012; 15:4 - 5; http://dx.doi.org/10.1016/j.cmet.2011.12.011; PMID: 22225869
- Martinez-Outschoorn UE, Pavlides S, Howell A, Pestell RG, Tanowitz HB, Sotgia F, et al. Stromal-epithelial metabolic coupling in cancer: integrating autophagy and metabolism in the tumor microenvironment. Int J Biochem Cell Biol 2011; 43:1045 - 51; http://dx.doi.org/10.1016/j.biocel.2011.01.023; PMID: 21300172
- Whitaker-Menezes D, Martinez-Outschoorn UE, Flomenberg N, Birbe RC, Witkiewicz AK, Howell A, et al. Hyperactivation of oxidative mitochondrial metabolism in epithelial cancer cells in situ: visualizing the therapeutic effects of metformin in tumor tissue. Cell Cycle 2011; 10:4047 - 64; http://dx.doi.org/10.4161/cc.10.23.18151; PMID: 22134189
- Sotgia F, Whitaker-Menezes D, Martinez-Outschoorn UE, Flomenberg N, Birbe RC, Witkiewicz AK, et al. Mitochondrial metabolism in cancer metastasis: visualizing tumor cell mitochondria and the “reverse Warburg effect” in positive lymph node tissue. Cell Cycle 2012; 11:1445 - 54; http://dx.doi.org/10.4161/cc.19841; PMID: 22395432
- Lisanti MP, Martinez-Outschoorn UE, Lin Z, Pavlides S, Whitaker-Menezes D, Pestell RG, et al. Hydrogen peroxide fuels aging, inflammation, cancer metabolism and metastasis: the seed and soil also needs “fertilizer”. Cell Cycle 2011; 10:2440 - 9; http://dx.doi.org/10.4161/cc.10.15.16870; PMID: 21734470
- Martinez-Outschoorn UE, Balliet RM, Lin Z, Whitaker-Menezes D, Howell A, Sotgia F, et al. Hereditary ovarian cancer and two-compartment tumor metabolism: Epithelial loss of BRCA1 induces hydrogen peroxide production, driving oxidative stress and NFκB activation in the tumor stroma. Cell Cycle 2012; 11:4152 - 66; http://dx.doi.org/10.4161/cc.22226; PMID: 23047606
- Martinez-Outschoorn UE, Lin Z, Trimmer C, Flomenberg N, Wang C, Pavlides S, et al. Cancer cells metabolically “fertilize” the tumor microenvironment with hydrogen peroxide, driving the Warburg effect: implications for PET imaging of human tumors. Cell Cycle 2011; 10:2504 - 20; http://dx.doi.org/10.4161/cc.10.15.16585; PMID: 21778829
- Pavlides S, Vera I, Gandara R, Sneddon S, Pestell RG, Mercier I, et al. Warburg meets autophagy: cancer-associated fibroblasts accelerate tumor growth and metastasis via oxidative stress, mitophagy, and aerobic glycolysis. Antioxid Redox Signal 2012; 16:1264 - 84; http://dx.doi.org/10.1089/ars.2011.4243; PMID: 21883043
- Sotgia F, Martinez-Outschoorn UE, Howell A, Pestell RG, Pavlides S, Lisanti MP. Caveolin-1 and cancer metabolism in the tumor microenvironment: markers, models, and mechanisms. Annu Rev Pathol 2012; 7:423 - 67; http://dx.doi.org/10.1146/annurev-pathol-011811-120856; PMID: 22077552
- Sotgia F, Martinez-Outschoorn UE, Pavlides S, Howell A, Pestell RG, Lisanti MP. Understanding the Warburg effect and the prognostic value of stromal caveolin-1 as a marker of a lethal tumor microenvironment. Breast Cancer Res 2011; 13:213; http://dx.doi.org/10.1186/bcr2892; PMID: 21867571
- Martinez-Outschoorn UE, Whitaker-Menezes D, Pavlides S, Chiavarina B, Bonuccelli G, Casey T, et al. The autophagic tumor stroma model of cancer or “battery-operated tumor growth”: A simple solution to the autophagy paradox. Cell Cycle 2010; 9:4297 - 306; http://dx.doi.org/10.4161/cc.9.21.13817; PMID: 21051947
- Capparelli C, Guido C, Whitaker-Menezes D, Bonuccelli G, Balliet R, Pestell TG, et al. Autophagy and senescence in cancer-associated fibroblasts metabolically supports tumor growth and metastasis via glycolysis and ketone production. Cell Cycle 2012; 11:2285 - 302; http://dx.doi.org/10.4161/cc.20718; PMID: 22684298
- Chiavarina B, Martinez-Outschoorn UE, Whitaker-Menezes D, Howell A, Tanowitz HB, Pestell RG, et al. Metabolic reprogramming and two-compartment tumor metabolism: opposing role(s) of HIF1α and HIF2α in tumor-associated fibroblasts and human breast cancer cells. Cell Cycle 2012; 11:3280 - 9; http://dx.doi.org/10.4161/cc.21643; PMID: 22894905
- Ertel A, Tsirigos A, Whitaker-Menezes D, Birbe RC, Pavlides S, Martinez-Outschoorn UE, et al. Is cancer a metabolic rebellion against host aging? In the quest for immortality, tumor cells try to save themselves by boosting mitochondrial metabolism. Cell Cycle 2012; 11:253 - 63; http://dx.doi.org/10.4161/cc.11.2.19006; PMID: 22234241
- Guido C, Whitaker-Menezes D, Lin Z, Pestell RG, Howell A, Zimmers TA, et al. Mitochondrial fission induces glycolytic reprogramming in cancer-associated myofibroblasts, driving stromal lactate production, and early tumor growth. Oncotarget 2012; 3:798 - 810; PMID: 22878233
- Martinez-Outschoorn UE, Lin Z, Whitaker-Menezes D, Howell A, Lisanti MP, Sotgia F. Ketone bodies and two-compartment tumor metabolism: Stromal ketone production fuels mitochondrial biogenesis in epithelial cancer cells. Cell Cycle 2012; 11:3956 - 63; http://dx.doi.org/10.4161/cc.22136; PMID: 23082721
- Martinez-Outschoorn UE, Lin Z, Whitaker-Menezes D, Howell A, Sotgia F, Lisanti MP. Ketone body utilization drives tumor growth and metastasis. Cell Cycle 2012; 11:3964 - 71; http://dx.doi.org/10.4161/cc.22137; PMID: 23082722
- Salem AF, Whitaker-Menezes D, Lin Z, Martinez-Outschoorn UE, Tanowitz HB, Al-Zoubi MS, et al. Two-compartment tumor metabolism: autophagy in the tumor microenvironment and oxidative mitochondrial metabolism (OXPHOS) in cancer cells. Cell Cycle 2012; 11:2545 - 56; http://dx.doi.org/10.4161/cc.20920; PMID: 22722266
- Witkiewicz AK, Whitaker-Menezes D, Dasgupta A, Philp NJ, Lin Z, Gandara R, et al. Using the “reverse Warburg effect” to identify high-risk breast cancer patients: stromal MCT4 predicts poor clinical outcome in triple-negative breast cancers. Cell Cycle 2012; 11:1108 - 17; http://dx.doi.org/10.4161/cc.11.6.19530; PMID: 22313602
- Witkiewicz AK, Dasgupta A, Nguyen KH, Liu C, Kovatich AJ, Schwartz GF, et al. Stromal caveolin-1 levels predict early DCIS progression to invasive breast cancer. Cancer Biol Ther 2009; 8:1071 - 9; http://dx.doi.org/10.4161/cbt.8.11.8874; PMID: 19502809
- Witkiewicz AK, Dasgupta A, Sammons S, Er O, Potoczek MB, Guiles F, et al. Loss of stromal caveolin-1 expression predicts poor clinical outcome in triple negative and basal-like breast cancers. Cancer Biol Ther 2010; 10:135 - 43; http://dx.doi.org/10.4161/cbt.10.2.11983; PMID: 20431349
- Witkiewicz AK, Dasgupta A, Sotgia F, Mercier I, Pestell RG, Sabel M, et al. An absence of stromal caveolin-1 expression predicts early tumor recurrence and poor clinical outcome in human breast cancers. Am J Pathol 2009; 174:2023 - 34; http://dx.doi.org/10.2353/ajpath.2009.080873; PMID: 19411448
- Witkiewicz AK, Kline J, Queenan M, Brody JR, Tsirigos A, Bilal E, et al. Molecular profiling of a lethal tumor microenvironment, as defined by stromal caveolin-1 status in breast cancers. Cell Cycle 2011; 10:1794 - 809; http://dx.doi.org/10.4161/cc.10.11.15675; PMID: 21521946
- Sloan EK, Ciocca DR, Pouliot N, Natoli A, Restall C, Henderson MA, et al. Stromal cell expression of caveolin-1 predicts outcome in breast cancer. Am J Pathol 2009; 174:2035 - 43; http://dx.doi.org/10.2353/ajpath.2009.080924; PMID: 19411449
- Ghajar CM, Meier R, Bissell MJ. Quis custodiet ipsos custodies: who watches the watchmen?. Am J Pathol 2009; 174:1996 - 9; http://dx.doi.org/10.2353/ajpath.2009.090363; PMID: 19465642
- Furuta S, Ghajar CM, Bissell MJ. Caveolin-1: would-be Achilles’ heel of tumor microenvironment?. Cell Cycle 2011; 10:3431; http://dx.doi.org/10.4161/cc.10.20.17648; PMID: 22030625
- Galluzzi L, Kepp O, Kroemer G. Reverse Warburg: straight to cancer. Cell Cycle 2012; 11:1059; http://dx.doi.org/10.4161/cc.11.6.19746; PMID: 22343921
- Falchi AM, Sogos V, Saba F, Piras M, Congiu T, Piludu M. Astrocytes shed large membrane vesicles that contain mitochondria, lipid droplets and ATP. Histochem Cell Biol 2012; In press http://dx.doi.org/10.1007/s00418-012-1045-x; PMID: 23108569
- Pangrsic T, Potokar M, Stenovec M, Kreft M, Fabbretti E, Nistri A, et al. Exocytotic release of ATP from cultured astrocytes. J Biol Chem 2007; 282:28749 - 58; http://dx.doi.org/10.1074/jbc.M700290200; PMID: 17627942
- Bonuccelli G, Tsirigos A, Whitaker-Menezes D, Pavlides S, Pestell RG, Chiavarina B, et al. Ketones and lactate “fuel” tumor growth and metastasis: Evidence that epithelial cancer cells use oxidative mitochondrial metabolism. Cell Cycle 2010; 9:3506 - 14; http://dx.doi.org/10.4161/cc.9.17.12731; PMID: 20818174
- Martinez-Outschoorn UE, Prisco M, Ertel A, Tsirigos A, Lin Z, Pavlides S, et al. Ketones and lactate increase cancer cell “stemness,” driving recurrence, metastasis and poor clinical outcome in breast cancer: achieving personalized medicine via Metabolo-Genomics. Cell Cycle 2011; 10:1271 - 86; http://dx.doi.org/10.4161/cc.10.8.15330; PMID: 21512313
- Salem AF, Howell A, Sartini M, Sotgia F, Lisanti MP. Downregulation of stromal BRCA1 drives breast cancer tumor growth via upregulation of HIF-1α, autophagy and ketone body production. Cell Cycle 2012; 11:4167 - 73; http://dx.doi.org/10.4161/cc.22316; PMID: 23047605
- Salem AF, Whitaker-Menezes D, Howell A, Sotgia F, Lisanti MP. Mitochondrial biogenesis in epithelial cancer cells promotes breast cancer tumor growth and confers autophagy resistance. Cell Cycle 2012; 11:4174 - 80; http://dx.doi.org/10.4161/cc.22376; PMID: 23070475
- Martinez-Outschoorn UE, Goldberg A, Lin Z, Ko YH, Flomenberg N, Wang C, et al. Anti-estrogen resistance in breast cancer is induced by the tumor microenvironment and can be overcome by inhibiting mitochondrial function in epithelial cancer cells. Cancer Biol Ther 2011; 12:924 - 38; http://dx.doi.org/10.4161/cbt.12.10.17780; PMID: 22041887
- Martinez-Outschoorn UE, Lin Z, Ko YH, Goldberg AF, Flomenberg N, Wang C, et al. Understanding the metabolic basis of drug resistance: therapeutic induction of the Warburg effect kills cancer cells. Cell Cycle 2011; 10:2521 - 8; http://dx.doi.org/10.4161/cc.10.15.16584; PMID: 21768775