Abstract
A systematic analytical approach combining tryptic and chymotryptic peptide mapping with a Mascot Error Tolerant Search (ETS) has been developed to detect and identify low level protein sequence variants, i.e., amino acid substitutions, in recombinant monoclonal antibodies. The reversed-phase HPLC separation with ultraviolet (UV) detection and mass spectral acquisition parameters of the peptide mapping methods were optimized by using a series of model samples that contained low levels (0.5-5.0%) of recombinant humanized anti-HER2 antibody (rhumAb HER2) along with another unrelated recombinant humanized monoclonal antibody (rhumAb A). This systematic approach’s application in protein sequence variant analysis depends upon time and sensitivity constraints. An example of using this approach as a rapid screening assay is described in the first case study. For stable CHO clone selection for an early stage antibody project, comparison of peptide map UV profiles from the top four clone-derived rhumAb B samples quickly detected two sequence variants (M83R at 5% and P274T at 42% protein levels) from two clones among the four. The second case study described in this work demonstrates how this approach can be applied to late stage antibody projects. A sequence variant, L413Q, present at 0.3% relative to the expected sequence of rhumAb C was identified by a Mascot-ETS for one out of four top producers. The incorporation of this systematic sequence variant analysis into clone selection and the peptide mapping procedure described herein have practical applications for the biotechnology industry, including possible detection of polymorphisms in endogenous proteins.
Introduction
Unintended amino acid substitutions, also known as sequence variants, are a concern during the production of recombinant human monoclonal antibodies (rhumAbs) and other recombinant proteins that are being developed as therapeutics. As such, detection of potential sequence variants during clone selection and bioprocess development are important to the biotechnology industry.
Alterations in the primary structure of a protein can occur as the result of changes at the nucleic acid or protein levelCitation1,Citation2 and fall into three broad categories: mutations at the DNA level, misincorporation at the protein level due to mistranslation or improper tRNA acylation, and miscleavage during the post-translational processing. For example, misincorporation of lysine for arginine has long been reported in recombinant proteins expressed in Escherichia coli (E. coli) when the rare Arg codon, AGA, is used.Citation3,Citation4 The replacement of Gln at His positions has also been observed and explained due to mistranslation.Citation5 Furthermore, read-through of the UGA stop codon resulted in the incorporation of Trp and extension of the gene product, recombinant human methionyl-neurotrophin 3.Citation6 A translational error associated with another rare Arg codon, CGG, induced a missense +1 frameshift and Gln (CAG codon) extension.Citation7 Misincorporation of amino acid analogs, such as norleucine at methionine positionsCitation8,Citation9 and norvaline at leucine positions,Citation10 during protein production in E. coli could be explained by improper tRNA acylation, most likely due to the amino acid analogs having similar structural characteristics as their original amino acids. An example of an altered primary sequence resulting from polypeptide processing events is miscleavage of the mouse leader sequence giving a Ser extension at the N-terminus of the light chain of recombinant mouse mAbs produced in hybridoma culture.Citation11
Two examples of amino acid sequence changes ascribed to misincorporation at the protein level were reported recently in recombinant mAbs expressed in CHO cells.Citation12,Citation13 However, most of the sequence variation cases observed to date in rhumAbs seem to be caused by variations at the DNA level. Citation14–Citation16 These changes may be due to increased mutation rates associated with transfection of DNA into mammalian cells.Citation2 Harris et al. reported a Y376Q variant in the heavy chain of rhumAb HER2 produced in CHO cells from a vector carrying the dihydrofolate reductase (DHFR) gene.Citation14 Dorai et al. reported that about 10% of a recombinant peptide-antibody fusion protein, expressed with a CHO cell line transfected with a glutathione synthetase-containing expression vector, is present as a Phe to Leu sequence variant.Citation15 These two antibody variants were verified by analysis using the polymerase chain reaction (PCR), which revealed the genetic variations at the DNA level in some subclones of stable parent CHO expression cell lines.Citation14,Citation15 A complex sequence crossover variant case was reported by Wan et al. and involved a recombinant mAbs specific to a unique epitope on human IgE.Citation16 The study revealed that the crossover event happened between the V genes of the light and heavy chains of the antibody, which resulted in a variant heavy chain with 16 fewer residues.Citation16
In recent years, a number of amino acid substitutions have been observed in our laboratories. These sequence variants were detected while fully characterizing the antibodies using analytical techniques, such as liquid chromatography-mass spectrometry (LC-MS) for molecular mass determination, peptide mapping and ion-exchange chromatography (IEC). In order to systematically screen for sequence variants, it is necessary to develop appropriate methodologies and incorporate them into the stable cell line development process for final selection of the production clone for manufacturing.
Our main challenge for sequence variant analysis is the detection and identification of low-level variants in rhumAbs. In the published cases cited above, the detection of variant species often relied upon separation of the variant proteins or peptides. The limitation of such approaches is that variant proteins or peptides are not always detectable as distinctly resolved peaks when using liquid chromatographic methods. Proteins or peptides containing amino acid substitutions may elute in the flow-through fraction or co-elute with the dominant expected protein or peptide peaks. To separate and enrich variant antibodies for characterization, various chromatographic and electrophoretic methods can be employed;Citation17 however, it is time consuming to develop a suitable chromatographic/electrophoretic separation method for a particular sequence variant. Furthermore, a particular method may not be applicable for another sequence variant as the nature of amino acid substitution varies. Wade outlined a general approach for detecting protein sequence variants through mass measurement of intact protein using MS.Citation18 Chemical or enzymatic cleavage was then used to generate a peptide mixture for MS analysis to locate variation sites. For rhumAbs, it is difficult to directly detect low-level variants by intact mass measurement since these signals are often masked by signals from the expected antibody, which is much more abundant.
With the recent advancement in MS and related proteomic data mining software, developing a broadly applicable and systematic analytical approach to detect and identify protein sequence variants has become possible. In 2000, Yates’ lab published pioneering work in identifying protein sequence variants resulting from single-nucleotide polymorphisms (SNPs) using a mass spectrometric method.Citation19 By combining LC-MS/MS characterization of the peptide mixtures generated from digests with multiple proteases with an automatic data analysis approach using a modified version of the SEQUEST program, they were able to identify all of the amino acid sequence variations in a mixture of six versions of human hemoglobin.Citation19 In 2002, Creasy and Cottrell introduced an error tolerant mode for database matching of uninterpreted tandem MS data that already have at least one significant protein match.Citation20 The concept of SNPs as demonstrated by Yates et al.Citation19 was adopted in the error-tolerant search (ETS) program for identifying primary sequence variants. In the search engine, in addition to a comprehensive list of chemical and post-translational modifications, a substitution matrix was generated by back translating each amino acid residue to its codon, making all possible single base substitutions, and then re-translating to the amino acid sequence. The ETS mode has been implemented as a second pass method in the commercially available Mascot web-based computer search program.
In this work, we present a general procedure to detect and identify sequence variants in rhumAbs by combining HPLC-UV/MS/MS characterization of peptide maps with the Mascot-ETS data analysis package. The HPLC-UV/MS/MS acquisition methods were optimized by using a sequence variant model system prepared by mixing two highly similar rhumAbs in varying proportions. Two case studies are included to demonstrate how this sequence variant analytical approach was incorporated into the stable CHO cell line development of two therapeutic rhumAb projects.
Results
Tryptic peptide mapping with UV detection for the sequence variant analysis.
Development of a robust tryptic peptide mapping method that can be applied to a variety of rhumAb molecules required optimization of the gradient and column temperature. The method we developed to identify a glycation hot spot in a rhuMAbCitation21 was adopted as a starting point in this work. The in silico tryptic digestion of IgG1 recombinant humanized rhumAb A or rhumAb HER2 resulted in approximately 60 peptides, including about 24 small peptides with molecular masses less than 600 Da. To separate the small peptides from the flow-through solvent front peaks, the first part of the gradient was initiated at 0% solvent B (0.09% TFA in 90% acetonitrile). The main portion of the gradient was then revised to be even shallower (0.22% solvent B per minute), which covers the gradient from 10% solvent B to 40% solvent B in 137 minutes before the gradient is rapidly increased to 95% solvent B in 2 minutes for the column wash and regeneration. This shallow gradient was designed to achieve good chromatographic separation for the majority of the rhumAb tryptic peptides. The column temperature was raised from 45 to 55°C to provide robustness and reduce column carry-over of the hydrophobic peptides.
This tryptic peptide mapping method with HPLC-UV detection was applied to rhumAb HER2 and rhumAb A, respectively (). Almost all of the 60 theoretical tryptic peptides were separated from one another with the exception of several hydrophilic di- and tripeptides that eluted in the solvent front. Automatic integration of the tryptic peptide map from 3 minutes to 160 minutes demonstrated a total of about 80 individual peaks for the tryptic digests of rhumAb HER2 and rhumAb A, indicating that some miscleaved peptides were produced during the tryptic digestion.
This tryptic peptide mapping method with HPLC-UV detection was also evaluated using the sequence variant model samples (). Visual comparison of the profiles of the mixed rhumAb HER2 and rhumAb A model samples revealed ten new peaks that were not present in the control sample of rhumAb A. Nine of the new peaks were confirmed by MS analysis to be the rhumAb HER2 peptides (), while the new peak at 84 minutes was a miscleaved tryptic peptide from rhumAb A. The remaining four peptides, out of the total of 13 distinct tryptic peptides from rhumAb HER2 (), were not detected by direct comparison of the tryptic map UV profiles, indicating they may co-elute with the abundant rhumAb A peptides or the solvent front. shows the stacked view of the first portion of the maps (with a retention time of 0 to 60 minutes). To define the detection sensitivity of a peptide sequence variant by UV profiling, the relative percentage of its peak area against the total peak area of all peptide peaks in a map was considered as an appropriate indicator because, at this UV detection stage, the identity of the variant peptide would likely be unknown. By automatic integration of the entire map, all of the 9 fully resolved rhumAb HER2 peptide peaks could be detected at levels ⩾0.03% relative to total peak area of peptides when rhumAb HER2 was added to the rhumAb A sample at 3% and 5% (). However, when 1% rhumAb HER2 was added to the rhumAb A sample, HC-T9 at 46.6 minutes, HC-T10 at 68.6 minutes, and LC-T5 at 114.0 minutes became indistinguishable from background UV signals. It is reasonable to propose that the limit of detection of this UV profiling approach is 0.03% for a well resolved variant peptide peak relative to total peak area of all peptides in the tryptic peptide map; this corresponds to ∼3% at the protein level relative to an expected rhumAb.
Optimization of tandem mass spectrometry acquisition parameters.
The sensitivity of UV profiling rhumAb tryptic peptide maps can be addressed by using MS detection. Detection and identification of sequence variant peptides by MS requires acquisition of MS/MS data for the variant peptides. With a typical LTQ MS data acquisition setting, only a few of the top, most intense ions are selected for data-dependent ion zoom scans and a subsequent product ion scan (MS/MS) after collision-induced dissociation (CID). The ion intensities for the minor sequence variant peptides are usually low and their signal appearance windows are narrow. Data-dependent scans could not normally be triggered for variant peptide ions, particularly when they co-elute with abundant expected peptides because they may not rank among the top most intense ions in a full MS scan spectrum. To address this issue, the dynamic exclusion (DE) function can be activated during LTQ tandem mass spectral data acquisition. The DE function allows an LTQ mass spectrometer to conduct MS/MS scans on a significantly larger number of peptides that have a low ion intensity, instead of having to repeat MS/MS scans on a few of the most intense peptide ions.Citation19 Meanwhile, MS/MS data redundancy can be reduced.
Using a model sample (rhumAb A with 0.5% rhumAb HER2) as a test case, we compared LTQ ESI-MS/MS data acquisition methods with and without the DE function. Key parameters related to the DE, such as scan event numbers, dynamic repeat counts and the exclusion duration time, were evaluated simultaneously. With the DE function enabled, the MS/MS spectra were acquired for almost all of the co-eluted low level rhumAb HER2 peptides (). The only missed peptide was HC-T8, a dipeptide with a sequence of GR and a mass that was outside of the LTQ full MS scan range (300–2000); however, without enabling the DE function, MS/MS spectra could not be acquired for variant peptides HC-T5, LC-T3 or LC-T7 (). Review of the full MS scans for these three peptides indicated that their spectra were dominated by intense ions from multiple charged ions from the abundant expected peptide ions. Those co-eluting low intensity ions were all ranked in lower order than the fifth most intense ion. This demonstrates that enabling the DE function is critical for acquiring MS/MS data for low level sequence variant peptides.
Chymotryptic peptide mapping as a complementary method.
Tryptic peptide mapping alone cannot necessarily provide ≥95% overall sequence coverage for a rhumAb. In general, there are approximately two dozen small peptides with molecular masses smaller than 600 Da that are generated by tryptic digestion of a rhumAb. If an amino acid substitution takes place in these peptide sequences, it probably will not be detected by a Mascot search of the raw tandem mass spectra data. The search score for these small peptides is usually too low to be considered as a confident hit. Moreover, a peptide with molecular mass around 6,700 Da that spans more than 60 amino acid residues in the Fc region is often generated by tryptic digestion of rhumAbs with an IgG1 framework. This peptide usually does not ionize or fragment well in the LTQ mass spectrometer. Consequently, the quality of the MS/MS spectra is poor and results in its mis-identification by automatic Mascot database search.
Due to lack of specificity, a chymotryptic peptide map of an antibody tends to be complicated. As shown in , chymotryptic maps are considerably more complex than tryptic maps. Over 120 peptide peaks were observed for each of the chymotryptic digests of rhumAb A and rhumAb HER2. Tandem MS characterization suggests that chymotryptic digestion of rhumAb A and rhumAb HER2 generates many nonspecifically cleaved peptides composed of 5 to 15 amino acid residues. In particular, missing tryptic peptides, which often include small peptides with molecular masses <600 Da, can be found using a chymotryptic map. Sequence identification is therefore possible using automatic Mascot database search based on the MS/MS spectra from the chymotryptic map. The overall sequence coverage by tryptic or chymotryptic mapping with LC-MS/MS analysis was 88% and 87%, respectively, for rhumAb HER2 when it was added to rhuMAb A at the 1% protein level (data not shown); however, by combining both methods, an overall sequence coverage of 98.5% was achieved for rhumAb HER2 at the 1% level. In addition, for those overlapping amino acid sequences, which account for approximately 69% of the entire sequence of rhumAb HER2, the two enzymatic peptide mapping methods confirm one another, thereby increasing the sequence variant detection confidence. The purpose of using chymotrypsin for the secondary map is to increase the sequence coverage to enable more complete detection of potential sequence variants at any residue. It should be noted that, due to their lack of specificity and complex chromatograms, chymotryptic peptide maps are generally not suitable for estimating the relative percentage of a sequence variant.
Estimating the relative percentage of sequence variants.
To accurately quantify sequence variants by MS, stable isotope labeling of the peptides would be the most appropriate method, but it is not practical to synthesize the stable isotope labeled variant and expected peptides and develop a calibration curve to accurately quantify the sequence variants for screening clones because of the time and cost involved. Hence, an estimate of the sequence variant level can be made based on the UV profile of a peptide map when both the variant peptide and expected peptide are well separated. When they are not well resolved, integration of extracted ion chromatograms (EIC) of variant and expected peptides can be used. This estimate of relative percentage is often sufficient for clone selection purposes as those clones that produce significant levels of sequence variants are often not further developed.
The mixed rhumAb HER2 and rhuMAb A model samples were used to evaluate the accuracy of the UV- and MS-EIC-based quantification methods. The HC-T10 and HC-T11 peptides () of rhumAb HER2 were selected as marker peptides for quantification purposes because they are well separated from other abundant peptide peaks and their sequences (NTAYLQMNSLR and AEDTAVYYCSR, respectively) differ from the corresponding peptides of rhumAb A by only one amino acid residue (A replaced by F for HC-T10 and S replaced by A for HC-T11, respectively). The rhumAb HER2 levels in rhumAb A can be experimentally determined by integrating the UV or EIC signals of these two marker peptides and calculating against the peak areas of their corresponding rhumAb A peptides. As shown in , the rhumAb HER2 levels estimated based on the UV signals of HC-T10 and HC-T11 peptide markers are systematically slightly higher than their true percentages added at the protein level. This suggests that the UV signals of the variant peptides could be used as markers to reasonably estimate the levels of rhumAb HER2 added if a standard calibration curve is established to correct the systematic determination error. It should be pointed out that the numbers presented in are different from those listed in , where the HC-T10 peptide levels based on automatic integration of all UV signals were calculated against the total peptide peak area of the entire map.
The relative percentages of rhumAb HER2 determined based on EIC profiles of the two peptides correlate well with the true spiking rhumAb HER2 levels. This is not surprising because the one amino acid change between rhumAb HER2 peptides of HC-T10 (Ala to Phe) and HC-T11 (Ser to Ala) and their corresponding rhumAb A peptides did not generate large changes in chemical characteristics or ionization efficiency. However, for those variant peptides with nonconservative amino acid substitutions that may cause significant change in charge state or hydrophobicity, an estimate obtained using this approach is probably less accurate.
Case I: visual comparison of the peptide mapping UV profiles finds sequence abnormality in rhumAb B samples.
During the early stage of stable CHO cell line development, the top four producers of rhumAb B (Clone #3, #6, #11 and #104) were selected based on their high titer and desirable growth and product quality characteristics. The rhumAb B samples were expressed from the four stable CHO clones and purified by Protein A affinity chromatography. The two-enzymatic peptide mapping methods were used to characterize sequence variants. After enzymatic digestion and data acquisition with the online HPLC-UV/MS/MS instrumentation, the HPLC-UV tryptic peptide maps of the rhumAb B samples were overlaid and compared. A new peak N1 at 48 minute in clone #3 () and another new peak N2 at 88 minute in clone #11 () were observed when comparing the UV maps in an expanded view. Integration of the new peaks showed that peak N1 is 0.05% and peak N2 is 0.9% against the total peak area of all peptides, respectively. We estimated that, based upon the above modeling study, the corresponding variant antibodies of the two new peptide peaks could be higher than 3% at the protein level.
Comparison of the chymotrypsin peptide map UV profiles was also performed. A stack view of the chymotryptic peptide maps of rhumAb B samples from the top four clones are shown in . There was no new peak in clone #3 that corresponded to the new peak N1 that was observed in the tryptic map. Due to the relatively non-specific activity of the chymotrypsin enzyme and the resulting multitude of peaks produced in its peptide map, it is likely that the peak corresponding to the new peak N1 co-eluted with another peak in the chymotrypsin map. A new peak was observed in the chymotryptic map at 122 minutes in clone #11 () that was later confirmed to be related to the new peak N2 observed in the tryptic map.
Tandem mass spectral data of the tryptic peptide maps were collected simultaneously with the UV profiling using the LC-MS/MS acquisition method that was developed with the DE functionality enabled. A first-pass Mascot search with the acquired MS data led to the identification of all of the peptide peaks except the new peptide peaks N1 and N2. The sequence coverage of the tryptic peptide map was 89% for the intact antibody. While eighteen small (di-, tri- or tetra-amino acid) peptides were missed on the tryptic peptide map, most of them were covered by the complementary chymotryptic peptide map. The combined sequence coverage from the tryptic map and the chymotryptic map was 99%.
With a second-pass Mascot error tolerant search submitting only the MS/MS data for the new peaks, peak N1 was assigned as an M83R sequence variant peptide of NTLYLQM (MH+ 882.44, covering heavy chain residues 77 to 83 of rhumAb B) and peak N2 was assigned as a P274T sequence variant peptide of TPEVTCVVVDVSHEDPEVK (MH+ 2140.01, covering heavy chain residues 259 to 277 of rhumAb B). Manual investigation was necessary to confirm Mascot-ETS assignment of the sequence variants. shows the MS/MS spectrum of the variant peptide N1 at 48 minute of a doubly charged m/z 454.16 ion. The MS/MS spectrum of the variant peptide showed a mass shift of +25 Da in all of the y-ions and no mass shift in any of the b-ions if they are compared to the theoretical fragment ions of the expected peptide NTLYLQM, indicating a change at the C-terminal methionine residue of the peptide. Methionine cyanilation,Citation22 a chemical modification of methionine causing a mass addition of 25 Da, was deemed unlikely under our experimental condition. Furthermore, the apparent tryptic cleavage at M83 cannot be explained by any modification on methionine.
show the MS/MS spectra for the variant peptide from peak N2 of a doubly charged ion of m/z 1072.48 and the expected peptide from peak P2 of a doubly charged ion of m/z 1070.48, respectively. In the MS/MS spectrum of the variant peptide, a mass shift of +4 Da was observed in the y-ion series starting from y4 of m/z 476.36 and the same mass shift was observed in the b-ion series starting from b16 of m/z 1770.72. The mass shift in the b- and y-ions series pinpoints a change at P274 of the expected P2 peptide with sequence of TPEVTCVVVDVSHEDPEVK. The mass shift of +4 Da is consistent with a P274T amino acid substitution. Further evidence was found to support the identification of the P274T sequence variant when the overall MS/MS fragmentation patterns were compared. For the expected peptide, two prominent fragment ions, y4 (m/z 472.29) and b15 (m/z 1668.78), were present in the MS/MS spectrum. This distinct fragmentation pattern was the result of a preferential breaking of the peptide bond D273–P274 due to the proline effect.Citation23,Citation24 In contrast, the corresponding y4 and b15 ions in the variant peptide MS/MS spectrum were greatly decreased. Finally, the UV peptide maps shown in provide additional evidence. First, the decrease of the expected peptide peak P2 at 89.6 minute and the appearance of the new peak N2 at 88 minute in clone #11 suggest that peak N2 and P2 are related, since no other new peak was observed in the peptide map of the clone sample. Second, the variant peptide N2 eluted 1.6 minutes earlier than the P2 peak, which is consistent with the hydrophobicity loss when proline was replaced by a threonine residue.
The levels of the sequence variants in clone #3 and clone #11 were estimated based on both the UV map and the extracted ion chromatogram. For the M83R sequence variant in clone #3, the variation introduced a trypsin cleavage site and the variant peptide NTLYLQRNSLR was cleaved to two peptides NTLYLQR and NSLR during peptide mapping. NSLR is a short hydrophilic peptide that was eluted in the flow-through peak. NTLTLQR is the variant peptide peak N1 observed in the map. The level of the M83R sequence variant was estimated using the integrated peak N1 area divided by the sum of the peak area for N1 and the expected peptide NTLYLQMNSLR. This approximation actually underestimated the level of the M83R sequence variant in clone #3 since the peak area of peptide NSLR, which was not available, was not included. Based on the UV map, the M83R sequence variant was estimated to be 6%. Based on the extracted ion chromatogram, the level of M83R sequence variant in clone #3 was estimated to be 5%.
For the P274T sequence variant in clone #11, both the expected peptide peak P2 TPEVTCVVVDVSHEDPEVK (90.0 minute) and the P274T variant peptide peak N2 TPEVTCVVVDVSHEDTEVK (88.4 minute) were completely separated. The level of the P274T sequence variant was estimated to be 43% based on the UV peak area of the variant peak divided by the sum of the UV peak areas of the expected wild type and variant peptide peaks. Based on the EIC, the level of P274T sequence variant was 45%. The P274T sequence variant level determined by EIC is very close to the level determined by UV, probably because the variant and wild type peptide are chemically similar for ionization and the HPLC solvent composition was very similar since these two peptides eluted very close to each other on the peptide map.
Case II: Mascot-ETS reveals an extremely low level sequence variation in a rhumAb C sample.
The UV profiles of both tryptic and chymotryptic peptide maps of rhumAb C samples from the top four clones were overlaid and compared (data not shown). No outstanding new peak with a peak area percentage higher than 0.03% against total peak area was observed when comparing the UV maps in an expanded view. It suggests that the sequence variants, if any, in the top four clone rhuMAb C samples are below the detection limit of UV peptide maps. In this case, we relied on mass spectral data and Mascot-ETS for detecting extremely low levels of sequence variants.
The tandem mass spectral data of entire tryptic maps of the top four clone rhumAb C samples were submitted to auto-analysis by Mascot-ETS and a list of tentative sequence variants, in size up to approximately twenty for each clone, could be generated. Many of the suggested sequence variants are false positives and could be ruled out by manual investigation.Citation22 For example, the manual assessment results of seven Mascot-ETS suggested sequence variants for clone#110 was summarized in . Among them, the Asp replacement by His (No. 1 in ) was easily identified as a false positive because the suggested variant peptide co-eluted on the tryptic peptide map with its corresponding expected peptide, which is contradictory with the peptide hydrophobicity change. It is known that the carboxyl side chain of the acidic residues (D, E) readily pairs with the alkaline ion (Na+ or K+) during electrospray ionization;Citation25 the ETS suggested D-to-H substitution most likely came from the sodium adduct ion of the expected peptide. The Asn replacement by His (No. 4 in ) suggested by the auto-database search was most probably based on the mass change of 23 Da. We concluded that it is also a false positive due to a sodium adduct because the suggested variant peptide co-eluted with the deamidated form of its expected peptide. In the expected peptide, the Asn residue is adjacent to a Gly, which makes the Asn prone to deamidation.Citation26 The sodium adduct could be formed with the deamidated form of Asp or isoAsp, resulting in a combined mass shift of 23 Da from the expected peptide.
The suggested Leu substitution by Pro and Ser by Ala (No. 3 and 5, respectively, in ) sequence variants were ruled out because the MS/MS spectra of the variant peptide showed that the mass shift (−16 Da) was not from the suggested Leu or Ser residue, but from the adjacent Asn residue. Because the Asn is followed by a Gly residue, the observed variant peptides were most likely succinimide intermediate forms of the expected peptides characterized by a loss of 17 Da on the Asn residue. For the ETS suggested Cys replacement by Tyr sequence variant (No. 2 in ), the variant peptide also co-eluted with the carboxymethylated form of the expected peptide, and so it was considered a false positive. The wrong assignment of the variant by ETS was probably due to the limited mass accuracy (3 Da) of LTQ, which made it indistinguishable from the amino acid substitution (+60 Da) and the S-carboxymethylation (+58 Da) for ETS. The suggested sequence variant No. 7 comes with concurrent double changes: D-to-V amino acid substitution (mass shift is −16 Da) and methionine oxidation (mass shift is +16 Da). Manual investigation of the MS/MS spectrum revealed that the methionine residue was not oxidized. Also, the net mass difference of the suggested variant peptide is zero. Hence, it was ascribed as a false positive.
The ETS-suggested Leu replacement by Gln (No. 6 in ) was the only one confirmed to be a true sequence variant for clone #110 by manual investigation. The expected peptide was LTVDK (MH+ 575.34, spanning heavy chain residues 413 to 417 of rhumAb C) and the variant peptide was QTVDK with an observed mass of m/z 590.22. shows the MS/MS spectra for the expected peptide at 30.0 minutes () and for the variant peptide at 16.9 minutes (). All of the b-ions of the variant peptide exhibited a mass shift of 14.97 Da, while the y-ions matched those from the expected peptide. The MS/MS spectrum was consistent with the L413Q amino acid substitution at the N-terminus of the variant peptide. The retention time shift from 30.0 minutes to 16.9 minutes was also consistent with the decrease in peptide hydrophobicity that occurs with the amino acid substitution of a Leu with a Gln. The level of this sequence variant was estimated to be 0.3% based on the calculation of the peak area of the EIC of the variant peptide divided by the sum of the peak areas of the EIC signals of the expected and variant peptides.
Discussion
Unintended amino acid substitutions resulting from mutations or translational errors have been observed in several positions in rhumAbs, including CDRs and constant regions, in our laboratories. Although it is difficult to assess the possible deleterious effects in humans due to minor amounts of those variants in rhumAb therapeutics, altered bioactivity and increased immunogenicity are potential concerns. For example, a single Asn35 mutation to Ser in the first CDR of the light chain of a mAb decreased its binding affinity slightly.Citation12 While sequence variants in constant regions are less likely to affect the binding properties of an IgG molecule, they have the potential to modify the allotype, which could ultimately provoke immune responses as a result of allo-immunization.Citation27,Citation28 Since removal of sequence variants during the purification of a therapeutic rhumAb is likely to be extremely difficult, it is better to prevent their occurrences in the first place. Hence, assay strategies should be implemented to identify and minimize such potential errors when developing CHO expression systems for producing rhumAbs used in human therapies. Since it is difficult to detect and quantify random sequence variations using conventional analytical characterization methods, modern analytical techniques should be developed to address these challenges.
Most often a potential therapeutic rhumAb molecule is not well characterized during early stages of clinical development, particularly when it is being expressed at small scale for development of a stable cell line. Since a molecule-specific peptide mapping method is not generally available for use in a sequence variant analysis experiment early on, it seemed plausible that a “standardized” peptide mapping method could be developed and applied to essentially any rhumAb molecule. Tryptic peptide mapping was selected as the primary approach because it provides good specificity of proteolysisCitation29 and generates reproducible peptide maps. Also, most rhumAb tryptic peptides lie within a size range suitable for mass spectral analysis.Citation30 Another advantage is that basic residues, e.g., K, R, are located at the C-terminus of the tryptic peptides, which produces dominant y-series ions in MS/MS experiments, and this has benefits in the interpretation of the MS/MS data.Citation31 However, in our characterization of rhumAb therapeutics, the percentage of protein sequence coverage is targeted to be ⩾95% for overall. Tryptic peptide mapping alone cannot necessarily fulfill this requirement because trypsin usually generates a number of small peptides that elute in the void volume. Thus, two enzymatic peptide mapping methods, one using trypsin as the primary digestion protease and the other using chymotrypsin as the secondary digestion protease, were used in combination as the “standardized” approach. Other more specific proteases, such as Asp-N and Glu-C, are not chosen as the secondary enzyme because their peptide digests of IgG1 rhumAbs often consist of a few large peptides with molecular masses greater than 6,000 Da, which overlap with the sequence of the one large tryptic peptide (∼6,700 Da). These large peptides typically do not fragment well in the CID experiments, hence, it would be difficult to confidently interpret the MS/MS spectra and pinpoint the exact locations for potential sequence variants.
In this work, “standardized” methods, including a 190 minute HPLC gradient and DE function enabled MS settings, were established for both tryptic and chymotryptic peptide mapping, and these allowed effective screening for the presence of sequence variants in a recombinant antibody at low levels, e.g., <5%. The limit of detection of this two-peptide-mapping approach is established for two different detection techniques, UV at 214 nm and tandem MS with Mascot-ETS auto-analysis. With visual comparison of UV peptide maps, if a variant peptide is not co-eluting with an abundant expected peptide, then it can be detected as a new peak when its relative peak area is ≥0.03% relative to total peptide peak area; this corresponds to ∼3% (w/w) at the spiked-in protein level relative to an expected rhumAb. The UV peptide map comparison approach can be used as a rapid screening method to determine if one clone, among many, produces a significant amount of a sequence variant. One of the assumptions when using visual comparison of UV-peptide maps is that it is unlikely that all of the clones being screened would generate the same sequence variant. The successful detection and identification of the two sequence variants (M83R at 5% and P274T at 42% levels) from two rhumAb B clones described in the case I study demonstrated that the UV map comparison is capable of detecting sequence variants at the protein levels >3%.
More sensitive detection is achieved by using the two-peptide-mapping with tandem MS detection coupled with Mascot-ETS. This combined approach allowed for the detection and identification of all of the rhumAb HER2 peptides when added to rhumAb A at the protein level of 0.5%. The second case study presented in this work demonstrated that this approach is capable of detecting and identifying sequence variants as low as 0.3% at the protein level. However, although this MS detection coupled with Mascot-ETS database search technique is more sensitive than the UV map comparison technique, it should only be used as a complimentary method to the latter because it comes with two main limitations. First, the Mascot-ETS search is based on single amino acid variations resulting from single nucleotide changes. Therefore, a peptide sequence variant cannot be identified by the ETS search if it contains a single amino acid variant resulting from two concurrent nucleotide changes or more than one amino acid substitution. Second, as shown in the second case study, the Mascot-ETS search often generates many false-positives and manual investigations of mass spectral data to verify the sequence variant suggestions are labor intensive and time consuming; very often well-trained mass spectrometric specialists are required to conduct such investigations.
At the present time, there is no commercially available software that is better suited than the Mascot-ETS approach for sequence variant analysis. Clearly a more advanced and specialized software is needed for automatic tandem mass spectrometric data analysis for full coverage of all potential sequence variations. In order to reduce the high false-positive rate of the Mascot-ETS search, efforts from both bioinformatics and mass spectrometric instrumentation perspectives have been undertaken in our laboratories. For example, Mascot Distiller has been evaluated for processing the raw data into high quality, de-isotoped peak lists before the Mascot-ETS search is conducted. A script written for facilitating analysis of the post-ETS search outputs for identifying sequence variants has been evaluated. In principle, high resolution MS/MS data will decrease the false-positive rates; however, Mascot-ETS does not give more credit to isotopically resolved fragment ion spectra. As a consequence, we decided to use a low resolution LTQ linear ion trap mass analyzer for MS/MS data acquisition, which yielded more false positives, but higher probability of catching minor variants due to fast cycle time. Improvements in the quality of MS/MS data, and the tools utilizing that information, will improve sequence variant analysis. Such investigations are ongoing in our laboratories, and we believe that results of these efforts would significantly reduce false-positive ETS outputs and data analysis time.
Materials and Methods
Materials
Sequencing-grade trypsin was purchased from Promega (Madison, WI, USA). Chymotrypsin (from bovine pancreas) was purchased from Roche Applied Science (Mannheim, Germany). Tris(hydroxymethyl)aminomethane (TRIS Base), hydrochloric acid, and sodium hydroxide were purchased from J.T. Baker (Philipsburg, NJ, USA). Dithiothreitol (DTT), iodoacetic acid (IAA), and calcium chloride dihydrate were purchased from Sigma (St. Louis, MO, USA). Trifluoroacetic acid (TFA, >99.5% purity) was purchased from Pierce (Rockford, IL, USA). HPLC-grade water and acetonitrile were purchased from Honeywell Burdick & Jackson (Honeywell, Morristown, NJ, USA). Deionized water was prepared using a Millipore’s Milli-Q system (Bedford, MA, USA).
Preparation of model samples.
Two rhumAbs (referred to as rhumAb HER2 and rhumAb A) were produced using proprietary techniques at Genentech (South San Francisco, CA). A series of model samples (using rhumAb HER2 as a model variant of rhumAb A) were prepared by adding rhumAb HER2 directly into rhumAb A samples. Small amounts of rhumAb HER2 (20 mg/mL) were mixed with rhumAb A (20 mg/mL) as follows: 1 μL rhumAb HER2 with 199 μL A, 1 μL rhumAb HER2 with 99 μL A, 3 μL rhumAb HER2 with 97 μL rhumAb A, and 5 μL rhumAb HER2 with 95 μL rhumAb A to generate rhumAb A samples with respective 0.5, 1, 3 and 5% protein sequence variants, respectively, from rhumAb HER2.
Stable CHO cell lines for rhumAb B and rhumAb C.
CHO cell lines stably expressing rhumAb B and C were generated by transfecting parental CHO cells deficient in DHFR with plasmid encoding genes for DHFR and the heavy chains (HC) and light chains (LC). The CHO cells were maintained in proprietary serum-free F12/DMEM-based media at 37°C and 5% CO2. Transfected cells were inoculated in medium in 96-well plates in the presence of methotrexate, and good producers were identified for scale up over several weeks based on antibody expression. The top four producers, clones #3, #6, #11 and #104 for rhumAb B and clones #19, #109, #110 and #222 for rhumAb C, respectively, were selected for their high titer, as well as their desirable growth and product quality characteristics as determined from a shake flask evaluation using a fed-batch process with temperature shift.
The harvested cell culture fluids (HCCF) of the top four clones from the shake flask evaluation experiments were submitted to a small-scale Protein A isolation. About 3 mL of the HCCF were loaded onto a POROS A/20 column (4.6 mm × 100 mm, Applied Biosystems, Foster City, CA) that had been equilibrated with 100 mM sodium phosphate, 250 mM sodium chloride, pH 6.0. The column was washed with three column volumes of equilibration buffer, followed by three column volumes of 0.4 M potassium phosphate pH 7.0, and then another three column volumes of equilibration buffer. The antibody was eluted with 0.1 M acetic acid pH 2.9 and neutralized to ∼pH 5.0 by the addition of 1 M sodium phosphate buffer at pH 6.0. A 5% stock solution of polysorbate 20 was added to a final concentration of 0.05%. The samples were stored in a refrigerator at 2°C–8°C prior to performing a peptide mapping sequence variant analysis.
Enzymatic digestion of rhumAbs.
Antibody samples were denatured and reduced by mixing 50 μL of rhumAb sample (20 mg/mL) with 20 μL DTT (1 M in Milli Q water) and 950 μL of the reduction and S-carboxymethylation (RCM) buffer (6 M guanidine hydrochloride, 360 mM Tris and 2 mM EDTA, pH 8.6). The reduction was carried out at 37°C for 1 hour. The reduced samples were cooled to room temperature and subsequently alkylated by adding 50 μL freshly prepared alkylation reagent (1 M sodium iodoacetate). The alkylation process was carried out at room temperature in the dark for 15 minutes. DTT (10 μL) was then added to stop the alkylation.
The reduced and carboxymethylated antibody samples were buffer exchanged into the digestion buffer (25 mM Tris-HCl, 2 mM CaCl2, pH 8.2) using a Sephadex G-25M PD-10 column (GE Healthcare Bio-Sciences AB, Uppsala, Sweden). For trypsin digestion, the samples were digested with an enzyme to substrate ratio of 1:50 (weight to weight ratio) at 37°C for 5 hours. For chymotrypsin digestion, the sample was digested with an enzyme to substrate ratio of 1:100 at room temperature for 2.5 hours. The digestion was stopped by adding trifluoroacetic acid (TFA) to a final concentration of 0.3%.
Tryptic and chymotryptic peptide mapping.
Optimization of the peptide mapping methods was carried out on an online-coupled LC-MS/MS workstation employing an Agilent 1200 HPLC system (Santa Clara, CA, USA) and a Thermo Fisher LTQ linear ion trap mass spectrometer (San Jose, CA, USA).
HPLC.
The column and HPLC conditions, except the elution gradient and sample injection volume, that were used for separating the tryptic and chymotryptic peptide digests were the same as previously published.Citation21 An optimized 166-minute step gradient was used as follows (minute/%B): 0/0, 3/0, 23/10, 160/40, 162/95, 165/95, 166/0. The total HPLC run time was 190 minutes. The sample injection volume was 100 μL (∼35 μg of digested protein).
Tandem mass spectrometry.
The effluent from the HPLC was infused directly through a fused silica capillary to the LTQ ESI-MS operating in a positive ion mode with a mass scan range of mass-to-charge ratio (m/z) 300–2000. For the MS/MS product ion scan, the activation type was collision-induced dissociation (CID), the normalized collision energy was 30, and the activation time was 30 ms. An 11-scan-event LTQ MS method consists of a full MS survey scan event followed by five cycles of a data-dependent zoom scan, and a MS/MS scan on the top five most intense ions. The dynamic exclusion (DE) function was enabled to reduce data redundancy and allow low-intensity ions to be selected for data dependent scans. The optimized DE parameters were as follows: a repeat duration of 30 seconds, an exclusion list size of 500, an exclusion duration of 300 seconds, a low exclusion mass width 0.80, a high exclusion mass width of 2.20, and a repeat count of 3. Optimization of mass spectral acquisition methods is further discussed in the results and discussion section.
Mass spectra data analysis and mascot-ETS.
All acquired MS and MS/MS data were submitted to a Mascot search engine (version 2.1.6, Matrix Science, London, UK) and run against an in-house protein database that contained protein sequences for all of the rhumAbs used in this study. Peptide identification was achieved using a Mascot algorithm by comparing acquired mass spectral data with theoretical parent and fragment ions. The following parameters were used in a Mascot first-pass matching search: a peptide tolerance of 1,000 ppm, an MS/MS tolerance of 0.8 Da, a maximum missed cleavage of 1, a carboxymethylation as the fixed protein modification, methionine oxidation and glycosylation (G0) on asparagine as the variable modification, fully tryptic as cleavage specificity for tryptic digestion, and no enzyme cleavage specificity for chymotryptic digestion. The probability based Mowse score was set for ≥25 for a significant match.
The unmatched MS/MS data were submitted for the second-pass ETS. All possible sequence variations resulting from single nucleotide substitutions are evaluated to match the MS/MS data by Mascot-ETS. A list of potential sequence variants based on an ETS is then generated. Manual investigation of the MS and MS/MS raw data for expected and variant peptides was performed to eliminate false positives.
Estimating the relative percentages of sequence variants.
If a variant peptide is completely separated from others, its UV absorbance signal is integrated and compared with the peak area of its expected peptide counterpart to estimate the relative percentage. If a variant peptide is co-eluting with other peptides or if the UV signal is too weak to be accurately integrated, the EIC is used to estimate relative abundance by manual integration using Xcalibur QualBrower (Version 2.0.5, Thermo Fisher, San Jose, CA, USA). The relative percentage of a sequence variant was estimated by dividing the peak area of the variant peptide peak by the sum of the peak areas for the parent and variant peptide peaks based on their EICs.
Abbreviations
| rhumAb | = | recombinant humanized monoclonal antibody |
| CHO | = | Chinese hamster ovary |
| HPLC-UV/MS/MS | = | high performance liquid chromatography with ultraviolet spectrophotometer and tandem mass spectrometry detection |
| SNP | = | single-nucleotide polymorphism |
| ETS | = | error-tolerant search |
| DE | = | dynamic exclusion |
| PTM | = | post-translational modification |
| EIC | = | extracted ion chromatogramsand |
Figures and Tables
Figure 1 Full view of the HPLC-UV peptide maps of rhumAb HER2 and rhumAb A. (A) Tryptic map of rhumAb HER2; (B) Tryptic map of rhumAb A; (C) Chymotryptic map of rhumAb HER2; and (D) Chymotryptic map of rhumAb A.
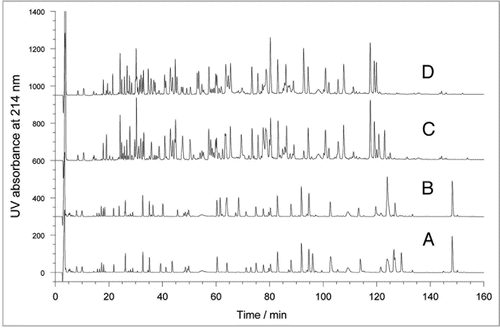
Figure 2 Partial region of the tryptic peptide maps of the model samples (3 to 60 minutes). (A) rhumAb A as the control; (B) 0.5% rhumAb HER2 in rhumAb A; (C) 1% rhumAb HER2 in rhumAb A; (D) 3% rhumAb HER2 in rhumAb A; and (E) 5% rhumAb HER2 in rhumAb A.
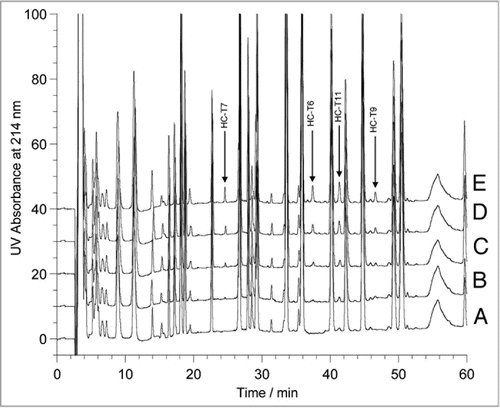
Figure 3 Estimation of the relative percentage of variant rhumAb HER2 in rhumAb A based on the peak area percentages of ultraviolet (UV) and extracted ion chromatogram (EIC) signals of rhumAb HER2 peptides HC-T10 (A) and HC-T11 (B) relative to their corresponding rhumAb A peptides.
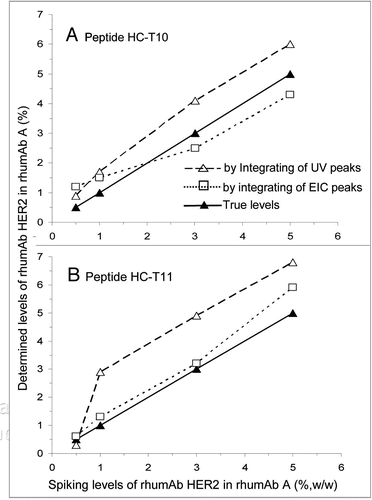
Figure 4 Comparison of tryptic (A and B) and chymotryptic (C) peptide maps of rhumAb B materials derived from the top four clones: #3, #6, #104 and #11, in the specific regions. The peptide peak labeled as P2 in (B) is identified to be an expected peptide with sequence of TPEVTCVVVDVSHEDP EVK, P2 was named after N2 to imply they are related.
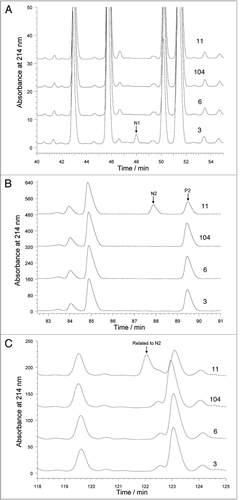
Figure 5 MS/MS spectrum of the variant peptide NTLYLQR of rhumAb B from clone #3.
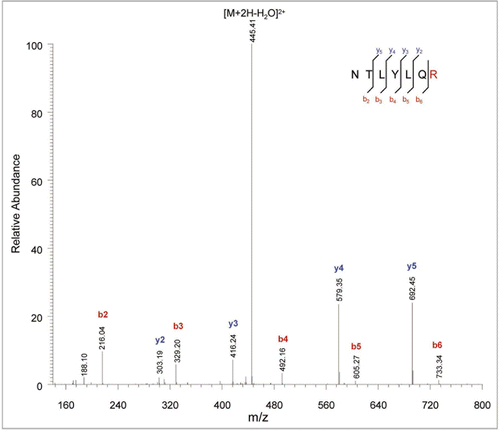
Figure 6 MS/MS spectra of the variant peptide (A) and the expected peptide (B) of rhumAb B from clone #11.
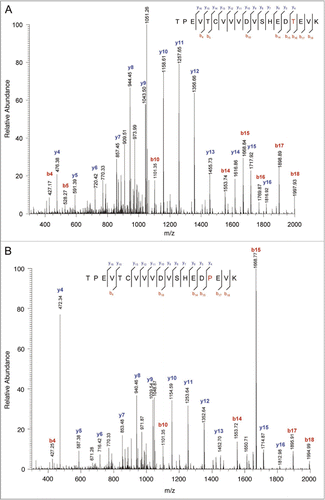
Figure 7 MS/MS spectra of the variant peptide (A) and the expected peptide (B) of rhumAb C from clone #110.
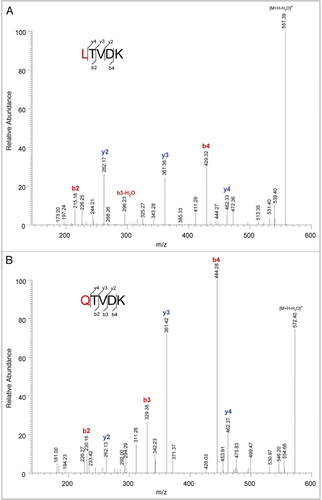
Table 1 HPLC-UV/MS/MS characterization of distinct tryptic peptides of rhumAb HER2 with sequences different than those of rhumAb A
Table 2 Manual assessment of the Mascot-ETETS results of rhumAb C clone #110
Acknowledgements
The authors thank Reed Harris for insightful discussion and helpful background information on protein sequence variation. Christine Shields, Domingos Ng and Gargi Seth are acknowledged for providing us CHO clone samples. Armando Cordoba is acknowledged for his technical advice on experiment design to determine the sensitivity of peptide mapping. Helpful suggestions from John Briggs, John Battersby and Amy Que are appreciated. We also thank Julie Cheng for editing this manuscript.
References
- den Dunnen JT, Antonarakis SE. Mutation nomenclature extensions and suggestions to describe complex mutations: a discussion. Hum Mutat 2000; 15:7 - 12
- Lebkowski JS, DuBridge RB, Antell EA, Greisen KS, Calos MP. Transfected DNA is mutated in monkey, mouse and human cells. Mol Cell Biol 1984; 4:1951 - 1960
- Seetharam R, Heeren RA, Wong EY, Braford SR, Klein BK, Aykent S, et al. Mistranslation in IGF-1 during overexpression of the protein in Escherichia coli using a synthetic gene containing low frequency codons. Biochem Biophys Res Commun 1988; 155:518 - 523
- Forman MD, Stack RF, Masters PS, Hauer CR, Baxter SM. High level, context dependent misincorporation of lysine for arginine in Saccharomyces cerevisiae a1 homeodomain expressed in Escherichia coli. Protein Sci 1998; 7:500 - 503
- Lu HS, Fausset PR, Sotos LS, Clogston CL, Rohde MF, Stoney KS, et al. Isolation and characterization of three recombinant human granulocyte colony stimulating factor His→Gln isoforms produced in Escherichia coli. Protein Expr Purif 1993; 4:465 - 472
- Meng SY, Hui JO, Haniu M, Tsai LB. Analysis of translational termination of recombinant human methionyl-neurotrophin 3 in Escherichia coli. Biochem Biophy Res Commun 1995; 211:40 - 48
- McNulty DE, Claffee BA, Huddleston MJ, Kane JF. Mistranslational errors associated with the rare arginine codon CGG in Escherichia coli. Protein Expr and Purif 2003; 27:365 - 374
- Tsai LB, Lu HS, Kenney WC, Curless CC, Klein ML, Lai PH, et al. Control of misincorporation of de novo synthesized norleucine into recombinant interleukin-2 in E. coli. Biochem Biophys Res Commun 1988; 156:733 - 739
- Bogosian G, Violand BN, Dorward-King EJ, Workman WE, Jung PE, Kane JF. Biosynthesis and incorporation into protein of norleucine by Escherichia coli. J Biol Chem 1989; 264:531 - 539
- Apostol I, Levine J, Lippincott J, Leach J, Hess E, Glascock CB, et al. Incorporation of Norvaline at Leucine Positions in Recombinant Human Hemoglobin Expressed in Escherichia coli. J Biol Chem 1997; 272:28980 - 28988
- Ying H, Liu H. Identification of an alternative signal peptide cleavage site of mouse monoclonal antibodies by mass spectrometry. Immunol Lett 2007; 111:66 - 68
- Wen D, Vecchi MM, Gu S, Su L, Dolnikova J, Huang YM, et al. Discovery and investigation of misincorporation of serine at asparagine positions in recombinant proteins expressed in CHO cells. J Biol Chem 2009; 284:32686 - 32694
- Yu XC, Borisov OV, Alvarez M, Michels DA, Wang YJ, Ling V. Identification of codon-specific serine to asparagine mistranslation in recombinant monoclonal antibodies by high resolution mass spectrometry. Anal Chem 2009; 81:9282 - 9290
- Harris RJ, Murnane AA, Utter SL, Wagner KL, Cox ET, Polastri GD, et al. Assessing genetic heterogeneity in production cell lines: detection by peptide mapping of a low level Tyr to Gln sequence variant in a recombinant antibody. Nat Biotechnol 1993; 11:1293 - 1297
- Dorai H, Sauerwald T, Campbell A, Kyung YS, Goldstein J, Magill A, et al. Investigation of Product Microheterogeneity: A Case Study in Rapid Detection of Mutation in Mammalian Production Cell Lines. BioProcess Internat 2007; 5:66 - 75
- Wan M, Shiau FY, Gordon W, Wang GY. Variant antibody identification by peptide mapping. Biotechnol Bioeng 1999; 62:485 - 488
- Ahrera K, Jungbauer A. Chromatographic and electrophoretic characterization of protein variants. J Chromatogr B 2006; 841:110 - 122
- Wade Y. R J. In Protein and Peptide Analysis by Mass Spectrometry 1996; 61:Totowa NJ Chapman Humana Press Inc., 101 - 113
- Gatlin CL, Eng JK, Cross ST, Detter JC, Yates JR III. Automated Identification of Amino Acid Sequence Variations in Proteins by HPLC/Microspray Tandem Mass Spectrometry. Anal Chem 2000; 72:757 - 763
- Creasy DM, Cottrell JS. Error tolerant searching of uninterpreted tandem mass spectrometry data. Proteomics 2002; 2:1426 - 1434
- Zhang B, Yang Y, Yuk I, Pai R, McKay P, Eigenbrot C, et al. Unveiling a glycation hot spot in a recombinant humanized monoclonal antibody. Anal Chem 2008; 80:2379 - 2390
- Flavell R, Huse M, Goger M, Zedlitz M, Kuriyan J, Muir T. Efficient semisynthesis of a tetraphosphorylated analogue of the Type I TGFbeta receptor. Org Lett 2002; 4:165 - 168
- Vaisar T, Urban J. Probing Proline Effect in CID of Protonated Peptides. J Mass Spectrom 1996; 31:1185 - 1187
- Paizs B, Suhai1 S. Fragmentation pathways of protonated peptides. Mass Spectrom Rev 2005; 24:508 - 548
- Timofeev O, Zhub M, Gross M. Information for proteomics: ESI-MS titration by sodium ions gives the number of carboxylate groups in peptides. Internat J Mass Spectrom 2005; 231:113 - 117
- Krokhin O, Antonovici M, Ens W, Wilkins J, Standing K. Deamidation of—Asn-Gly—sequences during sample preparation for proteomics: consequences for MALDI and HPLC-MALDI analysis. Anal Chem 2006; 78:6645 - 6650
- Jefferies R, Lefranc M-P. Human immunoglobulin allotypes: Possible implications for immunogenicity. mAbs 2009; 1:332 - 338
- Carter P, Presta L, Gorman CM, Ridgway JB, Henner D, Wong WL, et al. Humanization of an anti-p185Her2 antibody for human cancer therapy. Proc Natl Acad Sci USA 1992; 89:4285 - 4289
- Olsen JV, Ong SE, Mann M. Trypsin Cleaves Exclusively C-terminal to Arginine and Lysine Residues. Mol Cell Proteomics 2004; 3:608 - 614
- Chelius D, Xiao G, Nichols AC, Vizel A, He B, Dillon TM, et al. Automated tryptic digestion procedure for HPLC/MS/MS peptide mapping of immunoglobulin gamma antibodies in pharmaceutics. J Pharm Biomed Anal 2008; 47:285 - 294
- Onisko B, Dynin I, Requena JR, Silva CJ, Erickson M, Carter JM. Mass spectrometric detection of attomole amounts of the prion protein by nanoLC/MS/MS. J Am Soc Mass Spectrom 2007; 18:1070 - 1079