Abstract
Automation robots have recently come to the market as an alternative for manual compounding of drugs for intravenous administration. Our aim was to assess whether robotic compounding can be performed with monoclonal antibodies (mAbs) without influencing the aggregation state of the proteins. Three frequently used mAbs were studied: infliximab (Remicade®, Janssen Biotech) and trastuzumab (Herceptin®, Roche) in lyophilised form, and bevacizumab (Avastin®, Roche) as a liquid formulation stored at 2°C to 8°C. The effects of different procedures to prepare the patient doses on antibody aggregation were evaluated. Remicade® and Herceptin® were reconstituted both manually and by a robotic arm (i.v.STATION®, Health Robotics). Additionally, the influence of vigorous shaking during reconstitution was investigated. The effects of rapid aspiration and dispensing on antibody aggregation were investigated for all three mAbs. Aggregation state was assessed by UV-Vis absorbance, 90° light scatter, fluorescence spectroscopy, Nile red fluorescence microscopy, and field flow fractionation without cross and focus flow. Robotic reconstituted samples showed similar findings compared with manual reconstitution if performed exactly according to the summary of product characteristics (SPC). Vials that were vigorously shaken showed a significant increase in aggregates. Similarly, rapid aspiration/dispense cycles resulted in a strong increase in the number and sizes of aggregates for all three mAbs; this result was observed after just one rapid aspiration/dispense cycle. Our study showed that robotic compounding of mAbs is feasible if the robot is exactly programmed according to the SPC, indicating that robotic compounding can be used to achieve reproducible high-quality compounding for delicate formulations.
Introduction
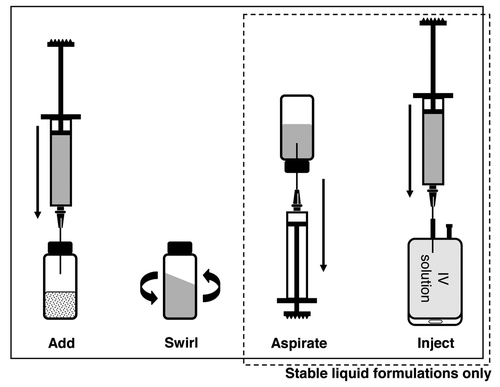
Pharmacy technicians and nurses traditionally compound drugs for intravenous (IV) administration manually. Compounding of IV patient doses involves the process of dissolving the drug for administration to a patient and/or diluting or mixing the drug with an infusion solution used as a vehicle for the purpose of administering it. Partially and fully automated robots have recently come to the market as a safe, efficient, and cost-effective alternative for manual compounding of drugs for IV administration. Robotic methods have so far been focused on rapid and time-saving procedures. Rapid procedures, however, might harm delicate substances such as monoclonal antibodies (mAbs). Many summary of product characteristics (SPCs) of mAbs state that they require gentle swirling to aid reconstitution (, step 1 and 2, dissolving a lyophilized powder) and that drawing into a syringe should be performed slowly.Citation1,Citation2 If the reconstitution procedure is not performed properly, foaming and formation of protein aggregates may occur.Citation3 Aggregates have been associated with immune reactionsCitation4 and foam might hamper drawing correct volumes into a syringe. The standard process of compounding mAbs for IV administration is illustrated in .
Figure 1. Compounding of ready to administer infusion of mAbs.
The aim of the study presented here was to assess whether a fully automated robotic procedure can achieve similar quality compared with manual compounding of mAbs. Analyses were performed using new orthogonal techniques able to detect small differences in aggregation state of protein formulations. These analytical methods were previously used to identify aggregate formation in trastuzumab (Herceptin®) after dilution into infusion bags containing 5% dextrose instead of the recommended 0.9% sodium chloride.Citation3
Results
Swirling protocol development
Based on video recordings of manual solubilization of lyophilized mAbs in our hospital cleanroom facility, four different principal robotic movements were programmed: (1) linear, (2) arch, (3) cone, and (4) circle movement (). The cone movement was found to simulate the manual swirling movement best. The arch movement was introduced to moisturize the entire inside of the vial. To ensure smooth gentle movements, the acceleration/deceleration speed and delays were optimized for each principal movement. Next, different protocols were applied to commercial, unexpired Herceptin® and Remicade® vials (). For Remicade®, robotic solubilization with two arches, ten cones and two arches resulted reproducibly in a clear homogenous solution. Protocols with fewer movements resulted in solutions that did not appear to be homogenous: strands of putatively more concentrated solution were visible upon additional manual swirling. In one vial, we observed a ~1 x 1 mm clump of material attached to the rubber stopper that was dissolved after additional arch movements. Visual inspection of Herceptin® vials also showed good solubilization of the product with a program of two arches, ten cones, and two arches.
Figure 2. Robotic arm principal movements.
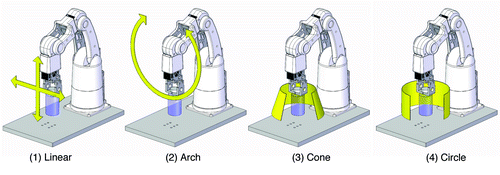
Table 1. Results of testing the swirling protocol with Remicade® and Herceptin®
Characterization of aggregation states of Remicade® and Herceptin® using three solubilization procedures
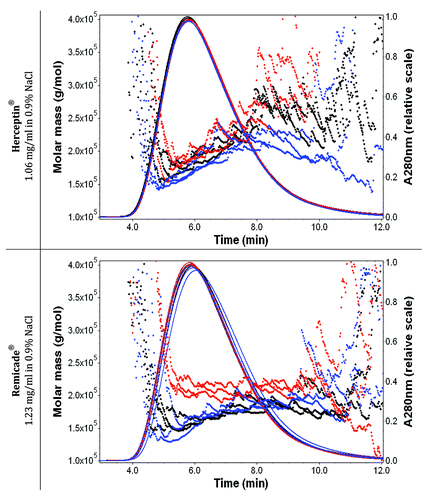
Three vials of Remicade® and three vials of Herceptin® were solubilized manually, three vials of both were solubilized by the final robotic protocol and one vial of each drug was solubilized in a worst-case scenario. All 14 vials were analyzed by absorbance and fluorescence spectroscopy, fluorescence microscopy and field flow fractionation (FFF). The results are presented in and . The worst-case scenario (procedure III, red line) showed changes in the aggregation state for both drugs as determined by an increase in the UV-Vis absorbance, increase in 90° light-scatter intensity and significant increase in the number of particles by Nile Red fluorescence microscopy (). The local tryptophan (Trp) environment was the same for all three solubilization procedures, indicating that the conformation of the formed aggregates in the worst-case scenario was similar to the conformation of the monomer. The particles observed by Nile Red fluorescence microscopy were measured between 1 and 2 h after solubilization. The particles were still present after storage for one day at 2°C to 8°C as measured by fluorescence microscopy with Nile Red staining. FFF without separation showed an increase in the molar mass with procedure III. For the FFF measurements, the mAb samples were diluted in 0.9% NaCl to a concentration of ~1 mg/ml. Aggregation in Remicade® was slightly higher compared with Herceptin®; Remicade® was more turbid (, stronger UV-Vis absorbance), scattered more light at 90° (), contained more particles by fluorescence microscopy with Nile Red staining () and contained particles with a higher molar mass by FFF without separation (). The FFF elution peak for Remicade® was between 150 kDa to 160 kDa for procedure I and II and increased to 200–220 kDa when procedure III was used (). No aggregation was detected by all analytical methods for the vials reconstituted by manual solubilization procedures according to the SPC and by the automated method using the robotic system.
Figure 3. UV-Vis absorbance (A), 90° light-scattering (B), intrinsic fluorescence emission (C) and Nile red fluorescence microscopy as particles/ml (D) of Herceptin® and Remicade® solubilized using different procedures. Black, recommended manual procedure (I); blue, robotic procedure (II); red, recommended manual procedure with strong shaking (III); gray, placebo solution.
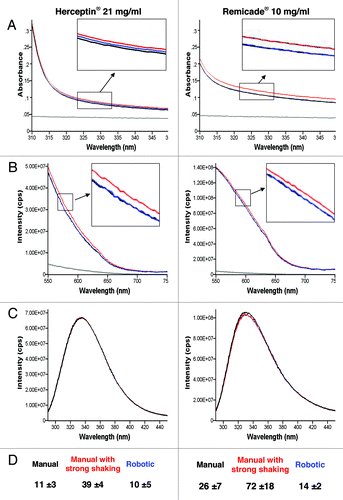
Figure 4. Effect of the solubilization procedure on the molar mass vs. time graphs with UV signals at 280 nm (solid lines) of Herceptin® (1.06 mg/ml mAb in 0.9% sodium chloride) and Remicade® (1.23 mg/ml mAb in 0.9% sodium chloride) with 0.9% sodium chloride in water and 200 ppm NaN3 as running buffer. Ten μl of each protein sample were injected three times. The antibody solutions were diluted with 0.9% sodium chloride just before the FFF measurements. Black: recommended manual procedure (I); blue: robotic procedure (II) and red: recommended manual procedure with strong shaking (III).
Characterization of aggregation states of Avastin®, Remicade® and Herceptin® after being stressed by rapidly aspirating and dispensing the solutions using a syringe
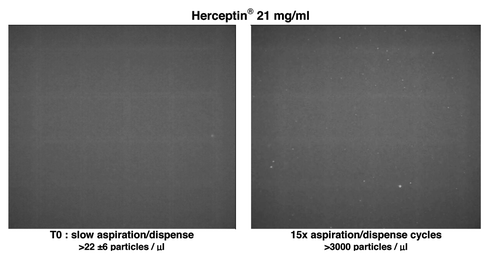
For all three mAbs under study, increasing numbers of aggregates were observed with increasing numbers of aspiration/dispense (AD) cycles (1, 5 and 15×). Already one rapid AD cycle resulted in a significant increase in aggregates of Remicade®, Herceptin® and Avastin® ( and ); more particles (between 42 to 50 per micro liter) were observed by Nile Red fluorescence microscopy after one AD cycle compared with t = 0 (between 4 to 22 per μl). shows the Nile red fluorescence microscopy result of Herceptin® solution before and after stress of the solution by 15 aspiration-dispense cycles. Avastin® showed no changes in its aggregation state after one AD cycle with the other measurements. More aggregates were formed after one AD cycle in Herceptin® than in Remicade® as measured by a stronger increase in the UV-Vis absorbance intensity, stronger 90° light-scatter intensity, increase and 1 nm shift in fluorescence emission. For Remicade®, the intrinsic fluorescence decreased after one AD cycle and subsequently increased after 5× and 15×, indicating that the average local Trp environment within Remicade® was first more exposed to water, followed by a more hydrophobic environment with the appearance of many aggregates. In Herceptin®, the intrinsic fluorescence increased with each AD cycle, indicating that the Trp became more buried and less exposed to water. The UV-Vis absorbance background scatter between 320 nm and 350 is caused by a mixture of Mie, Thompson and Rayleigh-scatter, indicating the formation of both large and small aggregates. Quantification of the molecular weight of antibody associates/aggregates present in solutions was obtained by using FFF without cross-flow and focus-flow. The FFF chromatograms for non–stressed samples showed that the three mAb solutions consisted of a majority of particles with molar masses similar to those of the monomer. The FFF analyses showed a significant increase in molar mass after one AD cycle for Herceptin® whereas this increase was not observed for Remicade®. The 5× and 15× AD cycles resulted in larger changes in the spectroscopic, light-scatter and microscopy, which indicated formation of more aggregates for all mAb samples.
Figure 5. UV-Vis absorbance (A), 90° light-scattering (B), intrinsic fluorescence emission (C), and Nile red fluorescence microscopy as particles/ml (D) of Herceptin®, Remicade® and Avastin® solutions (samples solubilized as the recommended procedure) and after stress of the solution by aspiration-dispense through a 18G 2” 1.2 × 50 mm needle. Black, Time 0; blue, after 1× aspiration/dispense; green, after 5× aspiration/dispense; red, after 15× aspiration/dispense.
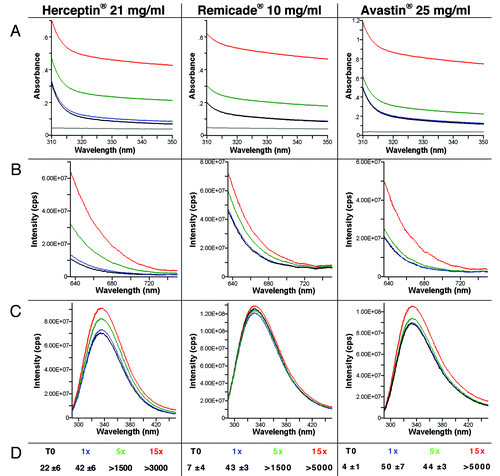
Figure 6. Effect of aspiration-dispense cycles on the molar mass (linear scale) vs. time graphs with UV signals at 280 nm (solid lines) of Herceptin® (1.06 mg/ml mAb in 0.9% sodium chloride), Remicade® (1.23 mg/ml mAb in 0.9% sodium chloride) and Avastin® (1.33 mg/ml mAb in 0.9% sodium chloride) with 0.9% sodium chloride in water and 200 ppm NaN3 as running buffer. Ten μl of each protein sample were injected once. The antibody solutions were stressed and then diluted with 0.9% sodium chloride just before the FFF measurements. Black, Time 0; blue, after 1× aspiration/dispense; green, after 5× aspiration/dispense; red, after 15× aspiration/dispense.
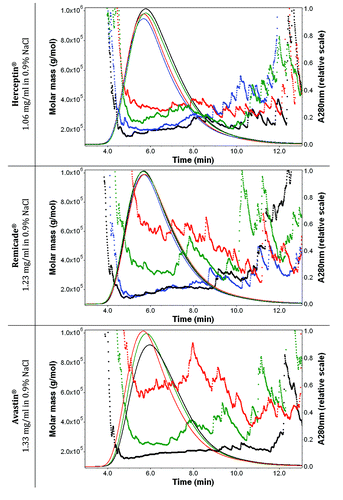
Figure 7. Effect of aspiration dispense cycles. Nile red fluorescence microscopy of Herceptin® solution (sample solubilized as the recommended procedure) before and after stress of the solution by aspiration-dispense through a 18G 2” 1.2 × 50 mm needle.
Discussion
The present study was initiated by the Clinical Pharmacy department of the St. Antonius Hospital, Nieuwegein, the Netherlands, with the aim of evaluating the use of a fully automated robotic solution in the compounding of mAb infusions. Avastin®, Remicade®, and Herceptin®, three frequently used mAbs, were tested. Remicade® and Herceptin® were both in lyophilized form, whereas Avastin® was a liquid formulation.
The data presented here show that robotic compounding of mAbs is feasible and robust, and it can provide similar quality as manual compounding. Manual reconstitution in a vigorous way, a process that deviated from the prescribed method in the SPC, induced protein aggregation in the two lyophilized mAbs confirming why it is important that instructions from the SPC are strictly followed. The same is applicable to drawing the solution in a syringe, a process that resulted in increased protein aggregation when performed too rapidly for all three mAbs under study.
Although clear guidelines exist regarding the maximum number of small particles that may be present in pharmaceutical preparations, the levels for soluble aggregates are not well defined.Citation5 There are several reasons why it is preferable to have infusion solutions with fewer large aggregates. First, many mAbs are administered through a 0.2 μm in-filter that prevents infusion of large aggregates. A high percentage of large aggregates will thus reduce the effective dose. Second, it is known that aggregates may cause immune reactions (formation of antibodies).Citation4,Citation6 Finally, aggregation is undesirable because small aggregates may grow in time to larger aggregates. Especially highly concentrated solutions are at increased risk of protein aggregation.
During the development of biotechnological drugs, many challenges must be overcome to obtain a robust formulation with a low risk of protein aggregation.Citation7 Biopharmaceuticals often have very detailed instructions on how to solubilize the lyophilized powder, and how to draw and administer the dose. For example, the SPC of Herceptin® states that: (1) the stream of the diluent should be directed into the lyophilized cake; (2) the vial should be swirled gently without shaking; (3) the vial should stand for five minutes undisturbed before being further processed and (4) that drawing into a syringe should be performed slowly.Citation2 Similar instructions are included in the SPC of Remicade®.Citation1 These statements are included in the SPCs because they are important to obtain quality patient doses and every person involved in the compounding of these drugs should follow these procedures. Our results show that protein aggregation can occur if steps (2) and (4) are not followed correctly ( and ).
To our knowledge, this study is the first to show that it is feasible to program a robotic arm to perform the process of reconstitution of therapeutic mAbs exactly as described in the SPC. The increased reproducibility made possible by eliminating the human factor provides additional value for robotic over manual reconstitution of mAbs. It is possible that time constraints and differences in experience and education of medical personnel affect whether SPC instructions are followed exactly, which can impair the quality of the compounding of mAb infusions. A robot can be programmed to perform complex procedures (e.g., the right angle to add the water onto the lyophilized cake, the right drawing and swirling speed, and settling time) for each individual mAb product.
We observed that aggregates that were formed after stressing the mAb solutions were stable over the one-day time period investigated. After storage at 2°C to 8°C for 24 h, the mAb samples still contained aggregates that could be visualized by fluorescence microscopy with Nile Red staining. The FFF analysis was performed after more than 15 min after dilution of the concentration mAb solutions in 0.9% NaCl. After this dilution the mAb aggregates formed by shaking could be measured indicating that dilution in 0.9% NaCl did not solubilize the aggregates in conditions similar to that occurring in clinics where mAbs are added to an infusion bag prior to administration. This suggests that, in a clinical setting, aggregates might be administered to patients if inappropriate compounding is performed.
The strength of the present study consists in the use of: (1) authorized products manipulated in settings similar to routine practice in hospital pharmacies and compared with scenarios that reflect inappropriate handling; and (2) five sensitive orthogonal analytical methods that permitted the detection of small changes in aggregation states as the samples after stress were still clear by eye.
There are numerous mAbs available on the market and many more are expected to be approved in the future.Citation8 Our study showed that appropriate drawing into a syringe requires special attention and that fully-automated robots that allow reconstitution of lyophilized mAbs can achieve very reproducible high-quality compounding for these delicate biotechnology drugs.
Materials and Methods
Robot and swirling protocol definition
The robot selected for the study was the i.v.STATION® of Health Robotics SRL (www.health-robotics.com). The robot includes a robotic arm that has seven joints that mimic all hand wrist movements. Programmable movement characteristics include starting position, angles, movement acceleration/deceleration, movement speed, time/number of repetitions and movement delay. All experiments were performed by the i.v.STATION® companion robot, a smaller stand-alone robotic arm able to make exactly the same movements in 3D space compared with the robotic arm installed in the i.v.STATION®. The movements of the companion robot can be transferred one-to-one to the i.v.STATION® validated by objective measurements of kinematics and dynamics.
For both Remicade® and Herceptin®, manual reconstitutions were first video-recorded. Next, specific swirling protocols that were visually identical to the manual hand movements were programmed. A minimum of (shear) stress was pursued by visual inspection of drug glass vials filled with 10 ml of water. Subsequently, before proceeding to the final experiment, the result of the programmed protocol was ascertained by visual inspection (e.g., presence of clumps, wetting inside vial, foam, solution) using vials containing drug substance.
Procedures to solubilize Remicade® and Herceptin®
For Remicade® and Herceptin®, three scenarios were compared: manual reconstitution according to the SPC (procedure I), robotic reconstitution in analogy with the manual procedure (procedure II), and a worst-case scenario (procedure III). Analyses of all samples were performed in the laboratories of Therapeomic Inc.
For Remicade® (7 vials) and Herceptin® (7 vials), 10 and 7.2 ml of MilliQ water, respectively, was added manually. After adding the MilliQ water, the following methods of solubilization were applied: (1) gentle manual swirling (3 vials), (2) the defined robotic swirling procedure (3 vials), and (3) vigorously shaking (1 vial; approximately 3 vertical shakes/second during 10 sec). Three technicians performed the manual swirling. The final concentration was 10 mg/ml for Remicade® and 21 mg/ml for Herceptin®.
Application of stress by aspiration and dispense of Avastin®, Remicade® and Herceptin® through a syringe
All mAbs under study (Avastin® directly, and Remicade® and Herceptin® after solubilization of the lyophilized powder) require drawing into a syringe before they can be added to an infusion bag (final container). To study the effect of aspiration and dispensing on the aggregation state of the mAbs, 1 ml of Remicade®, 1 ml of Herceptin® (both after robotic reconstitution) and 1 ml of Avastin® were each aspirated and dispensed one, five and 15 times rapidly through a Becton, Dickinson and Company Microlance 3 18G 2” 1.2 × 50 mm needle using a 20 ml B. Braun Omnifix syringe. A syringe of 20 ml was used, as in case of many patients the robotic system would need to aspirate multiple vials consecutively into one syringe. One rapid aspiration/dispense cycle took 4 sec and resulted during both aspiration and dispense in formation of small amounts of foam and bubbling.
Analytical methods
All samples were analyzed by different techniques within 4 h after preparation of the samples. The spectroscopic (absorbance and fluorescence), 90° light-scatter, microscopic measurements were performed on the reconstituted mAb solutions without additional sample treatment. The field-flow fractionation method was used to characterize the aggregation properties of the mAb samples after dilution with 0.9% NaCl simulating the concentration in the final infusion. These methods are briefly summarized in and the experimental settings are described below.
Table 2. Comparative table of the analytical techniques presented in this paper
UV-VIS absorbance spectroscopy
UV-Vis absorbance spectra were measured at 25°C with a double beam, two monochromators Cary 300 Bio spectrophotometer from Varian. The UV-Vis absorbance measurements were performed in a 0.4 cm by 1 cm quartz cuvettes from Hellma. The spectra were recorded between 310 and 350 nm using a path length of 1.0 cm to investigate the turbidity of the high concentrated mAb solutions.
90° light-scattering
90° light-scattering spectra were monitored at 25°C using a FluoroMax spectrofluorimeter (Spex, Instruments S.A., Inc.) by running a synchronous scan (λem = λex) between 550 nm and 750 nm with an integration time of 0.01 sec. The measurements were performed in 2 mm by 1 cm 400 µl quartz micro cuvette from Hellma. The 2 mm face of the cuvette was placed at the excitation side. The slits settings were optimized for each mAb. The 90° light-scattering spectral method has been previously described.Citation9,Citation10
Fluorescence spectroscopy
The steady-state fluorescence emission measurements were performed with a Fluoromax spectrofluorimeter (Spec) at 25°C in a thermostated cuvette holder. The mAbs were placed in a 2 mm by 1 cm 400 µl quartz micro cuvette from Hellma. The 2 mm face of the cuvette was placed at the excitation side. The intrinsic fluorescence spectra were recorded using an excitation wavelength of 280 nm and an integration time of 0.01 sec. The slits settings were optimized for each mAb. Bleaching or quenching of the samples did not occur.
Fluorescence microscopy with Nile Red staining
The Herceptin®, Remicade® and Avastin® solutions were stained with 1 µM Nile Red from an ethanol stock solution. Immediately after addition of Nile Red, the mAb samples were placed on FastRead 102® Counting Slides from Immune Systems and observed by fluorescence microscopy. These slides have a fixed distance of 0.1 mm between the slide and the cover glass. Counting of particles is performed using the 4 × 4 grids present in each chamber of the slide. The size of the 4 × 4 grid corresponds to 1 mm × 1 mm and 0.1 μl volume. The microscopy observations were performed on a Leica DM RXE microscope (Leica Microsystems GmbH) equipped with a mercury lamp and a bandpass filter for specific excitation of Nile Red. The images were acquired with a Sony NEX-5 camera and its firmware. The objectives were 10×, 20× and 40×. The Nile Red staining method was developed by our group to visualize protein aggregates; the lower size limit of the aggregates is 0.5 μm.Citation11
Field flow fractionation without application of cross-flow and focus-flow
For FFF measurements, all samples were prepared by diluting a standard patient dose with 250 ml 0.9% sodium chloride. A 70 kg patient was taken as the standard, and so the doses were 280 mg for Herceptin® ( = 13.3 ml of 21 mg/ml), 350 mg for Remicade® (35 ml of 10 mg/ml) and 350 mg for Avastin® (14 ml of 25 mg/ml). The dilutions resulted in final sample concentrations of 1.06, 1.23, and 1.33 mg/ml for Herceptin®, Remicade®, and Avastin®, respectively. Of each diluted sample, 10 μl was injected in the trapezoidal separation chamber, 15.3 cm in length and 350 μm in height, connected to Eclipse 3 system (Wyatt Technologies Europe GmbH). The bottom of the separation channel consisted of a porous frit covered with a polyethersulfone (PES) ultrafiltration membrane type PM UP010 (Microdyn-Nadir GmbH). 0.9% sodium chloride with 200 ppm NaN3 in water was used as running buffer.
FFF without separation is a gentle method that does not inflict additional stress on the proteinCitation12 because neither focus flow nor cross flow are applied inside the separation chamber. Using this method, the sample elutes with the main flow VM between approximately 4 and 12 min after the start of the injection. The three therapeutic mAbs were characterized by FFF without separation by using the program shown in .
Table 3. Field flow fractionation method for characterization of Avastin®, Remicade® and Herceptin® after dilution into the infusion bag
Molar mass of the proteins leaving the channel were determined with an in-line UV detector (Agilent Technologies) followed by a Dawn Heleos II multi-angle light scattering instrument (Wyatt Technologies Europe GmbH) and an in-line refractometer (Agilent Technologies). The Agilent instruments were controlled with the ChemStation for LC systems software, Rev. B03.01-SR1 (Agilent Technologies). Data analysis was performed with the Astra software, version 5.3.4.20 (Wyatt Technologies Europe GmbH), using a dn/dc value of 0.185 and a second virial coefficient of 1⋅10−4. The UV absorbance was measured at 280 nm.
| Abbreviations: | ||
| AD | = | aspiration dispense |
| FFF | = | field flow fractionation |
| IV | = | intravenous |
| mAb | = | monoclonal antibody |
| mAbs | = | monoclonal antibodies |
| PES | = | polyethersulfone |
| SPC | = | summary of product characteristics |
Acknowledgments
Karine Luet, Caroline Palais and Emilie Poirier of Therapeomic Inc. are greatly acknowledged for their help with performing the laboratory analyses. We thank Roche Netherlands BV for providing the necessary materials for in vitro testing.
Disclosure of Potential Conflicts of Interest
All authors and Therapeomic have no conflicts of interest nor financial interests with the outcome and results of the manuscript.
Related Research Data
References
- Remicade Summary of Product Characteristics. . www.ema.europa.eu/docs/en_GB/document_library/EPAR_-_Product_Information/human/000240/WC500050888.pdf
- Herceptin Summary of Product Characteristics. . www.ema.europa.eu/docs/en_GB/document_library/EPAR_-_Product_Information/human/000278/WC500074922.pdf
- Demeule B, Palais C, Machaidze G, Gurny R, Arvinte T. New methods allowing the detection of protein aggregates: a case study on trastuzumab. MAbs 2009; 1:142 - 50; http://dx.doi.org/10.4161/mabs.1.2.7632; PMID: 20061815
- Hermeling S, Crommelin DJ, Schellekens H, Jiskoot W. Structure-immunogenicity relationships of therapeutic proteins. Pharm Res 2004; 21:897 - 903; http://dx.doi.org/10.1023/B:PHAM.0000029275.41323.a6; PMID: 15212151
- US pharmacopeia. USP/NF general chapter particulate matter in injections. in: U.S. pharmacopeia, ed. national formulary, USP29-NF-24 (suppl 2) USP; 2006.
- Cromwell ME, Hilario E, Jacobson F. Protein aggregation and bioprocessing. AAPS J 2006; 8:E572 - 9; http://dx.doi.org/10.1208/aapsj080366; PMID: 17025275
- Lowe D, Dudgeon K, Rouet R, Schofield P, Jermutus L, Christ D. Aggregation, stability, and formulation of human antibody therapeutics. Adv Protein Chem Struct Biol 2011; 84:41 - 61; http://dx.doi.org/10.1016/B978-0-12-386483-3.00004-5; PMID: 21846562
- Nelson AL, Dhimolea E, Reichert JM. Development trends for human monoclonal antibody therapeutics. Nat Rev Drug Discov 2010; 9:767 - 74; http://dx.doi.org/10.1038/nrd3229; PMID: 20811384
- Capelle MA, Brügger P, Arvinte T. Spectroscopic characterization of antibodies adsorbed to aluminium adjuvants: correlation with antibody vaccine immunogenicity. Vaccine 2005; 23:1686 - 94; http://dx.doi.org/10.1016/j.vaccine.2004.09.031; PMID: 15705473
- Demeule B, Lawrence MJ, Drake AF, Gurny R, Arvinte T. Characterization of protein aggregation: the case of a therapeutic immunoglobulin. Biochim Biophys Acta 2007; 1774:146 - 53; http://dx.doi.org/10.1016/j.bbapap.2006.10.010; PMID: 17142116
- Demeule B, Gurny R, Arvinte T. Detection and characterization of protein aggregates by fluorescence microscopy. Int J Pharm 2007; 329:37 - 45; http://dx.doi.org/10.1016/j.ijpharm.2006.08.024; PMID: 17005340
- Palais C, Capelle M, Arvinte T. Studies of loose protein aggregates by flow field-flow fractionation (FFF) coupled to multi-angle laser light scattering (MALLS). In: Kim S, Williams R, Caldwell KD, eds. Field-Flow Fractionation in Biopolymer Analysis: Springer, 2012:103-112.