
 ?Mathematical formulae have been encoded as MathML and are displayed in this HTML version using MathJax in order to improve their display. Uncheck the box to turn MathJax off. This feature requires Javascript. Click on a formula to zoom.
Abstract
The objectives of this retrospective analysis were (1) to characterize the population pharmacokinetics (popPK) of four different monoclonal antibodies (mAbs) in a combined analysis of individual data collected during first-in-human (FIH) studies and (2) to provide a scientific rationale for prospective design of FIH studies with mAbs. The data set was composed of 171 subjects contributing a total of 2716 mAb serum concentrations, following intravenous (IV) and subcutaneous (SC) doses. mAb PK was described by an open 2-compartment model with first-order elimination from the central compartment and a depot compartment with first-order absorption. Parameter values obtained from the popPK model were further used to generate optimal sampling times for a single dose study. A robust fit to the combined data from four mAbs was obtained using the 2-compartment model. Population parameter estimates for systemic clearance and central volume of distribution were 0.20 L/day and 3.6 L with intersubject variability of 31% and 34%, respectively. The random residual error was 14%. Differences (> 2-fold) in PK parameters were not apparent across mAbs. Rich designs (22 samples/subject), minimal designs for popPK (5 samples/subject), and optimal designs for non-compartmental analysis (NCA) and popPK (10 samples/subject) were examined by stochastic simulation and estimation. Single-dose PK studies for linear mAbs executed using the optimal designs are expected to yield high-quality model estimates, and accurate capture of NCA estimations. This model-based meta-analysis has determined typical popPK values for four mAbs with linear elimination and enabled prospective optimization of FIH study designs, potentially improving the efficiency of FIH studies for this class of therapeutics.
Introduction
Monoclonal antibodies (mAbs) have become an increasingly important class of therapeutic agents for a variety of diseases. To date, more than 20 molecules from this class of compounds have been approved for use by the US. Food and Drug Administration (FDA), with more than 500 antibodies in various stages of development.Citation1,Citation2 Pharmacokinetic (PK) assessment, which supports optimal dosing regimen selection in patients, is a critical component of the clinical development of these molecules.
Knowledge of the biology and physiology of mAb disposition has grown tremendously in recent years. MAbs generally possess a high degree of target selectivity, with many exhibiting nonlinear distribution and elimination, influenced by binding to their target.Citation3,Citation4 At low mAb concentrations (relative to target), this target-mediated disposition predominates, whereas at high mAb concentrations, target binding is often saturated and linear elimination is observed. In the absence of high target expression relative to mAb concentrations in serum, mAbs may exhibit linear elimination with typical characteristics such as a long-terminal elimination half-life (15–21 d).Citation3 The half-life of mAbs generally approximates that of endogenous human IgGs, with elimination mainly due to catabolism mediated by the reticuloendothelial system and recycling through the neonatal Fc receptor (FcRn) receptor.Citation4,Citation5
Typically, PK characterization of mAbs is an important objective of first-in-human (FIH) studies. There are a number of complexities that should be considered in the design of appropriate FIH studies to provide for adequate PK characterization. These studies often last for several months due to the long-terminal half-life of mAbs, in contrast with small molecule drug candidates. In addition, assessment of the frequency and impact of immunogenicity is important because of the potential effects on PK.Citation6 Appropriate FIH study design is crucial to fully characterize PK, and to inform safety and efficacy relationships.
A growing number of population PK (popPK) analyses of therapeutic mAbs have been published in the scientific literature.Citation7 PopPK analysis supports optimal drug utilization by quantifying typical disposition characteristics and sources of variability (such as between-subject variability) within study populations. PopPK also attempts to identify and quantify the effect of covariates on systemic drug exposure, and to assess their potential implications for clinical dosing. Many features of the popPK of mAbs are similar, despite differences in their pharmacological targets. For example, a 2-compartment model has been used in the majority of population analyses to describe the disposition of the mAb. In addition, measures of body size (e.g., total body weight, body surface area) were the most commonly identified covariates found to influence the PK of therapeutic mAbs.Citation8,Citation9
The objective of this retrospective analysis was to compare the popPK parameter estimates for four Amgen mAbs exhibiting linear elimination in FIH studies. The accuracy of parameter estimates in mixed-effect popPK models is highly dependent on the design of the clinical study. Study design aspects such as number of samples collected per subject, timing of sample collection, and type of measurements are all factors that influence the outcome of the popPK analyses and the ability to simulate PK for future trial designs later in development. A poor study design can lead to unreliable or inaccurate estimates of model parameters, requiring the trial to be repeated, thus incurring additional costs. Conversely, in an effort to maximize the amount of information collected during FIH studies, drug companies commonly pursue study designs that incorporate rich sampling schedules, thereby increasing the overall cost of the study and increasing the burden on participating subjects and clinics. Therefore, an additional goal of this work was to provide a scientific rationale for refining FIH study design of mAbs by exploring population D-optimal design strategies using a modeling and simulation approach.
Results
Data
A total of 2716 mAb serum concentrations from 171 healthy subjects from FIH studies conducted with four Amgen mAbs were used in this pooled analysis. All four mAbs were human, and were directed against soluble targets (). The data set included predominantly male subjects with a wide range of ages and total body weights (). The mean age was 30.9 y (range 18 y to 60 y). The mean body weight was 77.6 kg (range 53 to 112 kg).
Table1. List of monoclonal antibodies included in the population pharmacokinetic analysis
Table 2. Baseline demographics of all study subjects
Population pharmacokinetic analysis
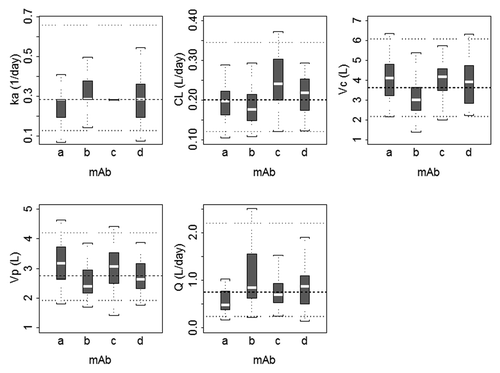
A robust fit to the combined data from the four mAbs was obtained using a 2-compartment model with first-order absorption and linear elimination, utilizing a proportional residual error model. The goodness of fit plots indicated that the model did an adequate job of describing the data (). In addition, there did not appear to be a trend when conditional weighted residuals were plotted against dose, supporting the use of the linear elimination model. The popPK parameter estimates and associated standard errors for the base model are shown in . Inter-subject variability in most model parameters was moderate (i.e., <35%) with the exception of ka and Q, which showed greater inter-subject variability. Population parameter estimates for CL and Vc were 0.20 L/day and 3.6 L with intersubject variability (IIV) of 31% and 34%, respectively. The random residual error was 14%. Because highly correlated random-effect estimates were observed for CL, Vc, and Vp, the off-diagonal elements of the covariance matrix were estimated. The correlation coefficients between CL and VC, VC and VP, and CL and VP were 0.735, 0.647, and 0.427, respectively. shows boxplots of maximum a posteriori empirical Bayes estimates for individual PK parameters for the four mAbs. Substantial differences (>2-fold) in PK parameters were not apparent across mAbs, and the 25th to 75th percentiles of the parameters estimates overlapped across mAbs. IIV in the absorption rate constant (ka) was minimal for mAb c, where the model estimated parameter value for most subjects was equal to the typical population value (0.282 d−1).
Figure 1. Goodness of fit evaluated by plots of (A) observed concentration (µg/mL) vs. individual prediction, (B) conditional weighted residual vs. population prediction, (C) conditional weighted residual vs. time (days), and (D) conditional weighted residual vs. mAb dose (mg). Symbols are individual concentrations. In plot (A), the solid line is the line of unity; in all plots, dashed line is line of regression; in plots (B, C, D), horizontal dotted lines represent ± 3 units of CWRES. Abbreviations: CWRES, conditional weighted residual; DV, dependent variable; PRED, population prediction.
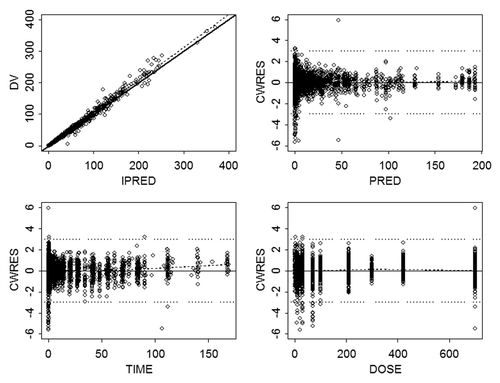
Table 3. Population pharmacokinetic parameter estimates for monoclonal antibodies
Figure 2. Boxplots of population pharmacokinetic parameters for monoclonal antibodies included in the meta-analysis. The boxplots represent a summary of individual maximum a posteriori Bayesian estimates, where dashed and dotted horizontal lines represent the typical value and the 5th and 95th percentile values for each pharmacokinetic parameter, respectively. The median is shown as the dashed line, the 25th and 75th percentiles are represented as the bottom and top of the filled box, and the whiskers represent the range of values. ka, absorption rate constant; CL, clearance; Vc, volume of the central compartment; Vp, volume of the peripheral compartment; Q, distributional clearance.
Model evaluation
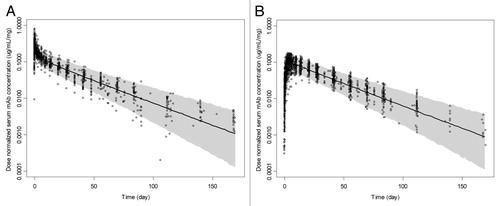
The general popPK model evaluation results suggested that the final model provided a reliable description of the data with good precision of structural model and variance parameter estimates. show the median and 90% prediction interval with observed dose-normalized concentration-time data for all four mAbs overlaid after intravenous (IV) or subcutaneous (SC) administration, respectively. The population estimate of bioavailability was 74% and the estimated Tmax was ~6 d. The median half-lives of the α and β phases were estimated to be 1.43 (0.33–5.33) and 24.3 (16.7–37.8) days, respectively.
Figure 3. Observed and simulated dose-normalized serum monoclonal antibody concentration (µg/mL/mg) vs. time after a single-dose intravenous (A) or subcutaneous (B) administration in healthy subjects, respectively. The solid lines and shaded areas are the median and 5th and 95th percentile simulated profiles for n = 1000 runs, respectively. The open circles correspond to the observed concentration values for all four mAbs.
Covariate analysis
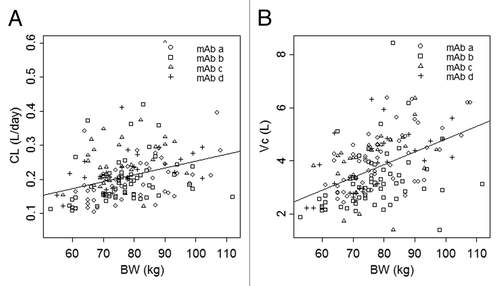
Body weight was included as the one covariate that appeared to explain the largest amount of IIV in CL, Q, Vc, and Vp. The effect of body weight on CL and Vc is shown in , respectively. The line in each plot represents the least squares regression of CL or Vc as a function of body weight. The typical values (%RSE) of the exponential functions shared by CL and Q, and Vc and Vp were 0.865 (19.2) and 0.957 (16.4), respectively. The final model resulted in a significant reduction in minimum value of objective function (MVOF; ΔMOFV = –48.2 with the addition of 2 parameters [P < 0.001]) compared with the base model, as well as slightly reduced IIV in CL, Q, Vc, and Vp. Age did not appear to be a covariate based on exploratory analysis, and sex was not investigated because the healthy subjects included in the analysis were mostly male.
Figure 4. Clearance (A) and central volume of distribution (B) vs. body weight. The symbols represent individual maximum a posteriori Bayesian estimates of clearance (A) and central volume of distribution (B) for each mAb. The line represents the least squares regression of body weight and population average clearance (A) or central volume of distribution (B).
Optimal sampling
Optimal sampling times were determined by reducing the scalar (D-optimal: determinant) asymptotic covariance of the estimates.Citation10 That is, sampling times were selected to most inform the estimates of the PK model parameters. The optimal sampling times by the IV and SC routes for minimal (n = 5 samples/subject), NCA (n = 10 samples/subject), and rich (n = 20 samples/subject for IV and n = 22 samples/subject for SC route) sampling strategies are shown in . Boxplots of popPK parameters from stochastic simulation and estimation (SSE) using the different study designs for 1000 simulations/estimations are shown in . Minimal sampling times reflect samples at maximum drug concentration (information on absorption and distribution) and during the terminal phase (information on elimination). Five unique sampling times for each group were observed, which matches the number of fixed effects in the model. This resulted in the direct observation of Cmax for both routes of administration. The AUClast estimate is predicted to capture ~92% and ~99% of the true AUClast for the SC and IV sampling schedules, respectively.
Table 4. Sampling times for different study designs
Figure 5. Boxplots of population pharmacokinetic parameters from stochastic simulation and estimation using minimal (sample collection n = 5), NCA (sample collection n = 10), and rich (sample collection n = 20) study designs for 1000 simulations/estimations. The boxplots represent a summary of population parameter estimates, and dashed horizontal lines represent the typical parameter value for each pharmacokinetic parameter used in the simulation. The median is shown as the horizontal line, the 25th and 75th percentiles are represented as the bottom and top of the filled box, and the whiskers represent the range of values. F1, bioavailability; ka, absorption rate constant; CL, clearance; Vc, volume of the central compartment; Vp, volume of the peripheral compartment; Q, distributional clearance.
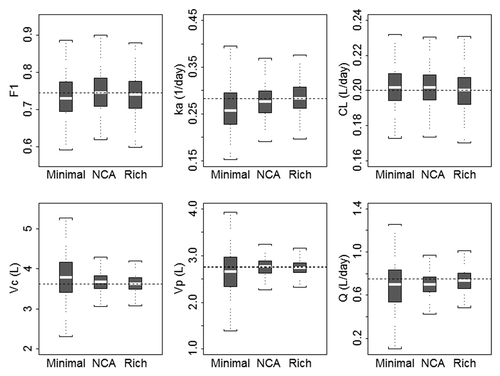
The rich sampling schedule for each route resulted in a determinant of the Fisher Information of 1.72977e+050. The ratio of rich to minimal to the power of 1/11 is 1.087, indicating that the information content in the rich design is only slightly higher than that of the minimal design.
In terms of predicted asymptotic parameter estimate %CV, the ratio of optimal design to rich design was: Vc = 1.13, k12 = 1.45, k21 = 1.55, CL = 1.07, ka = 1.76, f = 1.06. Parameter %CV for CL, Vc and F are expected to be in the range of [1.06, 1.13]-fold worse for the minimal design compared with the rich, suggesting that these designs are of similar quality for estimating these parameters. Parameter %CV for k12, k21 and ka are expected to be in the range [1.45, 1.76]-fold worse for the minimal design compared with the rich, suggesting that the rich design (particularly the early sampling for distribution, IV, and absorption, SC) is better for estimating these parameters. Comparatively, the minimal design uses 5 samples per subject, and the rich designs use 20 or 22 samples.
Discussion
In this report, we characterized the single-dose PK properties for four mAbs using a meta-analysis approach. Consistent PK profiles were observed for each mAb after IV or SC administration in healthy volunteers, indicating that a single model of the data was plausible. For the four mAbs included in this retrospective analysis, target expression in the central compartment was low. A 2-compartment model with linear elimination provided a robust fit to the healthy volunteer PK data, with typical CL and VC values of 0.20 L/day and 3.6 L, respectively, after IV administration. Absorption after SC administration was characterized by a first-order rate constant with a Tmax of ~6 d and 74% bioavailability. A meta-analysis approach enabled the integration of PK information from separate FIH study designs and produced robust popPK estimates. These results agree with commonly cited values for mAbs with linear PK; however the purpose of this work was to obtain an understanding of the value so that simulations could leverage this prior information to optimize FIH trial design.
This retrospective analysis was based on four recent mAb candidates that were selected based on narrow selection criteria. The results were from single dose studies in healthy volunteers, and as such do not include the effects of disease or target binding, which may alter the pharmacokinetic profile. For example, in a popPK analysis of denosumab, tumor type was identified as a covariate that influenced the linear CL.Citation11 Patients with solid tumors exhibited an approximate 1.1 to 1.4–fold increase in linear CL relative to healthy subjects. In addition, the sample scheme was optimized for mAbs with specific PK parameters that represent a subset of overall range in PK characteristics of mAbs. Therefore, the most appropriate optimal sampling scheme may be identified in cases where the PK properties are successfully anticipated from non-human primate studies or PBPK modeling.
Body weight has frequently been identified as a covariate in popPK analysis of mAbs.Citation7,Citation8 A fixed dosing strategy was employed for these FIH studies to facilitate characterization of the effect of body weight on PK parameters. In an effort to scale PK from non-human primates to humans, Dong et al. proposed coefficients of 0.75 and 1 for CL and V parameters respectively.Citation12 The analysis showed that CL and V predictions were within 2-fold of the observed human parameter values for 9 of 10 mAbs examined. In the current analysis, similar values for the BW coefficients were estimated for CL and V parameters (0.865 and 0.957, respectively) for a combined data set of four mAbs in a single dose setting. Knowledge of the impact of covariates such as BW on PK can be useful to guide optimal dose selection. This data confirms the continued use of non-human primates in the prediction of human PK for mAbs that exhibit linear PK.
Optimal design methods were employed using the base popPK model to investigate alternative sample collection schemes to support FIH study designs. As expected, a rich sampling scheme with 20 or 22 serum samples collected per subject after SC or IV administration, respectively, returned the least biased estimates with the least between-trial variability. Reducing the number of samples to 10 per subject increased the estimate bias, but was similar to the rich design with regards to between-trial variability in the population parameter estimates. Use of the minimal sampling scheme with 5 samples per subject resulted in the greatest degree of bias and between-trial variability in the population parameter estimates compared with rich and NCA designs. Depending on the objectives of the study, we have identified three potential collection schemes ranging from sparse to rich with an intermediate option to facilitate NCA analysis. Based on SSE analysis, the three collection schemes will deliver precise model estimates (<10% RSE) for fixed effect parameters. It should be noted that D-optimality does not take into account parameter estimate uncertainty. ED-optimality, where the uncertainty of the population parameters is included in the design step, is an alternative. Here, the %RSEs from the estimation step are small (<10%), meaning that the parameters are well-known. Thus, D-optimality is an appropriate design metric for this case. In addition, this methodology may also be used to assess the effect of a missed sample collection on the precision of parameter estimates.
The NCA sampling scheme is appropriate for estimating typical NCA parameters such as Tmax, Cmax, AUClast, AUC from time zero to infinity (AUCinf) and half-life after SC or IV administration in FIH studies for linear mAbs as defined in this study. The respective sampling time points chosen provide adequate coverage of the serum concentration-time curve to estimate AUClast with average AUC extrapolation values below 20% as needed if AUCinf is to be reported (WinNonlin software, Pharsight Corp.). In addition, a reasonable estimate of the mAb half-life could be computed with a minimum of 3 time-points selected after Cmax in the terminal phase to achieve a minimum adjusted R2 value of 0.8 for the regression fit. This intermediate sampling scheme, from a PK perspective, reduces the burden on subjects to return to the clinic for sampling, while delivering robust estimates of exposure comparable to the rich design. In addition, a reduction in the number of samples also reduces the associated expenses related to sample analysis and storage.
PopPK parameters from this analysis of linear mAbs agree with previous publications that have summarized results across mAbs.Citation7,Citation12-Citation14 Based on estimates from Dong et al.,Citation12 the range in CL and Vc was approximately 4.5-fold and 3.0-fold, respectively, across the individual mAbs. The relatively narrow range of CL and Vc observed for mAbs reflects the similarity in physicochemical and biochemical properties for these molecules. Physicochemical and biochemical factors such as charge, size, FcRn binding affinity, and glycosylation may play a role in the differences observed,Citation15 and serve as areas of future research to further optimize the PK properties of mAbs. Physiologically-based pharmacokinetic (PBPK) models offer the possibility of exploring the effects of various physicochemical and physiological factors on mAb disposition and examples of such investigations are increasingly emerging in the scientific literature.Citation16-Citation18
In conclusion, this meta-analysis determined typical PK values for four mAbs with linear elimination. Single-dose PK studies for linear mAbs executed using the optimal designs evaluated here are expected to yield high quality model estimates, and accurate capture of NCA estimates, thus improving the efficiency of FIH studies. As reported here, model-based meta-analysis has enabled prospective optimization of FIH study designs for mAbs.
Methods
Clinical data
Data from FIH studies conducted with four Amgen mAbs were used in these analyses (). Appropriate participant and institutional review board (IRB) approvals were received as part of each individual study. The combined data set was composed of 171 subjects contributing a total of 2716 mAb serum concentrations, of which, 1153 came from subjects receiving IV doses and 1563 from subjects receiving SC doses of the mAbs. The median of the number of observations per subject was 16 (12 to 22) for the IV arm and 17 (13 to 20) for the SC arm.
Analytical methods
Enzyme-linked immunosorbent assay (ELISA) methods were developed and validated to quantify mAb concentration in human serum. Capture reagents for mAbs in this assay format were anti-idiotype monoclonal antibodies. Inter-assay accuracy and precision requirements were less than 20% coefficient of variation (%CV). The lower limit of quantification was 12.5, 10, 1, and 50 ng/mL for mAbs a, b, c, and d, respectively.
Data inclusion and exclusion criteria
FIH studies conducted in normal healthy volunteers with human mAbs demonstrating linear PK were included in this meta-analysis. Serum mAb concentration measurements that were missing or any values with unknown or missing associated observation times were excluded from the analysis. There were a total of 218 PK measurements that were below the quantitation limit (BQL), representing ~7% of the data set. Given the small number of BQL records, no methodology was implemented to account for the effect of BQL values on parameter estimates.Citation19 The data set was truncated at 168 d post-dose, given the small number of observations beyond this time point. No samples were reported positive for anti-drug antibodies.
Structural model
Individual concentration-time data from all subjects for all mAbs were pooled into a single data set for popPK analysis using nonlinear mixed effect modeling with the NONMEM software system (Version 7.2, ICON Development Solutions). The first-order conditional estimation with η − ε interaction method (FOCEI) was applied to all models tested. mAb PK following IV administration was described by an open 2-compartment disposition model with first-order elimination from the central compartment. For mAbs administered SC, a depot compartment with a first-order absorption rate constant was included. The model was parameterized in terms of clearance (CL), central volume of distribution (Vc), peripheral volume of distribution (Vp), distribution clearance (Q), and absorption rate constant (ka). The absolute bioavailability (F1) was estimated for SC administration relative to IV administration. Model selection was guided by various goodness-of-fit criteria, including diagnostic scatter plots, plausibility and precision of parameter estimates, and the MVOF.
Statistical model
An exponential random effect model was chosen to describe IIV as shown in Equation 1:
where èi is the estimated parameter value for individual i (e.g., Vc,i, CLi), is the typical population value of the parameter, and çèi is individual-specific intersubject random effect for individual i and parameter
and is assumed to be distributed ~N(0, ω2) with covariances defined by the intersubject covariance matrix Ω.
Residual unknown variability (RUV) was modeled using a proportional error model as shown in Equation 2:
where Cij and are the jth measured and model predicted concentrations, respectively for individual i, and åij is the associated intra-individual residual random error and is assumed to be distributed ~N(0, σ2).
Covariate model
The full covariate modeling approach, which emphasized parameter estimation, rather than stepwise hypothesis testing, was used for this popPK analysis.Citation20 The primary covariates of interest had been predefined for this analysis, based on prior knowledge. Body weight was included as a covariate for CL, Q, Vc, and Vp. In addition, the effect of age on relevant pharmacokinetic parameters was evaluated. The effects of body weight on PK parameters were described using a power model as shown below:
where Pi is the estimated parameter value for individual i, θ is the typical population value of the parameter, BWi is the body weight of individual i, 70 is the median body weight of the population, and θBW_P represents the exponential function of the body weight effects on the parameter. CL and Q were allowed to share the same exponential function θBW_P; similarly, Vc and Vp were allowed to share a common θBW_P.
Similarly, the effects of age on various PK parameters were evaluated as shown in Equation 4 below:
Where AGEi is the age of individual i in years, 28 is the median age of the population, and θAGE_P represents the exponential function of the effects of age on the parameter.
A decrease in the MVOF of 3.841 or greater following introduction of a single covariate into the “base” model was considered statistically significant (P < 0.05 with 1 degree of freedom), using the χ2 distribution, if the 95% confidence intervals (CI) for the estimate did not include the null value.
Model evaluation
The predictive performance of the base model was evaluated using a visual predictive check. The popPK model was used to simulate 1000 hypothetical subjects that received a 1 mg dose of mAb, either IV or SC. The distribution (median and 90% prediction interval) of the simulated concentration vs. time curves was compared with the dose normalized mAb concentrations observed in the model-building data set.
Optimal design model
D-optimality seeks to reduce the scalarized (D-optimal: determinant) covariance of the estimated population parameters by selection of an experimental design. The invocation of the Cramer-Rao inequality provides an asymptotic (lower) bound on the covariance of the parameter estimates as the inverse of the Fisher information matrix (FIM).Citation21 Optimal designs for population PK studies have been investigated in the form of D-optimal design strategies by Duffull et al.,Citation22,Citation23 and others.Citation24
D-Optimality was performed using PopED (version 2.12).Citation24 The PK model parameters were transformed to the set (Vc, k12, k21, CL, ka, F), where k12 = Q/Vc and k21 = Q/Vp. If available, the IIV estimates from the PK model were used for the optimal design model. k12 and k21 IIV was set to 0.1 (31.6% IIV). No off-diagonal IIV estimates were used in the optimal design model.
Minimal sampling times by route
Initial sampling times were 1, 2, 4, 7, 14, 21, 42, 84, 112, and 140 d for both SC and IV groups. Random search, stochastic gradient and line search methods were used to refine these sample times. Sampling times were allowed to vary independently for each group.
Additional samples for non-compartmental analysis
Additional sampling times were added to the minimal sampling design for each route for the purposes of accurately observing Cmax and estimating area under the concentration-time curve from time zero to the last quantifiable concentration (AUClast). Drug concentration profiles were simulated using the model, and “true” Cmax and AUClast were provided by these simulations. Four additional samples were added to each sampling schedule, and this number was selected to minimize the AUClast estimate bias to less than 10%.
Comparison to rich sampling strategies
The minimal design was compared with the standard rich sampling strategy for each route. Rich sampling typically includes the following 20 time points: 0, 0.17, 0.33, 0.5, 1, 2, 4, 6, 8, 10, 14, 21, 28, 42, 56, 70, 84, 112, 140, and 168 d post-dose for the SC route, with an additional 2 samples at 0.02 and 0.04 d post-dose for the IV route.
Naturally, the rich sampling strategies provide more information, so it is anticipated that the rich sampling strategies will provide smaller expected parameter uncertainty. A comparison of the efficiency of each design was made in the form of a D-efficiency calculation. The ratio of the determinant of the Fisher Information for the rich design relative to the minimal design to the power of 1/p, where p is the number of parameters in the model (12; 6 model, 5 IIV, and 1 RUV parameters) was calculated. This number can be thought of as a factor by which the minimal design must be replicated to achieve the same level of parameter precision as that of the rich sampling design.
Additionally, expected asymptotic variance estimates for the designs were calculated. These were translated into parameter %CV for the purposes of determining the effect of design choice on individual parameters.
Stochastic simulation and estimation
SSE analyses were performed for the minimal (n = 5 samples/subject), NCA (n = 10 samples/subject), and rich (n = 20–22 samples/subject) sampling strategies to assess the performance of each study design. First, 1000 replicates of popPK data (30 subjects each for SC and IV routes) were simulated for each design using NONMEM. Next, model parameters were back estimated from the simulated data sets using the FOCEI method. The resulting estimated model parameters (i.e., typical values for theta) for each of the 3 study designs were compared with the typical values of the parameters derived from the observed data using boxplots.
| Abbreviations: | ||
| AUC | = | area under the concentration-time curve |
| BQL | = | below the quantitation limit |
| Cmax | = | maximum concentration |
| CL | = | clearance from the central compartment |
| CV | = | coefficient of variation |
| ELISA | = | enzyme-linked immunosorbent assay |
| F | = | bioavailability |
| FIH | = | first in human |
| IIV | = | intersubject variability |
| IV | = | intravenous |
| mAb | = | monoclonal antibody |
| ka | = | absorption rate constant |
| MVOF | = | minimum value of objective function |
| NCA | = | non-compartmental analysis |
| PK | = | pharmacokinetics |
| PopPK | = | population pharmacokinetics |
| Q | = | inter-compartmental distribution clearance |
| RSE | = | relative standard error of the estimate |
| RUV | = | residual unknown variability |
| SC | = | subcutaneous |
| SSE | = | stochastic simulation and estimation |
| Tmax | = | time of maximum concentration |
| Vc | = | volume of the central compartment |
| Vp | = | volume of the peripheral compartment |
Disclosure of Potential Conflicts of Interest
All authors are employees of Amgen and own Amgen shares. The authors have no other conflicts of interest that are directly relevant to the content of this study.
References
- Wang W, Wang EQ, Balthasar JP. Monoclonal antibody pharmacokinetics and pharmacodynamics. Clin Pharmacol Ther 2008; 84:548 - 58; http://dx.doi.org/10.1038/clpt.2008.170; PMID: 18784655
- Reichert JM. Marketed therapeutic antibodies compendium. MAbs 2012; 4:413 - 5; http://dx.doi.org/10.4161/mabs.19931; PMID: 22531442
- Lobo ED, Hansen RJ, Balthasar JP. Antibody pharmacokinetics and pharmacodynamics. J Pharm Sci 2004; 93:2645 - 68; http://dx.doi.org/10.1002/jps.20178; PMID: 15389672
- Mould DR, Sweeney KR. The pharmacokinetics and pharmacodynamics of monoclonal antibodies--mechanistic modeling applied to drug development. Curr Opin Drug Discov Devel 2007; 10:84 - 96; PMID: 17265746
- Brambell FW. The transmission of immunity from mother to young and the catabolism of immunoglobulins. Lancet 1966; 2:1087 - 93; http://dx.doi.org/10.1016/S0140-6736(66)92190-8; PMID: 4162525
- Chirmule N, Jawa V, Meibohm B. Immunogenicity to therapeutic proteins: impact on PK/PD and efficacy. AAPS J 2012; 14:296 - 302; http://dx.doi.org/10.1208/s12248-012-9340-y; PMID: 22407289
- Dirks NL, Meibohm B. Population pharmacokinetics of therapeutic monoclonal antibodies. Clin Pharmacokinet 2010; 49:633 - 59; http://dx.doi.org/10.2165/11535960-000000000-00000; PMID: 20818831
- Wang DD, Zhang S, Zhao H, Men AY, Parivar K. Fixed dosing versus body size-based dosing of monoclonal antibodies in adult clinical trials. J Clin Pharmacol 2009; 49:1012 - 24; http://dx.doi.org/10.1177/0091270009337512; PMID: 19620385
- Bai S, Jorga K, Xin Y, Jin D, Zheng Y, Damico-Beyer LA, Gupta M, Tang M, Allison DE, Lu D, et al. A guide to rational dosing of monoclonal antibodies. Clin Pharmacokinet 2012; 51:119 - 35; http://dx.doi.org/10.2165/11596370-000000000-00000; PMID: 22257150
- D’Argenio DZ. Optimal sampling times for pharmacokinetic experiments. J Pharmacokinet Biopharm 1981; 9:739 - 56; http://dx.doi.org/10.1007/BF01070904; PMID: 7341758
- Gibiansky L, Sutjandra L, Doshi S, Zheng J, Sohn W, Peterson MC, Jang GR, Chow AT, Pérez-Ruixo JJ. Population pharmacokinetic analysis of denosumab in patients with bone metastases from solid tumours. Clin Pharmacokinet 2012; 51:247 - 60; http://dx.doi.org/10.2165/11598090-000000000-00000; PMID: 22420579
- Dong JQ, Salinger DH, Endres CJ, Gibbs JP, Hsu CP, Stouch BJ, Hurh E, Gibbs MA. Quantitative prediction of human pharmacokinetics for monoclonal antibodies: retrospective analysis of monkey as a single species for first-in-human prediction. Clin Pharmacokinet 2011; 50:131 - 42; http://dx.doi.org/10.2165/11537430-000000000-00000; PMID: 21241072
- Deng R, Iyer S, Theil FP, Mortensen DL, Fielder PJ, Prabhu S. Projecting human pharmacokinetics of therapeutic antibodies from nonclinical data: what have we learned?. MAbs 2011; 3:61 - 6; http://dx.doi.org/10.4161/mabs.3.1.13799; PMID: 20962582
- Ling J, Zhou H, Jiao Q, Davis HM. Interspecies scaling of therapeutic monoclonal antibodies: initial look. J Clin Pharmacol 2009; 49:1382 - 402; http://dx.doi.org/10.1177/0091270009337134; PMID: 19837907
- Bumbaca D, Boswell CA, Fielder PJ, Khawli LA. Physiochemical and biochemical factors influencing the pharmacokinetics of antibody therapeutics. AAPS J 2012; 14:554 - 8; http://dx.doi.org/10.1208/s12248-012-9369-y; PMID: 22610647
- Chaparro-Riggers J, Liang H, DeVay RM, Bai L, Sutton JE, Chen W, Geng T, Lindquist K, Casas MG, Boustany LM, et al. Increasing serum half-life and extending cholesterol lowering in vivo by engineering antibody with pH-sensitive binding to PCSK9. J Biol Chem 2012; 287:11090 - 7; http://dx.doi.org/10.1074/jbc.M111.319764; PMID: 22294692
- Davda JP, Jain M, Batra SK, Gwilt PR, Robinson DH. A physiologically based pharmacokinetic (PBPK) model to characterize and predict the disposition of monoclonal antibody CC49 and its single chain Fv constructs. Int Immunopharmacol 2008; 8:401 - 13; http://dx.doi.org/10.1016/j.intimp.2007.10.023; PMID: 18279794
- Ferl GZ, Wu AM, DiStefano JJ 3rd. A predictive model of therapeutic monoclonal antibody dynamics and regulation by the neonatal Fc receptor (FcRn). Ann Biomed Eng 2005; 33:1640 - 52; http://dx.doi.org/10.1007/s10439-005-7410-3; PMID: 16341929
- Byon W, Fletcher CV, Brundage RC. Impact of censoring data below an arbitrary quantification limit on structural model misspecification. J Pharmacokinet Pharmacodyn 2008; 35:101 - 16; http://dx.doi.org/10.1007/s10928-007-9078-9; PMID: 17963024
- Gastonguay MR. Full covariate models as an alternative to methods relying on statistical significance for inferences about covariate effects: a review of methodology and 42 case studies, abstr 2229. Abstr Annu Meet Popul Approach Group Eur 2011; 20:http://www.page-meeting.org/?abstr=2229.
- Larsen RJ, Marx ML. An Introduction to Mathematical Statistics. Upper Saddle River, NJ: Prentice-Hall, 1986.
- Duffull SB, Mentré F, Aarons L. Optimal design of a population pharmacodynamic experiment for ivabradine. Pharm Res 2001; 18:83 - 9; http://dx.doi.org/10.1023/A:1011035028755; PMID: 11336357
- Duffull SB, Retout S, Mentré F. The use of simulated annealing for finding optimal population designs. Comput Methods Programs Biomed 2002; 69:25 - 35; http://dx.doi.org/10.1016/S0169-2607(01)00178-X; PMID: 12088590
- Hooker AC, Foracchia M, Dodds MG, Vicini P. An evaluation of population D-optimal designs via pharmacokinetic simulations. Ann Biomed Eng 2003; 31:98 - 111; http://dx.doi.org/10.1114/1.1533074; PMID: 12572660