Abstract
Tumor specific antigens (TSA) provide an opportunity to mobilize therapeutic immune responses against cancer. To evade such responses, tumor development in immunocompetent hosts is accompanied by acquisition of both active and passive mechanisms of immune suppression, including recruitment of CD4+FoxP3+ regulatory T cells (Treg). Thymic derived Treg (nTreg) may recognize self-antigens in the tumor microenvironment, while peripherally induced Treg (iTreg) may preferentially recognize the same TSA which provide an opportunity for therapeutic immunity from peripheral T cells. In this study we provide a systematic analysis of nTreg and iTreg accumulation in the tumor microenvironment (TME) at the cellular level. iTreg accumulation to the TME was influenced by the abundance of a known TSA, and in the absence of a known TSA intratumoral Treg displayed a unique TCR repertoire from peripheral Treg. In vivo suppression assays demonstrate that cognate-antigen matched iTreg are more potent suppressors of CD4+ than are polyclonal iTreg or nTreg, but were unable to suppress CD8+ T cell proliferation. Suppression occurred only locally at the site of immunization, and correlated with decreased expression of CD80 and CD86 on CD11c positive cells. Although established tumors facilitated the induction of TSA-specific iTreg, these iTreg suppressed CD4+ T cell accumulation only locally to the TME. Tumor mediated suppression of CD8+ T cell immunity appeared independent of TSA-specific iTreg.
Introduction
The goal of anti-tumor immunotherapy is to activate cytolytic immune responses, primarily mediated by CD8+ T cells, toward tumor-specific antigens. This can be achieved clinically by therapeutic vaccination against individual tumor antigens (such as prostatic acid phosphatase) or by blockade of immune inhibitory pathways including CTLA-4.Citation1,Citation2 In fact, many tumors may require that both strategies are deployed in combination because although tumorigenesis frequently leads to expression of embryonic or abnormal self-antigens , tolerance to these antigens is often established within the tumor microenvironment by both passive and active mechanisms.Citation3-Citation5 Two of these mechanisms, which may be interlinked, are the presence of high frequencies of FoxP3-expressing CD4+ regulatory T cells (Treg) and defective antigen presentation within the tumor microenvironment.
Tumors derive from cells to which our immune systems are tolerant, a state which is non-redundantly maintained by FoxP3-expressing Treg cells.Citation6,Citation7 Thus, the majority of antigens expressed by tumor cells are germ-line encoded, may be expressed in the thymus and are proposed to be recognized by thymic-derived "natural" Treg (nTreg).Citation8 Because nTreg are generated in the thymus they are thought to express T cell receptors (TCR) specific for endogenous self-antigens . The opportunity for immunotherapy however arises via the expression of mutated or deregulated tumor protein fragments, which may be recognized by Tconv cells that survive negative selection in the thymus and differentiate into tumor antigen reactive effector T cells (Teff). However, the same population of Tconv may also differentiate into tumor antigen specific "induced" Treg (iTreg) and represent a potential barrier to tumor immunotherapy. Several studies have approximated the balance of nTreg and iTreg using either TCR spectratyping or adoptive transfer models in chemically induced or hematogenous tumors.Citation9-Citation11 These studies agree that the majority of Tregs accumulating in tumors are nTreg, but provide inconclusive data regarding the specific importance of iTreg cells in spontaneous tumors or tumors not expressing a pre-defined tumor antigen.
Here we provide a systematic comparison of the balance of tumor-infiltrating nTreg and iTreg in both an antigen-specific and polyclonal context. Both polyclonal and antigen-specific iTreg were spontaneously induced in vivo within the microenvironment of chemically induced sarcomas and ovalbumin-expressing E.G7 tumors. The intratumoral balance of iTreg and nTreg was found to approximate that found in peripheral lymphoid tissues, but to consist of a population with a TCR repertoire distinct from peripheral Treg. Treg mediated suppression of vaccine-induced immunity in vivo is tissue-restricted and antigen-specific, indicating that the specific elimination of intratumoral iTreg may release an important inhibitory checkpoint in anti-tumor immunity. These studies also indicate that antigen-specific suppression by Treg in vivo is specific to CD4+ cells, and that systemic suppression of CD8+ responses by established E.G7 tumors is exerted by an alternative mechanism.
Results
Specific tracking of iTreg and nTreg in vivo
To investigate the relative accumulation of Treg within the tumor microenvironment, an adoptive transfer model of differentially labeled nTreg (expressing FoxP3-GFP) and iTreg (expressing FoxP3-RFP) was developed. For all experiments, nTreg were purified from splenocytes of FoxP3-GFP transgenic mice by flow-cytometry based cell sorting to over 99% purity (Supplemental ). This nTreg population is presumed to be contaminated by roughly 10-20% endogenous iTreg found in the spleen, which cannot be experimentally depleted due to the absence of markers which distinguish between iTreg and nTreg. iTreg were generated by sorting CD4-positive, FoxP3-negative conventional T cells (Tconv) from FoxP3-RFP transgenic mice and then cultured in vitro to induce expression of FoxP3 as described. These iTreg were subsequently re-sorted on the basis of CD4 and FoxP3-RFP expression to over 99% purity. In some experiments, Tconv cells were adoptively transferred without in vitro induction of FoxP3, and spontaneous generation of iTreg in vivo was observed.
Figure 1. Preferential induction and accumulation of iTreg in mLN in vivo. (A) Schematic outline of adoptive transfer model. (B) 10 days after adoptive transfer, splenocytes and mLN cells from recipient CD4-/- mice were analyzed for the proportion of FoxP3-RFP positive in vivo iTreg cells and FoxP3-GFP positive nTreg cells out of total CD3+, CD4+ cells. (C) The absolute number of iTreg cells expressing FoxP3-RFP and nTreg cells expressing FoxP3-GFP were calculated. (D) The ratio of nTreg cells to iTreg cells was calculated in the spleen and mLN. Data illustrate the mean ± S.E.M. from four independent experiments, N ≥ 12 mice per group.
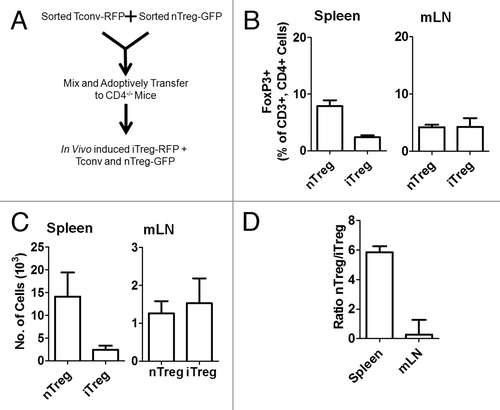
A mixed population of RFP negative Tconv (from FoxP3-RFP reporter mice) and GFP positive nTreg (FoxP3-GFP reporter mice) were adoptively transferred to CD4-/- recipients (). CD4-/- mice were selected as recipients for these initial experiments to maximize engraftment of transferred CD4+ T cell populations, to minimize competition of adoptively transferred Tconv cells for FoxP3 induction in response to exogenous antigen and to maximize the sensitivity of analysis in the absence of background CD4+ T cell populations. Ten days after adoptive transfer, nTreg and spontaneous iTreg were analyzed by flow cytometry in the spleen and mesenteric lymph nodes (mLN). This analysis revealed that both Treg populations were detectable and that nTreg (FoxP3-GFP positive) represented 7.9 ± 1.0% of all CD4+ cells in the spleen and 4.2 ± 0.5% of all CD4+ cells in the mLN (). Spontaneous polyclonal iTreg induction (FoxP3-RFP positive) occurred in 2.4 ± 0.3% of all CD4+ cells in the spleen and 4.2 ± 1.6% of all CD4+ cells in the mLN (). The absolute numbers of both nTreg and iTreg reflected the ratios indicated on a percentage basis (). Thus, the balance on a cellular level was 5.9 ± 0.4 nTreg to every iTreg detected in the spleen and only 0.3 ± 1.0 nTreg for every iTreg in the mLN, indicating that roughly equal numbers of nTreg and iTreg were present in the gut draining lymph nodes. These results support the hypothesis that abundant levels of endogenous microbial and food antigens contribute to maintaining high levels of iTreg specific to those antigens to maintain tolerance within the gut.Citation12 Thus, the Tconv/nTreg adoptive transfer model provides an appropriate system to investigate the relative balance of nTreg and iTreg as reporter for the presence of foreign or mutated self-antigens in other tissues, including the tumor microenvironment.
nTreg and iTreg recruitment to tumor draining lymph nodes
The spontaneous antigen-specific induction of polyclonal iTreg in vivo and preferential accumulation within the mLN suggested that tumor associated antigens, if present, should result in iTreg induction and preferential accumulation within tumor draining lymph nodes (TDLN). To determine iTreg and nTreg accumulation in the tumor microenvironment, CD4-/- mice were adoptively transferred with a mixed population of nTreg-GFP and Tconv isolated from FoxP3 RFP reporter (FIR) mice and then inoculated with IC1 sarcoma cells two days later. Tumors were allowed to grow for two weeks, allowing spontaneous iTreg generation to occur as observed in tumor naïve mice. Analysis of iTreg and nTreg in TDLN revealed that the frequency of iTreg in the TDLN was similar to that observed in the spleen (). As observed in tumor naïve mice, higher frequencies of iTreg were observed in the mLN.
Figure 2. Relative accumulation of iTreg and nTreg within the tumor microenvironment. CD4-/- mice were inoculated with either IC-1 sarcoma cells (A, 5×10⁵ cells) or E.G7 tumor cells (B, 106 cells) by subcutaneous injection and tumors were allowed to grow to 6-8 mm in diameter. Five days following adoptive transfer of a mixed population of in vitro induced polyclonal iTreg, nTreg and Tconv, the indicated tissues of IC-1 sarcoma bearing mice were analyzed for the relative composition of each Treg subset (A). Similarly, five days following adoptive transfer of a mixed population of in vitro induced OT-II iTreg, nTreg and OT-II Tconv, the indicated tissues of E.G7 tumor bearing mice were analyzed for the relative composition of each Treg subset. Data are illustrated for individual mice as the mean ± S.E.M. from ≥ two independent experiments
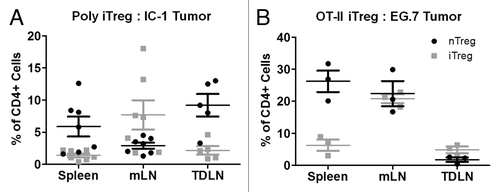
To further explore the role of cognate tumor antigen in iTreg induction and accumulation, nTreg were mixed with Tconv and OT-II iTreg generated in vitro from OT-II/FIR mice and adoptively transferred to recipient mice two days prior to inoculation with the ovalbumin expressing EG.7 tumor. In this model, higher frequencies of OT-II iTreg were found in the TDLN relative to nTreg (), while in the spleen nTreg remained the predominant Treg population. These data indicate that when a known tumor antigen and cognate specific iTreg population are both present, those iTreg accumulate at higher relative frequencies in the TDLN than do polyclonal iTreg. This experimental setting is artificial in the sense that highly-expressed foreign antigens are not easily engineered into spontaneous human tumors, however it serves to highlight the biological property that specific tumor antigens may serve an instructive role in the recruitment of potentially suppressive Treg to the tumor microenvironment.
Unique TCR repertoire of intratumoral iTreg
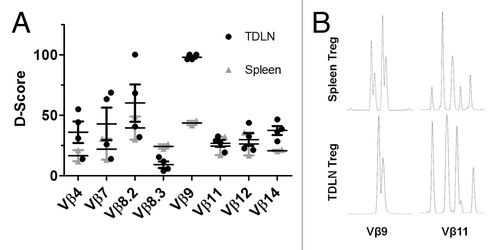
The observation that the absolute frequencies of iTreg retrieved from TDLN in chemically induced sarcomas are similar to those observed in the spleen, when contrasted to the specific recruitment of OT-II iTreg to ova-expressing tumors, raises the question as to whether tumor infiltrating iTreg recognize unique tumor antigens that are not found in other peripheral tissues. To investigate this question, the TCR Vβ repertoires of Treg isolated from TDLN were compared to splenic Treg of the same mice. In these studies, the total number of retrievable Treg from TDLN (to ≥ 99% purity by flow cytometry based cell sorting) was on the order of 2×10⁴ Treg cells. To control for artificial differences in TCR diversity created by the low numbers of retrievable Treg,Citation13 the diversity of TDLN Treg was compared to cell-count matched populations of splenic Treg, and the diversity (D) scores of both of these Treg populations compared to a ‘control’ spectratype of 5×10⁶ Treg cell populations isolated from tumor naïve mice.Citation14,Citation15 This number of Tregs in the control population is estimated to exceed the total actual diversity of TCR sequences in the entire T cell repertoire.Citation16 The spectratypes of eight different Vβ regions were analyzed for these Treg and demonstrate individual Vβ region-dependent differences in the repertoire of TDLN and splenic Treg controlled for absolute cell numbers (). For Vβ11 and Vβ12, the TCR repertoires of TDLN and splenic Treg match almost exactly, although their diversity is approximately 25% distinct from a population of 5×10⁶ splenic Treg, illustrating the effect that absolute cell number restriction has on perceived TCR diversity. In contrast, the TCR diversity for Vβ4, Vβ7, Vβ8.2, Vβ8.3, Vβ9 and Vβ14 differs significantly for TDLN Treg versus splenic Treg. In particular, the diversity of sequences detected in TDLN Treg for Vβ9 is completely non-overlapping with sequences in splenic Treg from the same animals, indicating that this TCR may recognize particular tumor antigen(s) not found in peripheral tissues. Representative spectratypes for Vβ9 and Vβ11 are shown ().
Figure 3. Regulatory T cell TCR diversity in tumor bearing mice. CD4+FoxP3+ Treg cells (104 cells) were purified by cell sorting from total splenocytes and TDLN cells in IC-1 tumor bearing mice. The diversity (D) scores for Treg isolated from splenocytes and TDLN were independently compared to a reference Treg population (containing 5×10⁶ cells) which followed the expected Gaussian distribution. D scores for Vβ spectratype distribution profiles TDLN and splenocytes Treg for individual mice are shown together with mean ± S.E.M. Representative Vβ9 and Vβ11spectratype profiles are illustrated in B.
Cognate antigen specific iTreg suppression of vaccine immunity in vivo
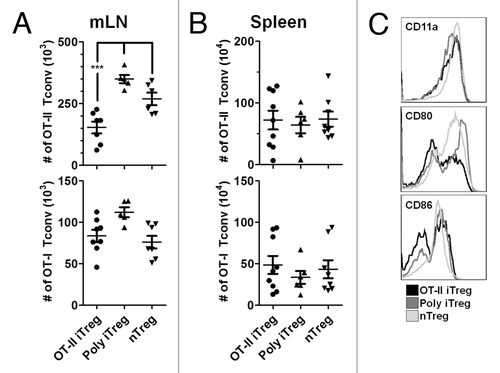
Several studies in autoimmunity have reported that suppression of effector T cell immunity by Treg is more potent when the Treg and Teff share cognate antigen TCR specificity than when either population is TCR mismatched or polyclonal.Citation17-Citation19 These data imply that antigen-matched suppression of effector T cells by Treg may also be important for anti-tumor immunity, particularly in the context of vaccination. To examine antigen-specific suppression in vivo, FIR mice were adoptively transferred with a mixed population of ovalbumin-specific TCR transgenic CD4+ (OT-II) and CD8+ (OT-I) cells, together with either polyclonal nTreg, in vitro induced polyclonal iTreg or in vitro induced OT-II iTreg. Recipient mice were subsequently vaccinated by intra-peritoneal injection with aluminum salt precipitated ovalbumin (ova/alum). These experiments show that in the mLN, vaccination with ova/alum leads to proliferation of both OT-II and OT-I cells and that the proliferation of OT-II cells is inhibited in the presence of OT-II iTreg but not polyclonal iTreg or nTreg (). Interestingly, inhibition of OT-II proliferation was observed in the mLN but not in the spleen (), indicating that suppression occurs only locally. This may be explained by the observation that ova/alum mediated upregulation of CD80, and to a lesser extent CD86, expression was inhibited on peritoneal CD11c positive cells in animals adoptively transferred with OT-II iTreg but not polyclonal iTreg or nTreg (). These data are in accord with previous in vitro studies demonstrating reduced expression of CD80 and CD86 by antigen presenting cells.Citation20-Citation22 The proliferation of OT-I cells was not inhibited in any tissue using any of the Treg populations indicated. As was observed in the TDLN, this suggests that intra-peritoneal vaccination with ova/alum leads to increased concentrations of ovalbumin in the mLN as compared to the spleen, which supports the local recruitment and accumulation of ovalbumin specific OT-II iTreg.
Figure 4. In vivo suppression of Tconv by antigen-specific iTreg cells. FIR mice were adoptively transferred with a mixed population of OT-I and OT-II cells, together with either OT-II iTreg, polyclonal iTreg or nTreg. 5 days following immunization with ova/alum, the absolute numbers of OT-I and OT-II Tconv cells were analyzed in the mLN (A) and spleen (B). Data are shown for individual mice together with mean ± S.E.M. Expression of CD11a, CD80 and CD86 were analyzed on CD11c positive peritoneal cells on day 5 after immunization and representative plots are shown (C).
These findings suggest that vaccination against a particular TSA would be strongly suppressed by TSA specific iTreg in the tumor microenvironment. To test this hypothesis, in vivo vaccination suppression studies were performed in FIR mice adoptively transferred with OT-I and OT-II Tconv prior to inoculation with ovalbumin expressing EG.7 tumors. This experimental setting is predicted to approximate autochthonous tumor development in an animal with pre-existing CD4+ Tconv that may share TCR specificity with a spontaneously generated TSA (in this case the artificial antigen ovalbumin). Our previous studies indicated that spontaneous induction of iTreg occurs in vivo in tissues where cognate foreign antigens are in abundance () and that cognate-antigen specific iTreg preferentially accumulate in tissues where a known foreign antigen is present, including TDLN (). Thus, the presence of OT-II Tconv in mice subsequently inoculated with the ovalbumin expressing EG.7 tumor was predicted to lead to the spontaneous generation of OT-II iTreg and accumulation of these iTreg within the TDLN. After 14 days of tumor growth, we observed that OT-II iTreg represented 1.5 ± 0.3% of OT-II cells in the TDLN (data not shown). These data indicate that the microenvironmental conditions permissive for iTreg induction were present and sufficient in the TDLN and that the TDLN remained a site of accumulation of these OT-II iTreg.
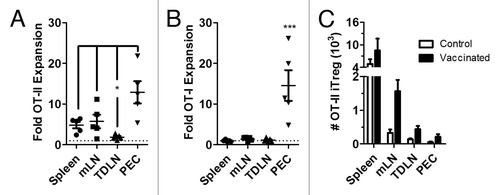
Due to the local induction and accumulation of TSA-specific iTreg within the TDLN, we asked whether local suppression of vaccine-induced T cell immunity was similarly restricted to the TDLN as was previously observed in the mLN. These experiments indicated that following immunization with ova/alum, OT-II Tconv undergo significant expansion in the spleen, mLN and especially the peritoneal cavity (). In contrast, OT-II proliferation was not observed in the TDLN. OT-I were observed to expand in the peritoneal cavity (PEC), but not in the spleen, mLN or TDLN (). Immunization with ova/alum led to the proliferation of OT-II iTreg in all tissues analyzed ().
Figure 5. Cognate-antigen specific suppression of CD4+ T cell immunity in tumor bearing mice. FIR mice were adoptively transferred with a mixed population of OT-II Tconv and OT-I cells 2 days prior to inoculation with E.G7 tumors by subcutaneous injection. After 10 days, E.G7 tumor bearing mice were vaccinated with ova/alum or injected with PBS as control. 5 days later, the fold expansion of OT-II cells (A) or OT-I cells (B) in the ova/alum treated group was compared to controls (shown as the dashed line) for the indicated tissues. Data are shown for individual mice together with mean ± S.E.M. The absolute numbers of spontaneously generated OT-II iTreg were calculated for each tissue for control and ova/alum vaccinated mice. Data are shown as mean ± S.E.M.
Discussion
It has historically been difficult to differentially track nTreg and iTreg populations in vivo because cell surface markers have not been described that reliably distinguish the two subsets. These experiments are now possible due to a variety of congenic and FoxP3-reporter transgenic mouse models. Such a model was utilized here to study the cellular distribution of nTreg and iTreg in the tumor microenvironment. In several autoimmunity models, the relative importance of cognate antigen specific iTreg was compared to polyclonal nTreg,Citation17-Citation19 and such questions are equally relevant to understanding and inducing therapeutic immunity to cancer. Specifically, we sought to address whether tumor specific antigens play an instructive role for the accumulation of iTreg in the tumor microenvironment, because iTreg are more likely than nTreg to share cognate antigen specificity with vaccine-targeted effector T cells, and therefore represent an important barrier to therapeutic immunity in cancer.
Although phenotyping and genomic profiling studies have failed to detect obvious differences between in vivo iTreg and nTreg, it is clear that in vitro iTreg may not be phenotypic or functional equivalents to in vivo iTreg.Citation23 The impact that these phenotypes have on interpretation of studies using in vitro iTreg is currently unknown, and in vitro iTreg have been shown by many groups to remain functionally suppressive,Citation10,Citation17,Citation18,Citation23-Citation27 but the applicability of results based on studies with in vitro iTreg should be only cautiously extended to in vivo iTreg. In these studies in vivo iTreg were utilized wherever technically possible, and conclusions predicted based on the use of in vitro iTreg were consistent with the antigen-specific and spatiotemporal restriction of suppression observed in the TDLN. In addition, as is the case with all studies examining so-called nTreg, these nTreg were assumed to be contaminated by a fraction of endogenous in vivo iTreg cells which we estimate to be 10-20% of all splenic Treg. A recently developed model deficient in iTreg strongly suggests that these endogenous iTreg may be specific for exogenous antigens found in mucosal tissues.Citation28 Our studies, and the lack of distinguishing characteristics between in vivo iTreg and nTreg,Citation23 suggest that the effect of this contaminating fraction of iTreg may be less related to the ontogeny of the populations than to the antigen specificity of the cells in question.
These data indicate that for chemically induced sarcomas, the frequency of nTreg and iTreg within the tumor microenvironment approximates the balance found in peripheral tissues, but does not contain a predominance of iTreg such as is found in the gut. In contrast, antigen-specific iTreg preferentially accumulate within tumors expressing a defined non-self antigen (ovalbumin), providing proof-of-concept in an artificial setting that specific antigens play an instructive role in the accumulation of cognate-antigen matched iTreg. Despite the similarity in frequency of polyclonal iTreg isolated from the sarcoma microenvironment and splenic polyclonal iTreg, intratumoral iTreg were demonstrated to express a distinct profile of TCR Vβ sequences. The distinct TCR repertoire utilized by Treg in the TDLN of chemically induced sarcomas as compared to Treg isolated from the spleens of the same mice indicates that even in the absence of an experimentally defined TSA, unique antigens expressed within the tumor microenvironment instruct the accumulation of a distinct population of iTreg, as was previously reported by Zhou and Levitsky but more recently challenged by Hindley et al.Citation9,Citation11
The majority of therapeutic cancer vaccines in clinical testing aim to stimulate monoclonal populations of TSA-specific T cells toward a pre-defined TSA administered together with an adjuvant. Thus, therapeutic immunity is dependent upon appropriate activation of TSA-specific T cells, trafficking of those T cells to the tumor microenvironment, presentation of the same TSA upon tumor cells and destruction of those tumor cells by the TSA-specific T cell population. These studies indicate that TSA can support the induction of TSA-specific iTreg in vivo, and that these TSA-specific iTreg preferentially accumulate in the tumor microenvironment. In tumor free mice, it was demonstrated that cognate-antigen matched in vitro iTreg are more potent suppressors of vaccine-stimulated T cell immunity than antigen-mismatched Treg, and that this suppression is specific to the site where cognate antigen specific Treg accumulate and exerted via suppression of an antigen-presenting cell intermediate. In E.G7 tumor bearing mice, ovalbumin-specific OT-II iTreg were spontaneously induced from adoptively transferred OT-II Tconv and detected in the TDLN. When E.G7 tumor bearing mice were subsequently immunized with ova/alum, the remaining OT-II Tconv underwent clonal expansion in the peritoneal cavity and distributed to the spleen and mLN but not in the TDLN. In contrast, the spontaneously induced OT-II iTreg expanded in all tissues. The mechanism behind this observation is unclear, however it appears that the local availability of antigen (ova) within the tumor and TDLN may provide local support for the immunosuppressive activity of OT-II iTreg, which interfere with OT-II Tconv trafficking into the tumor bed, as has been described.Citation29
Interestingly, in tumor naïve mice, antigen-specific iTreg were incapable of suppressing the proliferation of vaccine-primed CD8+ T cells. In the presence of an established E.G7 tumor however, suppression of CD8+ T cells was observed to be more generalized than suppression of CD4+ cells and antigen-specific CD8+ T cell proliferation was only observed at the site of vaccination. Together, these observations indicate a disconnect in the suppressive mechanisms utilized to suppress CD4+ and CD8+ T cell immunity. As is widely known, the suppressive mechanisms utilized by Treg differ based on the experimental conditions utilized and may differ in vivo from what is observed from in vitro suppression assaysCitation30; these mechanisms remain under investigation.
Materials and Methods
Mice and cell lines
Wild type C57BL/6 mice were purchased from Charles River Laboratories (Wilmington, MA). Foxp3+RFP+ reporter mice on a B6 background (FIR mice, generously provided by Dr. Richard FlavellCitation31), FoxP3+GFP+ (generously provided by Dr. Alexander RudenskyCitation32,Citation33), OT-II and CD4-/- mice were bred in our animal facility. FIR mice were crossed to OT-II mice to generate OT-II/FIR mice, screened by flow cytometry for expression of Vα2, Vβ5 and FoxP3-RFP in the CD3+CD4+ gate and bred in our animal facility. Mice were used at 6-12 weeks of age and were maintained in pathogen-free conditions at the UM animal facilities. All animal use procedures were approved by the University of Miami Animal Care and Use Committee. The IC-1 sarcoma cell line was generated by cultured tumor explants generated in C57BL/6 mice by subcutaneous injection of 3-methylcholanthrene (Sigma, 50µg dissolved in peanut oil) as described.Citation34 Tumor explants were minced, digested with trypsin-EDTA (Life Technologies) for 5 min and cultured in IMDM supplemented with 10% fetal calf serum (Life Technologies). Both IC-1 and E.G7 tumor cell lines were maintained in IMDM supplemented with 10% fetal calf serum (Life Technologies).
Reagents, antibodies and flow cytometry
Commercial antibodies for use in flow cytometry and in vivo studies were purchased from BD Pharmingen, eBioscience or BioLegend. For flow cytometry analysis, single cell suspensions were prepared from spleen and lymph nodes. 106 cells were pre-blocked with anti-mouse CD16/CD32 and stained with different antibody combinations. Intracellular staining was performed according to standard procedures. Flow cytometric analysis was performed on a Becton Dickinson Fortessa instrument and DIVA or FlowJo software. Cell sorting was done using a FACSAria II cell sorter (BD) after enrichment of splenocytes for CD4+ T cells using the EasySep Mouse CD4+ T cell Pre-Enrichment Kit (Stem Cell Technologies). Suspensions of ovalbumin (crystallized chicken egg ovalbumin Grade V, Sigma) and aluminum sulphate (Sigma) were prepared as previously describedCitation35 and administered (66 µg/mouse unless otherwise indicated) by intraperitoneal injection.
In vitro Treg induction
Sorted CD4+Foxp3-RFP- cells (purity ≥99.5%) from FoxP3-RFP reporter mice were activated in vitro (106cells/ml) with plate-bound α-CD3 (clone 2C11, 2 μg/ml), TGF-β (5 ng/ml), retinoic acid (RA; 100 nM) and IL-2 (100U/ml) for 4 d to induce Treg cells (induction rate > 60% iTreg cells). After 4 d, the iTreg cells were sorted and used for adoptive transfer into CD4-/- mice.
Adoptive transfer models
For in vivo polyclonal iTreg cells experiments, Tconv from FoxP3-RFP reporter mice were high speed cell sorted by flow cytometry. Separately, nTreg cells (CD4+FoxP3+GFP+ cells) were sorted by flow cytometry from FoxP3+GFP+ reporter mice. Tconv (2×10⁶ cells) were mixed with nTreg cells expressing FoxP3+GFP+ isolated from FoxP3-GFP reporter mice (5×10⁵ cells) and adoptively transferred to CD4-/- recipient mice by tail vein injection in 100 µl HBSS. For in vivo TCR transgenic OVA323-339 specific iTreg cell experiments, Tconv from OT-II/FIR mice were high speed cell sorted by flow cytometry on the basis of CD3+, CD4+, FoxP3-RFP- phenotype. Separately, nTreg cells (CD4+FoxP3+GFP+ cells) were sorted by flow cytometry from FoxP3-GFP reporter mice. OT-II Tconv (2×10⁶ cells) were mixed with nTreg cells-FoxP3+GFP+ cells isolated from FoxP3-GFP reporter mice (5×10⁵ cells) and adoptively transferred to CD4-/- recipient mice by tail vein injection in 100 µl HBSS.
In vivo suppression assays
For analysis of Treg suppressive activity in vivo; polyclonal iTreg or OT-II iTreg were generated in vitro as described above and purified by high-speed cell sorting. nTreg were purified directly from splenocytes as described above. The indicated Treg population (7.5×10⁵ cells) was mixed with both OT-II Tconv (7.5×10⁵ cells) and OT-I cells (5×10⁵ cells) and adoptively transferred to FIR mice. 24 hours after adoptive transfer, recipient mice were immunized with ova/alum. On the indicated day post-immunization, tissues were isolated, cells counted and analyzed by flow cytometry.
CDR3 size and sequence analysis
Primers for Vβ (Table S1) spectratyping and the determination of CDR3 lengths have been previously described.Citation13,Citation14,Citation36 Total RNA from highly purified CD4+FoxP3+ Treg cells was isolated using TRIzol reagent (Invitrogen) according to manufacturers instruction. Reverse transcription was performed using oligo-d(T)16 primer, Superscript III (Invitrogen) and buffer containing 5 mM DTT (Invitrogen) and 20 U RNasin (Promega). PCR conditions were: denaturation (1 min, 95C), followed by 40 cycles at 95C for 1 min, 60C for 1 min and 72C for 1 min. For Vβ spectratyping, 0.5 µl of the PCR reaction was subjected to a second round of PCR for 30 cycles using the conditions described above. The Jβ1.1 primers used during the second PCR reaction were labeled with 5’-6-FAM and used together with the specific Vβ region primer described previously. After amplification, PCR products were diluted 1:20 in distilled water and 0.5 µl of the diluents were loaded to ABI Prism 3730xl DNA analyzers (Applied Biosystems). Fragment analysis sample files were analyzed with Peak Scanner software (Applied Biosystems).
Spectratype data analysis
The method used to quantify skewing of the TCR repertoire has been described previously and is represented as diversity (D) scores.Citation13,Citation15 Briefly, fluorescent intensity (peak height) was measured using Peak Scanner software for each peak in an individual Vβ spectratype and transferred to Excel (Microsoft) spreadsheets. The representation of each individual peak was calculated as a percentage of the sum of all peak heights within each Vβ profile. These calculations were initially performed for a splenocyte-derived Treg (5×10⁶ cells) "reference" profile that is estimated to exceed the total possible TCR diversity of all Treg in an individual mouse, and followed a Gaussian distribution characteristic of a highly diverse TCR repertoire. This was repeated for five individual mice and the results for each Vβ segment were individually pooled and averaged; the resulting spectratypes were subsequently considered the ‘reference’ sample for each Vβ. For the experimental samples, the absolute difference in the percent-representation of each peak within a given Vβ was compared to the reference sample, summed and then divided by two. This value represents the extent that the repertoire varied from the reference for an individual Vβ profile. The D score represents the mean of these values for each of the Vβ segments for each individual sample.
Statistical analysis
All graphing and statistical analysis were performed using the ABI Prism program. Paired analysis was performed using the students T test. Analysis of conditions with more than two conditions was performed using one-way ANOVA with Tukey post-test. Significance is indicated as * (p<0.05), ** (p<0.01) and *** (p<0.001).
Additional material
Download Zip (620 KB)Disclosure of Potential Conflicts of Interest
No potential conflicts of interest were disclosed.
Acknowledgments
Financial support provided by NCI-5PO1CA109094-, NIAID-5RO1AI061807and NIAID 5R33 AI073234 to Eckhard R. Podack and a Bankhead-Coley Postdoctoral Fellowship to Taylor H. Schreiber.
Supplemental Materials
Supplemental material can be found at:
http://www.landesbioscience.com/journals/oncoimmunology/article/20298
References
- Kantoff PW, Higano CS, Shore ND, Berger ER, Small EJ, Penson DF, et al, IMPACT Study Investigators. Sipuleucel-T immunotherapy for castration-resistant prostate cancer. N Engl J Med 2010; 363:411 - 22; http://dx.doi.org/10.1056/NEJMoa1001294; PMID: 20818862
- Robert C, Thomas L, Bondarenko I, O’Day S, M D JW, Garbe C, et al. Ipilimumab plus dacarbazine for previously untreated metastatic melanoma. N Engl J Med 2011; 364:2517 - 26; http://dx.doi.org/10.1056/NEJMoa1104621; PMID: 21639810
- Matsushita H, Vesely MD, Koboldt DC, Rickert CG, Uppaluri R, Magrini VJ, et al. Cancer exome analysis reveals a T-cell-dependent mechanism of cancer immunoediting. Nature 2012; 482:400 - 4; http://dx.doi.org/10.1038/nature10755; PMID: 22318521
- DuPage M, Mazumdar C, Schmidt LM, Cheung AF, Jacks T. Expression of tumour-specific antigens underlies cancer immunoediting. Nature 2012; 482:405 - 9; http://dx.doi.org/10.1038/nature10803; PMID: 22318517
- Vesely MD, Kershaw MH, Schreiber RD, Smyth MJ. Natural innate and adaptive immunity to cancer. Annu Rev Immunol 2011; 29:235 - 71; http://dx.doi.org/10.1146/annurev-immunol-031210-101324; PMID: 21219185
- Sakaguchi S, Yamaguchi T, Nomura T, Ono M. Regulatory T cells and immune tolerance. Cell 2008; 133:775 - 87; http://dx.doi.org/10.1016/j.cell.2008.05.009; PMID: 18510923
- Nishikawa H, Kato T, Tanida K, Hiasa A, Tawara I, Ikeda H, et al. CD4+ CD25+ T cells responding to serologically defined autoantigens suppress antitumor immune responses. Proc Natl Acad Sci U S A 2003; 100:10902 - 6; http://dx.doi.org/10.1073/pnas.1834479100; PMID: 12947044
- Nishikawa H, Kato T, Tawara I, Saito K, Ikeda H, Kuribayashi K, et al. Definition of target antigens for naturally occurring CD4(+) CD25(+) regulatory T cells. J Exp Med 2005; 201:681 - 6; http://dx.doi.org/10.1084/jem.20041959; PMID: 15753203
- Hindley JP, Ferreira C, Jones E, Lauder SN, Ladell K, Wynn KK, et al. Analysis of the T-cell receptor repertoires of tumor-infiltrating conventional and regulatory T cells reveals no evidence for conversion in carcinogen-induced tumors. Cancer Res 2011; 71:736 - 46; http://dx.doi.org/10.1158/0008-5472.CAN-10-1797; PMID: 21156649
- Zhou G, Drake CG, Levitsky HI. Amplification of tumor-specific regulatory T cells following therapeutic cancer vaccines. Blood 2006; 107:628 - 36; http://dx.doi.org/10.1182/blood-2005-07-2737; PMID: 16179369
- Zhou G, Levitsky HI. Natural regulatory T cells and de novo-induced regulatory T cells contribute independently to tumor-specific tolerance. J Immunol 2007; 178:2155 - 62; PMID: 17277120
- Bilate AM, Lafaille JJ. Induced CD4(+)Foxp3(+) Regulatory T Cells in Immune Tolerance. Annu Rev Immunol 2011; PMID: 22224762
- Adeegbe D, Matsutani T, Yang J, Altman NH, Malek TR. CD4(+) CD25(+) Foxp3(+) T regulatory cells with limited TCR diversity in control of autoimmunity. J Immunol 2010; 184:56 - 66; http://dx.doi.org/10.4049/jimmunol.0902379; PMID: 19949075
- Pannetier C, Cochet M, Darche S, Casrouge A, Zöller M, Kourilsky P. The sizes of the CDR3 hypervariable regions of the murine T-cell receptor beta chains vary as a function of the recombined germ-line segments. Proc Natl Acad Sci U S A 1993; 90:4319 - 23; http://dx.doi.org/10.1073/pnas.90.9.4319; PMID: 8483950
- Gorochov G, Neumann AU, Kereveur A, Parizot C, Li T, Katlama C, et al. Perturbation of CD4+ and CD8+ T-cell repertoires during progression to AIDS and regulation of the CD4+ repertoire during antiviral therapy. Nat Med 1998; 4:215 - 21; http://dx.doi.org/10.1038/nm0298-215; PMID: 9461196
- Robins HS, Campregher PV, Srivastava SK, Wacher A, Turtle CJ, Kahsai O, et al. Comprehensive assessment of T-cell receptor beta-chain diversity in alphabeta T cells. Blood 2009; 114:4099 - 107; http://dx.doi.org/10.1182/blood-2009-04-217604; PMID: 19706884
- Huter EN, Stummvoll GH, DiPaolo RJ, Glass DD, Shevach EM. Cutting edge: antigen-specific TGF beta-induced regulatory T cells suppress Th17-mediated autoimmune disease. J Immunol 2008; 181:8209 - 13; PMID: 19050237
- Selvaraj RK, Geiger TL. Mitigation of experimental allergic encephalomyelitis by TGF-beta induced Foxp3+ regulatory T lymphocytes through the induction of anergy and infectious tolerance. J Immunol 2008; 180:2830 - 8; PMID: 18292504
- Zhang H, Podojil JR, Chang J, Luo X, Miller SD. TGF-beta-induced myelin peptide-specific regulatory T cells mediate antigen-specific suppression of induction of experimental autoimmune encephalomyelitis. J Immunol 2010; 184:6629 - 36; http://dx.doi.org/10.4049/jimmunol.0904044; PMID: 20483764
- Davidson TS, DiPaolo RJ, Andersson J, Shevach EM. Cutting Edge: IL-2 is essential for TGF-beta-mediated induction of Foxp3+ T regulatory cells. J Immunol 2007; 178:4022 - 6; PMID: 17371955
- Hänig J, Lutz MB. Suppression of mature dendritic cell function by regulatory T cells in vivo is abrogated by CD40 licensing. J Immunol 2008; 180:1405 - 13; PMID: 18209035
- Misra N, Bayry J, Lacroix-Desmazes S, Kazatchkine MD, Kaveri SV. Cutting edge: human CD4+CD25+ T cells restrain the maturation and antigen-presenting function of dendritic cells. J Immunol 2004; 172:4676 - 80; PMID: 15067041
- Haribhai D, Williams JB, Jia S, Nickerson D, Schmitt EG, Edwards B, et al. A requisite role for induced regulatory T cells in tolerance based on expanding antigen receptor diversity. Immunity 2011; 35:109 - 22; http://dx.doi.org/10.1016/j.immuni.2011.03.029; PMID: 21723159
- Huter EN, Punkosdy GA, Glass DD, Cheng LI, Ward JM, Shevach EM. TGF-beta-induced Foxp3+ regulatory T cells rescue scurfy mice. Eur J Immunol 2008; 38:1814 - 21; http://dx.doi.org/10.1002/eji.200838346; PMID: 18546144
- Davidson TS, Shevach EM. Polyclonal Treg cells modulate T effector cell trafficking. Eur J Immunol 2011; 41:2862 - 70; http://dx.doi.org/10.1002/eji.201141503; PMID: 21728170
- DiPaolo RJ, Brinster C, Davidson TS, Andersson J, Glass D, Shevach EM. Autoantigen-specific TGFbeta-induced Foxp3+ regulatory T cells prevent autoimmunity by inhibiting dendritic cells from activating autoreactive T cells. J Immunol 2007; 179:4685 - 93; PMID: 17878367
- Godebu E, Summers-Torres D, Lin MM, Baaten BJ, Bradley LM. Polyclonal adaptive regulatory CD4 cells that can reverse type I diabetes become oligoclonal long-term protective memory cells. J Immunol 2008; 181:1798 - 805; PMID: 18641317
- Josefowicz SZ, Niec RE, Kim HY, Treuting P, Chinen T, Zheng Y, et al. Extrathymically generated regulatory T cells control mucosal TH2 inflammation. Nature 2012; 482:395 - 9; http://dx.doi.org/10.1038/nature10772; PMID: 22318520
- Quezada SA, Peggs KS, Simpson TR, Shen Y, Littman DR, Allison JP. Limited tumor infiltration by activated T effector cells restricts the therapeutic activity of regulatory T cell depletion against established melanoma. J Exp Med 2008; 205:2125 - 38; http://dx.doi.org/10.1084/jem.20080099; PMID: 18725522
- Shevach EM. Mechanisms of foxp3+ T regulatory cell-mediated suppression. Immunity 2009; 30:636 - 45; http://dx.doi.org/10.1016/j.immuni.2009.04.010; PMID: 19464986
- Wan YY, Flavell RA. Identifying Foxp3-expressing suppressor T cells with a bicistronic reporter. Proc Natl Acad Sci U S A 2005; 102:5126 - 31; http://dx.doi.org/10.1073/pnas.0501701102; PMID: 15795373
- Fontenot JD, Rasmussen JP, Williams LM, Dooley JL, Farr AG, Rudensky AY. Regulatory T cell lineage specification by the forkhead transcription factor foxp3. Immunity 2005; 22:329 - 41; http://dx.doi.org/10.1016/j.immuni.2005.01.016; PMID: 15780990
- Fontenot JD, Gavin MA, Rudensky AY. Foxp3 programs the development and function of CD4+CD25+ regulatory T cells. Nat Immunol 2003; 4:330 - 6; http://dx.doi.org/10.1038/ni904; PMID: 12612578
- Kaplan DH, Shankaran V, Dighe AS, Stockert E, Aguet M, Old LJ, et al. Demonstration of an interferon gamma-dependent tumor surveillance system in immunocompetent mice. Proc Natl Acad Sci U S A 1998; 95:7556 - 61; http://dx.doi.org/10.1073/pnas.95.13.7556; PMID: 9636188
- Fang L, Adkins B, Deyev V, Podack ER. Essential role of TNF receptor superfamily 25 (TNFRSF25) in the development of allergic lung inflammation. J Exp Med 2008; 205:1037 - 48; http://dx.doi.org/10.1084/jem.20072528; PMID: 18411341
- Matsutani T, Ohmori T, Ogata M, Soga H, Kasahara S, Yoshioka T, et al. Comparison of CDR3 length among thymocyte subpopulations: impacts of MHC and BV segment on the CDR3 shortening. Mol Immunol 2007; 44:2378 - 87; http://dx.doi.org/10.1016/j.molimm.2006.10.026; PMID: 17156844