Abstract
Rac1, a ubiquitously expressed member of the Rho GTPase family, plays a pivotal role in the regulation of multiple cellular processes including cytoskeleton reorganization, cell growth, differentiation and motility. Here we show that the tumor-specific splice variant of Rac1, Rac1b, negatively regulates Rac1 activity. The expression of Rac1b in HeLa cells interferes with Rac1 activation by PDGF, leads to a reduction in membrane-bound Rac1 and promotes an increase in Rho activity. The antagonistic relationship between Rac1 and Rac1b perturbs the regulatory circuitry that controls actin cytoskeleton dynamics thereby leading to tumor-linked alterations in cell morphology and motility.
Introduction
Rac proteins constitute a subgroup of the Rho family of small GTPases. Similar to all other small GTPases, Rac cycles between an inactive GDP-bound and an active GTP-bound state and the inter-conversion between these two states is tightly controlled by the relative rates of guanine nucleotide exchange and GTP hydrolysis.Citation1,Citation2 The exchange and hydrolytic activities are accelerated by guanine nucleotide exchange factors (GEFs) and GTPase activating proteins (GAPs), respectively. Rac is stabilized in the GDP-bound form and sequestered in the cytoplasm through the interaction with Rho-GDP dissociation inhibitors (GDI).Citation3 External cues such as growth factors and integrin ligands induce the recruitment of Rac to the plasma membrane which promotes the interaction of Rac with GEFs.Citation4 Activation of Rac by GEFs and its subsequent interaction with effectors initiates downstream signaling cascades that control a wide range of cellular functions, most notably, cytoskeletal reorganization, cell morphological changes and cell motility.
There are three Rac genes, namely, Rac1, Rac2, Rac3 and the alternative splice variant of Rac1, Rac1b. Although these proteins share 90% sequence identity, the variability in their C-terminal polybasic region provides specificity by regulating their membrane association, protein interactions and intracellular localization.Citation5 Further specificity occurs by transcriptional regulation and differential tissue distribution. While Rac1 is ubiquitously expressed, the expression of Rac2 and Rac3 is restricted to hematopoietic tissues and the central nervous system, respectively.Citation5 Endogenous Rac1b expression is considerably lower than endogenous Rac1.Citation6,Citation7 However, the expression of Rac1b, increases significantly in breast and colorectal tumorsCitation6,Citation7 and in most cell types where Rac1b is expressed, levels of active Rac1b are significantly higher than levels of active Rac1.Citation8–Citation11
Previous studies have identified biochemical and signaling properties of Rac1b that are distinct from or overlap with Rac1. For example, relative to Rac1, Rac1b displays a faster GDP/GTP exchange rate, an impaired GTPase activity and an inability to bind RhoGDI.Citation9 Additionally, Rac1b is defective in activation of two major downstream effectors of Rac1, p21-activated kinase (PAK) and c-Jun kinase (Jnk).Citation8 On the other hand, similarly to Rac1, Rac1b can stimulate NFκB,Citation8 AktCitation12 and ROS production.Citation13 The partial functional overlap between Rac1 and Rac1b raises the question of whether the expression of Rac1b impacts the signaling activity of Rac1. In this study, we have identified a role for Rac1b as a negative regulator of Rac1. This antagonistic effect of Rac1b leads to an alteration in cellular properties that may under-lie the role of Rac1b in tumor cells.
Results
Rac1b inhibits Rac1 activation.
In order to assess the functional relationship between Rac1 and Rac1b, we first examined whether Rac1b expression would affect growth factor-induced Rac1 activation. Serum-deprived HeLa cells transfected with HA-tagged Rac1b were treated with platelet-derived growth factor (PDGF) and the level of active Rac1 was examined by pulldown assay using a GST-fusion protein containing the p21 binding domain of PAK (PBD) ().Citation14 Consistent with the well-established effect of PDGF-induced activation of Rac1, PDGF treatment induced a time-dependent increase in the levels of GTP-bound Rac1. In contrast, the PDGF-induced accumulation of Rac1-GTP was abrogated in cells expressing Rac1b. A similar effect on Rac1-GTP was observed when Rac1b expressing cells were treated with epidermal growth factor (not shown). The abrogation of PDGF-mediated Rac1 activation persisted for up to 60 min post stimulation (not shown) indicating that the expression of Rac1b interferes with rather than delays Rac1 activation. These observations indicate that Rac1b can interfere with Rac1 activation. To ascertain that endogenous Rac1b can similarly be involved in the suppression of Rac1 activation, Rac1b expression was silenced using an RNA interference (RNAi) approach. As illustrated in , the level of Rac1-GTP increased when small hairpin RNA (shRNA) targeting Rac1b (shRac1b) was transfected into HeLa cells. Furthermore, when a Rac1b plasmid mutated at wobble codons within the shRNA-targeted region to render it resistant to RNAi-mediated cleavage was expressed, the suppression of Rac1 activation was restored. Thus, Rac1b appears to act as a negative regulator of Rac1.
Rac1b interferes with Rac1 localization in the plasma membrane.
We next sought to determine the mechanisms by which Rac1b might interfere with Rac1 activation. Because of its compromised GDI binding, Rac1b has been shown to localize constitutively to the plasma membrane.Citation8 This raises the possibility that Rac1b could interfere with the membrane recruitment of Rac1. To test this idea, the membrane partitioning of Rac1 was assessed in the presence or absence of Rac1b. For these experiments, the constitutively active form of Rac1b, Rac1bV12, was used to minimize fluctuations in the levels of protein activity. Similar to Rac1b, Rac1bV12 was found to attenuate PDGF-induced Rac1 activation (Sup. Fig. 1). Serum-starved HeLa cells with or without Rac1bV12 expression were stimulated with PDGF and the extent of Rac1 membrane association was determined by subcellular fractionation and fluorescence microscopy. As illustrated in and B, the PDGF-induced recruitment of endogenous Rac1 to the membrane fraction was significantly reduced following the expression of Rac1bV12. To ascertain that the Rac1bV12-induced decrease in membrane-associated Rac1 reflects, at least in part, the plasma-membrane pool of Rac1, the subcellular distribution of GFP-Rac1 was analyzed in PDGF-treated Hela cells in the presence or absence of Rac1bV12. In agreement with the cell fractionation data, the abundance of Rac1 in the plasma membrane was reduced upon the expression of Rac1bV12 (). Together, these results indicate that Rac1b interferes with the membrane targeting of Rac1. This interpretation is further supported by the observation that Rac1b knockdown led to an increase in PDGF-dependent membrane association of Rac1 (). Since the activity of Rac1 depends on its reversible association with the plasma membrane, our findings indicate that Rac1b may inhibit Rac1 activation by limiting the availability of Rac-targeting sites in the membrane.
Rac1b perturbs the interplay between Rac1 and Rho.
We and others have shown that Rac1 activation leads to the downregulation of Rho.Citation15–Citation19 In view of the observed antagonistic relationship between Rac1 and Rac1b, Rac1b expression would be predicted to influence Rho activity. To test this prediction, we examined Rho activity in cells coexpressing Rac1V12 and Rac1bV12. We utilized an inducible HeLa Tet-off cell line (HTO-Rac1V12) in which expression of Rac1V12 can be induced by tetracycline (Tet) removal from culture media.Citation19 Rac1bV12 plasmid was transfected into HTO-Rac1V12 cells in the presence of Tet. Twenty-four hours after transfection, Tet was removed. The level of Rho activity was measured by Rho-pulldown assay in which GTP-bound Rho is selectively isolated by using the Rho-binding region of Rhotekin.Citation20 As illustrated in , the ability of Rac1V12 to downregulate Rho was compromised in the presence of Rac1bV12. Of note, the slight increase in Rho activity detected upon the expression Rac1bV12 alone might reflect the interference with endogenous Rac1 activity. Moreover, when Rac1b levels were silenced by shRac1b, there was a 70% loss in Rho activity (). Together, these results indicate that Rac1b blocks the Rac1-induced downregulation of Rho.
Rac1b phenotype is dependent upon the Rho pathway.
The balance between the activities of Rac and Rho plays a critical role in dictating cytoskeletal dynamics.Citation15–Citation19,Citation21 Because Rac1b induces perturbations in the relative activities of Rac and Rho, we tested whether its expression would alter these dynamics. As demonstrated in , HeLa cells expressing Rac1bV12 displayed distinct cytoskeletal-based phenotypes. In sparsely plated cells, moderate levels of ectopically expressed Rac1bV12 were accompanied by the generation of actin-rich protrusions (), whereas high levels of Rac1bV12 expression were associated with the induction of persistent membrane blebbing (). Both phenotypes were abolished upon attenuation of the Rho axis. Specifically, Rac1bV12-induced membrane protrusions were significantly reduced in the presence of a dominant negative form of Rho, RhoAN19 (), and the induction of membrane blebbing by Rac1bV12 was blocked when cells were treated with Y-27632, an inhibitor of Rho-associated-kinase (ROCK), a Rho downstream effector (). Taken together, these results are consistent with our biochemical data showing that Rac1b expression leads to a predominance of Rho activity which in turn alters cytoskeletal reorganization and cellular phenotypes. Of note, the expression of Rac1bV12 was not accompanied by the induction of stress fibers, a well established phenotype of activated Rho.Citation22 This observation is not unprecedentedCitation23,Citation24 and could possibly reflect other downstream Rac1b-mediated activities that interfere with stress fiber formation. The identity of these pathways remain to be established.
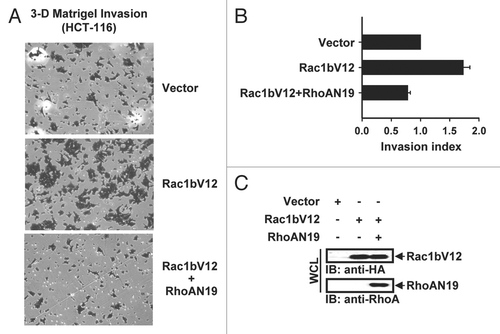
Rac1b promotes an invasive phenotype of colon cancer cells.
Rac1b has been shown to be upregulated in colon cancer both at early and late stage of disease.Citation6 Additionally, activation of the Rho-ROCK pathway is sufficient to promote invasion of colon cancer cells.Citation25 Therefore, we examined the contribution of Rac1b expression to the invasive phenotype of colon cancer cells. We have selected for this analysis HCT-116 cells because the expression of Rac1b in these cells is low relative to other colon cancer cell lines (Sup. Fig. 2). The cells were transfected with Rac1bV12 and subjected to a cell invasion assay utilizing a Matrigel-coated Boyden chamber. As shown in and B, HCT-116 cells expressing Rac1bV12 migrated approximately 2-fold faster than control cells and this effect was negated in the presence of RhoAN19. These results indicate that by preventing the downregulation of Rho, Rac1b expression may enhance cell invasion. Additionally, in light of studies documenting membrane blebbing as a mode of cellular invasion promoted through ROCK,Citation26 the capacity of Rac1b to induce membrane blebs could also contribute to the invasiveness of Rac1b expressing cells.
Discussion
The Rho family of GTPases has been implicated in the promotion of cancer through diverse mechanisms that include dysregulated proliferation, and enhanced migration and metastasis. While typically not harboring genetic mutations, many members of this family, such as Rho A, B, C, E, G, Rac 1, 2, 3 and Cdc42 have been found overexpressed or hyperactivated in a large variety of tumors.Citation27,Citation28 For example, RhoA expression has been found to be upregulated in colorectal, liver and skin cancers.Citation29–Citation31 Similarly, overexpression of Rac1 is observed in testicular, gastric and breast cancers.Citation30,Citation32 The recently identified member of the Rho family, Rac1b, has been found to be elevated in breastCitation7 and colon cancer,Citation6 but the functional significance of this molecular event has not been fully elucidated. Here we demonstrate that Rac1b expression leads to the downregulation of Rac1 activity and, as a consequence, the upregulation of Rho activity. We propose that the Rac1b-dependent increase in Rho activity might constitute an effector mechanism by which Rac1b promotes tumor cell invasion.
It is now well established that the antagonistic relationship between members of the Rho GTPase family regulate the biological output of their mutual activities.Citation17–Citation19 In many cell types, transient Rho downregulation is necessary for Rac-induced cell motility and morphological changes.Citation15–Citation19 For example, in neuronal cells, Tiam1-induced activation of Rac antagonizes Rho signaling during neurite outgrowth,Citation16 and we have previously demonstrated that Rac1-induced transient downregulation of Rho is necessary for epithelial and fibroblast cell spreading and migration.Citation19 Reciprocally, it has been demonstrated that the activity of Rho can antagonize Rac. For example, the Rho/ROCK pathway phosphorylates and activates FilGAP, a Rac GAP, which results in suppression of Rac activity, lamellipodia formation and cell spreading.Citation21 The findings described in this study introduce another level of regulation of the interplay between Rac and Rho activities by demonstrating that Rac1b can antagonize the activation of Rac1.
By and large, the membrane association of Rac1 is a prerequisite for its activation. Similar to other members of the Rho GTPase family, the C-terminus of Rac is modified by a geranyl-geranyl moiety and a polybasic motif which target it to the plasma membrane.Citation33 A growing body of evidence demonstrates that Rac1 localization in the plasma membrane is compartmentalized. For example, Rac1 has been shown to interact preferentially with cholesterol-enriched domains within the plasma membrane.Citation34,Citation35 Additionally, the pool of activated Rac molecules appears to be confined to membrane areas that display high levels of integrin activation.Citation36 Thus the productive recruitment of Rac1 to the plasma membrane may be dependent on its interaction with a specific set of predetermined binding sites. In the setting of Rac1b expression, the availability of these sites might become limiting owing to the fact that Rac1b does not bind Rho-GDI, and therefore is constitutively bound to the plasma membrane. Consistent with this idea, we have found that Rac1b interferes with both growth-factor induced Rac1 localization at the plasma membrane and Rac1 downstream signaling. Thus, the antagonistic effect of Rac1b on Rac1 could represent a novel dominant interfering mechanism involving the competitive displacement of Rac1 from the membrane.
ROCK activation has been implicated in a wide spectrum of cellular processes that are linked to cancer invasion and metastasis. ROCK stabilizes actin filaments and activates actomyosin formation and contractility, and these activities are required for cell migration through extracellular matrix.Citation22 ROCK also causes disruption of adherens junctionsCitation37 and induces tumor cell dissemination and angiogenesis in vivo.Citation25 Our data indicate that Rac1b may promote the activation of the Rho-ROCK axis which in turn may contribute to the invasive behavior of Rac1b expressing cells. This conclusion is supported by the observation that Rac1b induces a ROCK-dependent blebbing phenotype that has been shown to endow the cell with the capability to invade through extracellular matrix in an amoeboidal-like, proteolysis-independent style.Citation26,Citation38 Furthermore, Rac1b promotes the invasion of colon cancer cells in a Rho-dependent manner. Since Rac1b is overexpressed in colon cancer, its capacity to enhance the Rho/ROCK pathway might be functionally linked to the acquisition of invasive properties during colon cancer progression.
In summary, our findings define a new pathway leading to a gain in Rho function through the expression of Rac1b, which in turn inhibits Rac1-dependent downregulation of Rho. Given the accumulating evidence implicating Rho in tumor cell migration and invasion, our findings suggest that the status of Rac1b expression in tumors may constitute an important determinant of their metastatic phenotype.
Materials and Methods
Constructs and antibodies.
Constructs encoding hemagglutinin (HA)-tagged Rac1 and Rac1 G12V mutant (Rac1V12) were subcloned into pCGN vector between the Xba1 and BamHI restriction sites from pCGTRac1 and Rac1V12 (generous gifts from Dr. Linda Van Aelst). pCGN-Rac1b construct was generated by introduction of an annealed oligonucleotide of the Rac1b exon3b insertion into pCGN-Rac1 construct. HA-tagged Rac1bV12 construct was generated by site-directed PCR mutagenesis of pCGN-Rac1b. pEGFP-Rac1bV12 construct was generated by subcloning from pCGN-Rac1bV12 into the pEGFP-C3 (Clontech 6082-1) vector. pCDNA3-RhoAN19 was kindly provided by Dr. Alan Hall. All engineered constructs were confirmed by sequencing. The targeting sequence for knockdown of Rac1b and scramble sequence were designed by Promega siRNA Target designer for U6 Hairpin Cloning System: Rac1b, 5′-GAA ACG TAC GGT AAG GAT A; scramble, 5′-GCA GAG TAG ATA AGC TGA A. The Rac1b shRNA or scramble shRNA was ligated into the pSUPER vector (a kind gift from Dr. Guangwei Du) modified with insertion of a blasticidin selective marker of pcDNA. The Rac1b wobble construct was generated by introducing 5 nucleotide substitutions at the wobble positions (underlined) 5′-CAG TTG GAG AGA CAT ATG GGA AAG ATA TAA CCT CCC-3′ and 5′-GGG AGG TTA TAT CTT TCC CAT ATG TCT CTC CAA CTG-3′ and was subcloned into pCGN vector. The following antibodies were used: anti-HA monoclonal antibody (12CA5), anti-Rac1 antibody (BD Biosciences, BD610650), anti-Flotillin-1 antibody (BD Transduction Lab, 610821), anti-RhoA antibody (Santa Cruz, sc-418).
Cell culture, transfection and growth factor stimulation.
HeLa and HCT-116 cells were cultured in Dulbecco modified eagle medium (DMEM, Invitrogen, 11965) supplemented with 10% fetal bovine serum (FBS) (Invitrogen, 10438). Inducible expression of T7-tagged Rac1V12 in the HeLa Tet-Off system (HTO-Rac1V12) has been previously reported in reference Citation19. HTO-Rac1V12 cells were cultured in DMEM supplemented with 10% FBS and tetracycline (1 ng/ml, MP Biomedicals, ICN10301105) to repress protein expression. All cells were cultured at 37°C in the presence of humidified 5% CO2. HTO-Rac1V12 cells were transfected with CaPO4 by standard procedure. HCT-116 cells were transfected using Lipofectamine 2000 (Invitrogen, 11668). HeLa cells were transfected using Fugene 6 (Roche, 11815075001). For shRNA knockdown experiments, 24 h after transfection, cells were selected using 10 µg/ml blasticidin (Invitrogen, R210) for 3 days. For PDGF stimulation, 1 day after transfection, cells were serum starved for 18 h then incubated with PDGF stimulation medium DMEM, 0.1% bovine serum albumin (BSA, Sigma, A7906) containing recombinant human PDGF-BB (Fitzgerald Industries International Inc., 30R-AP004) at 37°C for the indicated intervals.
Cell morphology assays.
In brief, HeLa cells were seeded to approximately 50% confluency, transfected 24 hr later with pEGFP, pEGFP-Rac1bV12 or pEGFP-Rac1V12 using Fugene 6 reagent. Transfected cells were incubated for 24 hr prior to fixation and staining for F-actin using rhodamine-phalloidin (Molecular Probes, R415). Images were captured by fluorescence microscopy. Alternatively, cells were co-transfected with pEGFP and either pCGN vector, pCGN-Rac1bV12, pCGN-RhoAN19 or pCGN-Rac1bV12 + pCGN-RhoAN19. Twenty-four hours after transfection, the cells were fixed and stained as described above. F-actin was observed using fluorescence microscopy. For Y-27632 treatment, cells were co-transfected with pEGFP + pCGN vector or + pCGN-Rac1bV12. Twenty-four hours after transfection, cells were treated with Y-27632 (10 µM, Calbiochem, 688000) for 4 hr. Blebbing cells were scored using live imaging.
Rho activity assay.
Preparation of the GST-fusion protein containing the Rho-binding domain of Rhotekin (GST-RBD) and Rho activity assay were performed as previously described in reference Citation19. In brief, the GST-RBD fusion protein was purified from bacterial cells in ice-cold buffer containing 10 mM Tris (pH 8, Fisher, BP152), 150 mM NaCl (Fisher, S640), 1 mM EDTA (Fisher, S311) and 1 mM PMSF (Pierce, 36978). The cell suspension was incubated with lysozyme (100 µg/ml, Fisher, BP535) for 15 min and 5 mM DTT (Invitrogen, 15508013), 1% Tween-20 (Fisher, BP337) and 0.03% SDS (Fisher, BP166) were sequentially added. Cell lysates were clarified by centrifugation and the GST-fusion protein was isolated by incubating with glutathione sepharose beads (Pierce, 15160) for 5 min while gently inverting at room temperature. For Rho activity assay, equal numbers of HeLa cells were lysed in ice-cold lysis buffer (50 mM Tris, pH 7.2, 1% Triton X-100 (Sigma, x100), 0.5% sodium deoxycholate (Sigma, D6750), 0.1% SDS, 500 mM NaCl, 10 mM MgCl2 (Fisher, M33), 10 ug/ml each of leupeptin (Calbiochem, 108975) and aprotinin (MP Biomedicals, IC19115825) and 1 mM PMSF). The lysates were clarified by centrifugation for 5 min at 14,000x g. Cell lysates were normalized for the amount of protein and aliquots were taken to analyze the protein amounts by immunoblotting. The lysates were incubated with glutathione sepharose-conjugated GST-fusion RBD protein for 1 h at 4°C. The proteins bound to the sepharose-conjugated fusion protein were washed and eluted with Laemmli buffer. The eluted Rho proteins were resolved by SDS-PAGE and analyzed by immunoblotting using a monoclonal mouse anti-RhoA antibody. Densitometric analysis was performed using NIH image version 1.61. Fold activation was calculated by normalizing each activated RhoA lane to the corresponding total RhoA lane and assigning a value of 1 to the experimental control.
Rac activity assay.
The GST-fusion protein containing the p21 (Cdc42/Rac1) binding domain of PAK (GST-PBD) was purified from bacterial cells in ice-cold buffer containing 10 mM Tris (pH 8), 150 mM NaCl, 1 mM EDTA and 1 mM PMSF. The cell suspension was incubated with lysozyme (100 µg/ml) for 15 min and 5 mM DTT, 1% Tween-20 and 0.03% SDS were sequentially added. Cell lysates were clarified by centrifugation and the GST-fusion protein was isolated by incubating with glutathione sepharose beads for 5 min while gently inverting at room temperature. The Rac activity assay was performed as previously described in reference Citation39. In brief, HeLa cells were washed twice with cold PBS supplemented with 1 mM MgCl2 and 0.5 mM CaCl2 (Sigma, 223506) and lysed in lysis buffer [50 mM Tris, pH 7.4, 10 mM MgCl2, 1% Nonidet P-40 (US Biological, N3500), 10% glycerol (Fisher, G33), 100 mM NaCl, 0.5% sodium deoxycholate, 10 mg/ml leupeptin, 1% aprotinin, 10 mg/ml pepstatin (MP Biomedicals, IC19536805), 1 mM phenylmethanesulfonyl fluoride, 10 mg/ml soybean trypsin inhibitor (MP Biomedicals, IC10111325), 10 mM benzamidine (EMD Biosciences, 80057-856)]. The lysates were clarified by centrifugation for 5 min at 14,000x g. Cell lysates were normalized for the amount of protein and aliquots were taken to analyze the protein amounts by immunoblotting. Cell lysates were incubated with either GST alone or GST-PBD (p21-binding domain) fusion protein-coupled to Sepharose beads at 4°C for 30 min. The proteins bound to the sepharose-conjugated fusion protein were washed and eluted with Laemmli buffer. The eluted Rac1 proteins were resolved by SDS-polyacrylamide gel electrophoresis (PAGE) and analyzed by immunoblotting using a monoclonal mouse anti-Rac1 antibody. Densitometric analysis was performed using NIH image version 1.61. Fold activation was calculated by normalizing each activated Rac1 lane to the corresponding total Rac1 lane and assigning a value of 1 to the experimental control.
Cell fractionation assay.
HeLa cells were treated with ice-cold hypotonic lysis buffer [20 mM HEPES pH 7.3 (Fisher, AC21500), 2 mM EDTA, 5% glycerol, 1 mM PMSF, 10 mg/ml leupeptin, 1% aprotinin, 10 mg/ml pepstatin, 10 mg/ml soybean trypsin inhibitor, 10 mM benzamidine, 10 mM sodium fluoride (Fisher, S299) and 1 mM sodium orthovanadate (Sigma, S6508)] on ice and dounce homogenized. Nuclei were pelleted by centrifugation at 2,000 rpm for 10 min and the supernatant was collected for ultracentrifugation. The supernatant was centrifuged at 100,000 g at 4°C for 90 min, and the supernatant was saved as a cytosolic fraction. The pellets (membrane fraction) were solubilized and equal volumes of each sample was removed, added to 5x SDS buffer, resolved by SDS-PAGE and analyzed by immunoblotting. For WCL, the samples were taken prior to dounce homogenization, combined with 5x SDS buffer and resolved by SDS-PAGE. Densitometric analysis was performed using NIH image version 1.61.
Fluorescence microscopy.
Cells were fixed in 3.7% formaldehyde (Fisher, F79)/PBS for 1 h, permeabilized with 0.1% Triton X-100 for 3 min, and blocked with 1% bovine serum albumin (BSA)/PBS for 5 min. Rhodamine-conjugated phalloidin (Molecular Probes, R415) was diluted in 1% BSA/PBS and incubated for 1 h at 37°C in a humidified incubator. The coverslips were mounted using Immu-mount (Thermo, 9990402) containing 0.04% p-phenylenediamine (Sigma, P6001). The cells were photographed with a Zeiss Axiovert microscope.
Microinjection.
For microinjection, HeLa cells were cultured on gridded glass coverslips for 24 h then serum starved 18 h prior to injection. pEGFP-Rac1 combined with vector (pCGN) or pCGN-Rac1bV12 was prepared in microinjection buffer.Citation39 Plasmids were expressed for 3 h prior to stimulation with PDGF-BB (30 ng/ml, Fitzgerald Industries International Inc.,) for 10 min, then fixed and processed for indirect immunofluorescence to verify expression of Rac1bV12.
Semi-quantitative PCR.
Extraction of mRNA from total RNA was performed with Oligotex columns (Qiagen, 74104), according to the manufacturer's instructions. The resulting mRNA (2 µg) was reverse transcribed using oligo-dT primers and then amplified with primers directed to the 5′-untranslated region of Rac1 (5′-TTC CTA TCT CAG CGC CCT GCC) and 3′-in-frame insertion region of Rac1b (5′-CCC CGG GAG GTT ATA TCC TTA) using 30 cycles of 94°C for 30 s, 55°C for 1 min, 72°C for 1 min.
Cell invasion assay.
Matrigel (BD Biosciences, 354234) was thawed at 4°C overnight and diluted (1:4) in serum-free DMEM. 15 µl of the suspension was evenly coated on a 6.5 mm transwell membrane (8 µm pore size) of a Boyden chamber (BD Biosciences, 354578) and allowed to solidify at 37°C for 16 h. Two hours prior to use, 100 µl of DMEM was added to reconstitute the Matrigel barrier. Transfected HCT-116 cells were synchronized in G0 by serum starvation for 20 h. 5 × 10⁵ cells were resuspended in 400 µl of serum free DMEM and then applied to the upper chamber of the Matrigel-coated transwell filter. DMEM containing 10% FBS was applied to the lower chamber and the chamber was incubated for 36 h at 37°C in a humidified atmosphere of 5% CO2. Subsequently, non-migrating cells that remained on the upper surface of the filter were removed with cotton wool; the cells that appeared on the lower surface of the filter were fixed in 4% formaldehyde and then stained with crystal violet (MP Biomedicals, ICN15251150). The crystal violet was eluted with 10% acetic acid (Fisher, A38-212) and measured by spectrophotometry at OD 595. In each experiment, for each condition, triplicate transwells were analyzed.
Figures and Tables
Figure 1 Rac1b inhibits Rac1 activation. (A) HeLa cells were transfected with vector or HA-tagged Rac1b, serum-starved and then stimulated with PDGF (30 ng/ml) for the indicated intervals. GTP-bound Rac1 was isolated by the PBD pull-down assay and detected by immunoblotting (IB) with anti-Rac1 antibody. Total Rac1 and expression of Rac1b in whole cell lysates (WCL) were detected by IB with anti-Rac1 antibody. To calculate fold change, the levels of activated Rac1 were quantified by densitometry scanning and normalized to the levels of total Rac1. The results are representative of three independent experiments. Quantification of active Rac1 immunoblots of the 0 and 10 minute timepoints from three independent experiments are also shown (bottom). Results are the mean ± SD and are presented as the levels of active Rac1 relative to the respective time 0. (B and C) HeLa cells were transfected with pSuper constructs expressing scrambled shRNA (shControl) or shRNA targeting Rac1b (shRac1b). Cells were selected with blasticidin for 3 days, transfected with HA-tagged Rac1b wobble (Rac1b wobble) and serum-starved. (B) GTP-bound Rac1 was isolated by the PBD pull-down assay and immunoblotting (IB) and quantification (bottom) were done as in (A). Results are the mean ± SD and are presented as the levels of active Rac1 relative to the shControl at time 0. (C) Rac1b knockdown was determined by semi-quantitative PCR. RPLP1 was used as a control.
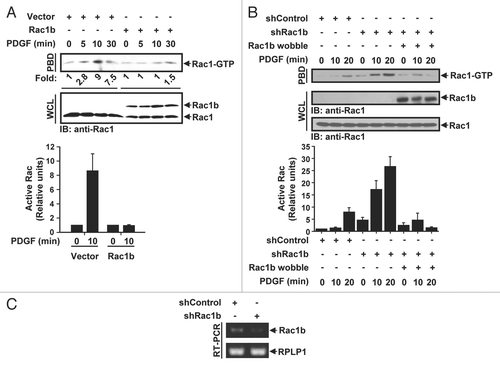
Figure 2 Rac1b inhibits Rac1 membrane recruitment. (A) HeLa cells transfected with vector or HA-tagged Rac1bV12 were serum-starved and PDGF-stimulated, then subjected to subcellular fractionation. Membrane-bound Rac1 and Rac1b were detected by immunoblotting (IB) with anti-Rac1 and anti-HA antibodies, respectively. Flotillin is a plasma membrane marker. Total Rac1 in whole cell lysates (WCL) was detected by IB with anti-Rac1 antibody. The levels of membrane-bound Rac1 were quantified by densitometry scanning and normalized to the levels of total Rac1. Quantification of membrane-associated Rac1 immunblots from three independent experiments are also shown (right). Results are the mean ± SD and are presented as the fold increase in membrane bound Rac1 relative to unstimulated vector. (B) Serum starved HeLa cells were co-microinjected with EGFP-Rac1 and vector (-Rac1bV12) or Rac1bV12. After 3 hours, cells were stimulated with PDGF (30 ng/mL) for 10 min, fixed and analyzed by fluorescence microscopy. Images shown represent a single 0.25 µm optical section. Plasma membrane localization is reflected by the relative increase in fluorescence intensity at the cell periphery. The entire cell periphery was observed and cells were scored as positive if at least 50% of the membrane periphery contained Rac1. The number of cells displaying plasma membrane localization of Rac1 is expressed as the percentage of the total number of cells expressing GFP-Rac1. Results are the mean ± SD of three independent experiments with at least 25 cells scored for each condition in each experiment. Scale bar represents 20 µm. (C) HeLa cells were transfected with pSuper constructs expressing scrambled shRNA (shControl) or shRNA targeting Rac1b (shRac1b). Cells were selected with blasticidin for 3 days and membranes were isolated by subcellular partitioning. Immunoblotting and quantification (right) were done as in (A). To detect Rac1 and Rac1b in WCL, 3% and 15%, respectively, of each sample was taken prior to subcellular partitioning and loaded on an SDS gel. Results are the mean ± SD of three independent experiments and are presented as the fold increase in membrane bound Rac1 relative to unstimulated shControl.
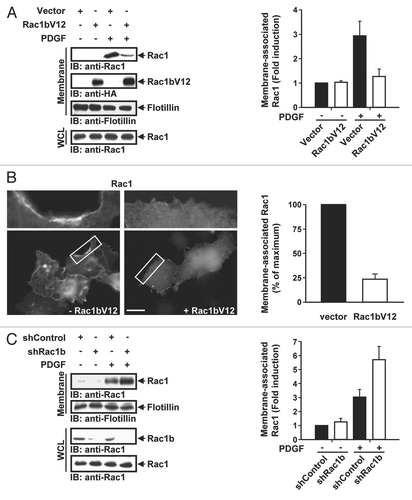
Figure 3 Rac1b modulates Rac1-mediated Rho activity. (A) HeLa Tet-off cells (HTO-Rac1V12),Citation19 were transfected with vector or Rac1bV12, as indicated, in the presence of tetracycline (Tet). Twenty-four hours after transfection, Tet was removed. After 24 hr, GTP-bound Rho was isolated by the RBD pull-down assay and detected by immunoblotting (IB) with anti-RhoA antibody. Total RhoA in whole cell lysates (WCL) was detected by IB with anti-RhoA antibody. Expression of Rac1V12 and Rac1bV12 was detected with anti-Rac1 antibody. The levels of activated Rho were quantified by densitometry scanning and normalized to the levels of total Rho. Quantification of active Rho immunoblots from three independent experiments are also shown (right). Results are the mean ± SD and are presented as the levels of active Rho relative to vector control. (B) HeLa cells were transfected with pSuper constructs expressing scrambled shRNA (shControl) or shRNA targeting Rac1b (shRac1b). Cells were selected with blasticidin for 3 days and GTP-bound Rho was isolated by the RBD pull-down assay. Immunoblotting (IB) and quantification (bottom) were done as in (A). Results are the mean ± SD and are presented as the levels of active Rho relative to shControl.
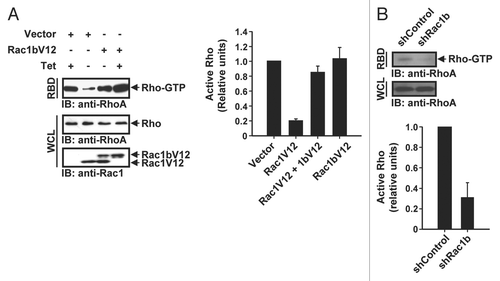
Figure 4 Rac1b modulates the dynamics of the actin cytoskeleton. (A–D) HeLa cells were transfected with EGFP vector (A) or 0.5 µg or 2 µg EGFP-tagged Rac1bV12 (B and C, respectively) or 2 µg Rac1V12 (D) and stained for F-actin using rhodamine-phalloidin. Representative images are shown. The boxed areas are enlarged at the right-hand-side of the corresponding image. Scale bar represents 20 µm. (E) HeLa cells were co-transfected with EGFP and either vector, Rac1bV12 (0.5 µg), RhoAN19 (0.5 µg) or Rac1bV12 + RhoAN19. The graph shows the number of cells with actin-rich protrusions as a percent of GFP-positive cells. Results are the mean ± SD of three independent experiments with at least 500 cells counted per condition. (F) HeLa cells were transfected with EGFP + vector or + Rac1bV12 (2 µg) with or without Y-27632 (10 µM) treatment. The graph shows the number of cells with blebbing morphology as a percent of GFP-positive cells. Results are the mean ± SD of three independent experiments with at least 500 cells counted per condition.
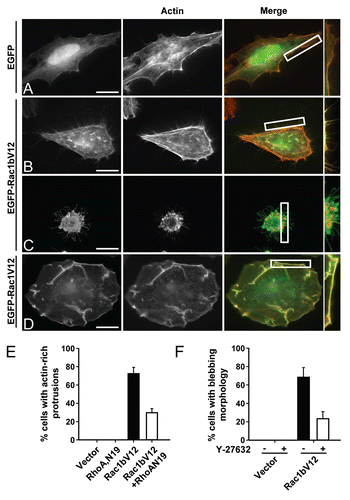
Figure 5 Rac1b promotes Rho-induced invasion of HCT-116 cells. HCT-116 cells transfected with vector, Rac1bV12 or Rac1bV12 + RhoAN19 were applied to the upper chamber of a matrigel-coated transwell with DMEM containing 10% FBS in the lower chamber. Cells migrating through the filter were stained with crystal violet. The stain was subsequently eluted and measured by spectrophotometry at OD 595. (A) Representative images (10x) of the lower surface of the transwell filter are shown. (B) Invasion index represents the light absorbance value relative to the control. Quantification of invaded cells from two independent experiments is shown. Results are the mean ± SD and are presented as the extent of invasion as measured by eluted crystal violet relative to vector. (C) Expression of Rac1bV12 and RhoAN19 were detected by immunoblotting (IB) with anti-HA and anti-RhoA antibodies, respectively, in whole cell lysates (WCL).
Additional material
Download Zip (86 KB)Acknowledgements
We would like to thank Dr. Chen Zhao for help with initial experiments. We are grateful to the members of the Bar-Sagi laboratory for comments and discussions. This work was supported by National Institutes of Health Grants CA055360 (D.B.S.) and CA123592A (A.S.N.).
References
- Van Aelst L, D'Souza-Schorey C. Rho GTPases and signaling networks. Genes Dev 1997; 11:2295 - 2322
- Jaffe AB, Hall A. Rho GTPases: biochemistry and biology. Annu Rev Cell Dev Biol 2005; 21:247 - 269
- DerMardirossian C, Rocklin G, Seo JY, Bokoch GM. Phosphorylation of RhoGDI by Src regulates Rho GTPase binding and cytosol-membrane cycling. Mol Biol Cell 2006; 17:4760 - 4768
- Burridge K, Wennerberg K. Rho and Rac take center stage. Cell 2004; 116:167 - 179
- Sun D, Xu D, Zhang B. Rac signaling in tumorigenesis and as target for anticancer drug development. Drug Resist Updat 2006; 9:274 - 287
- Jordan P, Brazao R, Boavida MG, Gespach C, Chastre E. Cloning of a novel human Rac1b splice variant with increased expression in colorectal tumors. Oncogene 1999; 18:6835 - 6839
- Schnelzer A, Prechtel D, Knaus U, Dehne K, Gerhard M, Graeff H, et al. Rac1 in human breast cancer: overexpression, mutation analysis and characterization of a new isoform, Rac1b. Oncogene 2000; 19:3013 - 3020
- Matos P, Collard JG, Jordan P. Tumor-related alternatively spliced Rac1b is not regulated by Rho-GDP dissociation inhibitors and exhibits selective downstream signaling. J Biol Chem 2003; 278:50442 - 50448
- Fiegen D, Haeusler LC, Blumenstein L, Herbrand U, Dvorsky R, Vetter IR, et al. Alternative splicing of Rac1 generates Rac1b, a self-activating GTPase. J Biol Chem 2004; 279:4743 - 4749
- Matos P, Jordan P. Rac1, but not Rac1B, stimulates RelB-mediated gene transcription in colorectal cancer cells. J Biol Chem 2006; 281:13724 - 13732
- Matos P, Jordan P. Increased Rac1b expression sustains colorectal tumor cell survival. Mol Cancer Res 2008; 6:1178 - 1184
- Singh A, Karnoub AE, Palmby TR, Lengyel E, Sondek J, Der CJ. Rac1b, a tumor associated, constitutively active Rac1 splice variant, promotes cellular transformation. Oncogene 2004; 23:9369 - 9380
- Radisky DC, Levy DD, Littlepage LE, Liu H, Nelson CM, Fata JE, et al. Rac1b and reactive oxygen species mediate MMP-3-induced EMT and genomic instability. Nature 2005; 436:123 - 127
- Manser E, Leung T, Salihuddin H, Zhao ZS, Lim L. A brain serine/threonine protein kinase activated by Cdc42 and Rac1. Nature 1994; 367:40 - 46
- Kozma R, Sarner S, Ahmed S, Lim L. Rho family GTPases and neuronal growth cone remodelling: relationship between increased complexity induced by Cdc42Hs, Rac1 and acetylcholine and collapse induced by RhoA and lysophosphatidic acid. Mol Cell Biol 1997; 17:1201 - 1211
- Leeuwen FN, Kain HE, Kammen RA, Michiels F, Kranenburg OW, Collard JG. The guanine nucleotide exchange factor Tiam1 affects neuronal morphology; opposing roles for the small GTPases Rac and Rho. J Cell Biol 1997; 139:797 - 807
- Sander EE, ten Klooster JP, van Delft S, van der Kammen RA, Collard JG. Rac downregulates Rho activity: reciprocal balance between both GTPases determines cellular morphology and migratory behavior. J Cell Biol 1999; 147:1009 - 1022
- Zondag GC, Evers EE, ten Klooster JP, Janssen L, van der Kammen RA, Collard JG. Oncogenic Ras downregulates Rac activity, which leads to increased Rho activity and epithelial-mesenchymal transition. J Cell Biol 2000; 149:775 - 782
- Nimnual AS, Taylor LJ, Bar-Sagi D. Redox-dependent downregulation of Rho by Rac. Nat Cell Biol 2003; 5:236 - 241
- Ren XD, Schwartz MA. Determination of GTP loading on Rho. Methods Enzymol 2000; 325:264 - 272
- Ohta Y, Hartwig JH, Stossel TP. FilGAP, a Rho- and ROCK-regulated GAP for Rac binds filamin A to control actin remodelling. Nat Cell Biol 2006; 8:803 - 814
- Narumiya S, Tanji M, Ishizaki T. Rho signaling, ROCK and mDia1, in transformation, metastasis and invasion. Cancer Metastasis Rev 2009; 28:65 - 76
- Allen WE, Zicha D, Ridley AJ, Jones GE. A role for Cdc42 in macrophage chemotaxis. J Cell Biol 1998; 141:1147 - 1157
- Sahai E, Olson MF, Marshall CJ. Cross-talk between Ras and Rho signalling pathways in transformation favours proliferation and increased motility. EMBO J 2001; 20:755 - 766
- Croft DR, Sahai E, Mavria G, Li S, Tsai J, Lee WM, et al. Conditional ROCK activation in vivo induces tumor cell dissemination and angiogenesis. Cancer Res 2004; 64:8994 - 9001
- Sahai E, Marshall CJ. Differing modes of tumour cell invasion have distinct requirements for Rho/ROCK signalling and extracellular proteolysis. Nat Cell Biol 2003; 5:711 - 719
- Lozano E, Betson M, Braga VM. Tumor progression: Small GTPases and loss of cell-cell adhesion. Bioessays 2003; 25:452 - 463
- Karlsson R, Pedersen ED, Wang Z, Brakebusch C. Rho GTPase function in tumorigenesis. Biochim Biophys Acta 2009; 1796:91 - 98
- Fritz G, Just I, Kaina B. Rho GTPases are overexpressed in human tumors. Int J Cancer 1999; 81:682 - 687
- Kamai T, Yamanishi T, Shirataki H, Takagi K, Asami H, Ito Y, et al. Overexpression of RhoA, Rac1 and Cdc42 GTPases is associated with progression in testicular cancer. Clin Cancer Res 2004; 10:4799 - 4805
- Yan B, Chour HH, Peh BK, Lim C, Salto-Tellez M. RhoA protein expression correlates positively with degree of malignancy in astrocytomas. Neurosci Lett 2006; 407:124 - 126
- Walch A, Seidl S, Hermannstadter C, Rauser S, Deplazes J, Langer R, et al. Combined analysis of Rac1, IQGAP1, Tiam1 and E-cadherin expression in gastric cancer. Mod Pathol 2008; 21:544 - 552
- Williams CL. The polybasic region of Ras and Rho family small GTPases: a regulator of protein interactions and membrane association and a site of nuclear localization signal sequences. Cell Signal 2003; 15:1071 - 1080
- Del Pozo MA, Alderson NB, Kiosses WB, Chiang HH, Anderson RG, Schwartz MA. Integrins regulate Rac targeting by internalization of membrane domains. Science 2004; 303:839 - 842
- Del Pozo MA, Schwartz MA. Rac, membrane heterogeneity, caveolin and regulation of growth by integrins. Trends Cell Biol 2007; 17:246 - 250
- Del Pozo MA, Kiosses WB, Alderson NB, Meller N, Hahn KM, Schwartz MA. Integrins regulate GTP-Rac localized effector interactions through dissociation of Rho-GDI. Nat Cell Biol 2002; 4:232 - 239
- Sahai E, Marshall CJ. RHO-GTPases and cancer. Nat Rev Cancer 2002; 2:133 - 142
- Wilkinson S, Paterson HF, Marshall CJ. Cdc42-MRCK and Rho-ROCK signalling cooperate in myosin phosphorylation and cell invasion. Nat Cell Biol 2005; 7:255 - 261
- Walsh AB, Bar-Sagi D. Differential activation of the Rac pathway by Ha-Ras and K-Ras. J Biol Chem 2001; 276:15609 - 15615