 ?Mathematical formulae have been encoded as MathML and are displayed in this HTML version using MathJax in order to improve their display. Uncheck the box to turn MathJax off. This feature requires Javascript. Click on a formula to zoom.
Abstract
Compared with eukaryotes, the archaeal transcription initiation machinery—commonly known as the Pre-Initiation Complex—is relatively simple. The archaeal PIC consists of the TFIIB ortholog TFB, TBP, and an 11-subunit RNA polymerase (RNAP). The relatively small size of the entire archaeal PIC makes it amenable to structural analysis. Using purified RNAP, TFB, and TBP from the thermophile Pyrococcus furiosus, we assembled the biochemically active PIC at 65ºC. The intact archaeal PIC was isolated by implementing a cross-linking technique followed by size-exclusion chromatography, and the structure of this 440 kDa assembly was determined using electron microscopy and single-particle reconstruction techniques. Combining difference maps with crystal structure docking of various sub-domains, TBP and TFB were localized within the macromolecular PIC. TBP/TFB assemble near the large RpoB subunit and the RpoD/L “foot” domain behind the RNAP central cleft. This location mimics that of yeast TBP and TFIIB in complex with yeast RNAP II. Collectively, these results define the structural organization of the archaeal transcription machinery and suggest a conserved core PIC architecture.
Introduction
In each of the three domains of life—Bacteria, Archaea and Eucarya—RNA polymerase (RNAP) is a multi-subunit protein complex (MW: 380–520 kDa) with subunit compositions that vary depending on the organism.Citation1 Bacterial RNAP is composed of five subunits, which are conserved throughout evolution. However, in eukaryotes, RNAP II possesses additional polypeptides to form a 12-subunit complex. Previous high-resolution studies of bacterial coreCitation2 and holo-enzymes,Citation3,Citation4 as well as eukaryotic RNAP II,Citation5–Citation8 have provided insight into the structural and functional aspects of RNAPs. Recently, structural information about RNAP from Archaea was also elucidated, as the structure of Pyrococcus furiosus RNAP was obtained by cryo-EMCitation9 and the crystal structure of Sulfolobus solfataricus and S. shibatae RNAP were obtained by X-ray crystallography.Citation10,Citation11
The assembly of an RNAP and associated initiation factors at transcription start sites represents an early event in gene expression.Citation12 This assembly, commonly referred to as the Pre-Initiation Complex (PIC), represents the collection of factors generally required for accurate initiation of transcription.Citation13 For protein-coding genes in eukaryotes, the PIC consists of approximately 70 polypeptides, which are present as individual proteins or as components of multi-subunit complexes.Citation14 Core factors within the eukaryotic PIC include RNA polymerase II (RNAP II), TBP (present within the multi-subunit TFIID complex) and TFIIB. TBP and TFIIB play critical roles in transcription initiation by helping recruit and stabilize RNAP II at the promoter. In addition, TBP and TFIIB determine the transcription start site through simultaneous interactions with the promoter DNA and/or RNAP II itself.Citation13,Citation15
In contrast to eukaryotes, the archaeal PIC is simpler, consisting of 13 polypeptides: TBP, TFB (an ortholog of TFIIB) and an 11-subunit RNAP.Citation15,Citation16 Despite its austerity, the archaeal PIC, like its eukaryotic counterpart, can be regulated by DNA-binding transcription factors and directs accurate initiation by RNAP.Citation17,Citation18 The fact that Archaea rely upon TBP and TFB to regulate RNAP-dependent transcription suggests that structural organization of the archaeal PIC may resemble a basic core within the eukaryotic PIC, whereas TBP and TFB orthologs are not found in bacteria. Furthermore, archaeal RNAP more closely resembles RNAP II in eukaryotes relative to the bacterial RNAP. In fact, only the RNAP II subunits Rpb8 and Rpb9 are not represented in archaeal RNAP,Citation15 although others have reported otherwise.Citation11
Determination of 3-D structures has revealed informative snapshots of macromolecules in motion,Citation19 yet a comprehensive view of the fully assembled PIC based entirely on structural data is still lacking. Models have been proposed by combining data from cross-linking experiments and X-ray crystallography studies.Citation6,Citation20,Citation21 Recent work was reported for the yeast RNAP-IIB complex based on X-ray crystallography.Citation22,Citation23 Our current structural study focuses on the initiation stage of the transcription machinery in the hyperthermophilic archaeon P. furiosus. Using conventional or cryo-electron microscopy (cryo-EM) and single-particle 3-D reconstruction techniques combined with crystal structure docking, we have determined the low-resolution structure and molecular architecture of the entire P. furiosus PIC. Coupled with a functional analysis, we demonstrate that PICs assembled for structural analysis are biochemically active (i.e., TBP/TFB enhance transcription and direct start site selection by RNAP) and that the location of TBP/TFB within the P. furiosus PIC is consistent with the proposed locations of TBP/TFIIB within the eukaryotic PIC.Citation13,Citation21–Citation23 These studies provide insight into the structure and function of the archaeal PIC and define a core architecture that is preserved within eukaryotes.
Results
Structure of archaeal apo-RNAP.
Prior to EM analysis of the entire archaeal PIC, we collected negative-stain and cryo-EM data with the free (apo-) RNAP enzyme from the hyperthermophilic archaeon P. furiosus. As shown in , well-defined characteristic class averages of apo-RNAP were obtained from initial analysis with negatively stained samples. Single-particle images were collected and aligned in 3-D through angular refinementCitation28 from a filtered version of the human RNAP II structure recently published (EMD-1282).Citation30 Our negative-staining 3-D reconstruction (data not shown) was then used as a starting reference for angular refinement with cryo-EM data (), which resulted in refinement of the structure to about 18 Å resolution (, mesh). To further validate the quality of the cryo-EM reconstruction, the crystal structure of S. solfataricus RNAPCitation10 was manually fitted into our cryo-EM density map and then refined using a least-square minimization algorithm.Citation33 As shown qualitatively in , the overall quality of the fitting was very good (CC > 0.85 at 18 Å). As expected, the archaeal apo-RNAP structure shows striking similarities to other RNAPs,Citation9,Citation30,Citation35–Citation37 most notably the distinctive crab-claw architecture ( and Suppl. Fig. 1). However, the stalk formed by the RpoE/F sub-units (corresponding to Rpb4/7 in RNAP II; see Suppl. Fig. 1) adopts a more extended conformation in the archaeal apo-RNAP structure. The structural similarities between archaeal RNAP and yeast (eukaryotic) RNAP II likely reflect their conserved subunit composition ().
Molecular architecture of an active, archaeal pre-initiation complex. Because the archaeal PIC consists of fewer components relative to the eukaryotic PIC, it was feasible to attempt a structural analysis of the entire assembly. Moreover, given the clear similarities between the archaeal and eukaryotic PIC, elucidation of the molecular architecture of the archaeal PIC would likely yield clues about the organization of the eukaryotic PIC and/or whether the orientation of the RNAP II/TBP/TFIIB core is preserved. To ensure the PIC components (RNAP, TBP, TFB) were active, we performed a series of in vitro transcription reactions using purified P. furiosus RNAP () together with TBP and TFB. These assays were modeled after experiments by Jackson and co-workers, who used a reconstituted system to help define the biochemical roles of TBP and TFB.Citation38 As shown in , only upon addition of all three PIC factors was robust transcription reconstituted in this system. In fact, RNAP initiated at the proper site (25-bp downstream from the TATA box in the T6 promoter) only in the presence of TBP and TFB (, lane 5). Moreover, in the absence of TBP/TFB, transcription by RNAP was almost undetectable and did not initiate at the proper site (, lane 4). These results are consistent with previous observationsCitation38,Citation39 and underscore the role of TBP/TFB in regulating the activity of RNAP. Further, these findings confirm that the purified RNAP, TBP and TFB to be used for structural analysis (see below) were transcriptionally active.
Our next goal was to complete a structural analysis of the reconstituted archaeal PIC. Because P. furiosus thrive at elevated temperatures, PIC assembly required temperatures at or above 60°C. Indeed, robust PIC activity was observed at 60°C in our reconstituted transcription assays, whereas little/no initiation was observed at reduced temperatures (data not shown). Unfortunately, isolation of stable PIC assemblies—a requirement for structural analysis—was not feasible under these conditions (see Materials and Methods). Thus, PICs were assembled at 65°C, and then cross-linked with glutaraldehyde to preserve and stabilize the archaeal PIC in the presence of promoter DNA. Titration of the cross-linker suggested a concentration of only 0.05% was sufficient to stabilize the PIC (). To limit potential heterogeneity in our PIC preparations, we further purified the cross-linked samples on a gel filtration column. As shown in , gel filtration yielded a single peak in the range of the expected molecular weight of the archaeal PIC assembly (∼440 kDa).
With a reliable means to purify the archaeal PIC, we proceeded with a structural analysis of the entire 440 kDa assembly using EM and single-particle reconstruction. Micrographs of the PIC sample revealed complexes of uniform size and shape () and 2-D classification confirmed the presence of structures bearing a striking resemblance to RNAP (inset, ). Because TBP and TFB are small compared with RNAP, we anticipated that 2-D averages of the PIC would resemble RNAP alone. For 3-D reconstruction of the entire P. furiosus PIC, we used the cryo-EM apo-RNAP structure () as starting reference and built a stable PIC model following multiple rounds of angular refinement using the 3-D projection alignment technique. The final resolution of the PIC map was 25 Å. To localize TBP/TFB within the structure, we examined both apo-RNAP and the PIC EM maps in CHIMERACitation32 and calculated a cross correlation coefficient (CCC) for a series of iterative fitting steps in real space, each starting from random positions. The best scoring fit (CCC = 0.76) is illustrated in . We also generated a difference map by subtracting the apo-RNAP structure from the EM map of the entire PIC assembly (Suppl. Fig. 4), which revealed the putative location of extra density. As highlighted in , the extra density was clearly visible on the opposite side of the stalk (red arrows in ). Further, shows an overlay of the PIC structure vs. the apo-RNAP cryo-EM (left) or X-ray map (right) viewed from the top, with the DNA binding cleft facing the viewer and the foot domain on the opposite side. The extra density in the archaeal PIC (red star, ) is located near the subunit B lobe region, corresponding to the eukaryotic Rpb2 subunit lobe and protrusion domains of RNAP II.
A short 54 bp promoter DNA template was used to assemble the archaeal PIC for our structural analysis. The template DNA was partially revealed in the difference map calculated between the PIC and the apo form of the enzyme (Suppl. Fig. 4B). The entire length of the template DNA is not fully visible in the EM density map, however, suggesting that portions of the template are disordered in the structure. This was not unexpected, because elevated temperatures were required for PIC assembly (see below) and, in contrast to an actively transcribing polymerase, DNA will be bound less tightly along the polymerase cleft in a PIC.
To further assess the location and orientation of TFB and TBP within the assembly, we docked the crystal structure of an archaeal DNA/TBP/TFB complex (PDB 1AIS)Citation40 into our PIC EM map. We first manually positioned the maps in CHIMERA by placing the DNA/TBP/TFB complex (Suppl. Fig. 5) roughly in the center of the extra density, using the recently published RNAPII-TFIIB structure (PDB ID 3F1K)Citation22 as a guide. This resulted in the fit shown in . We then iteratively refined the fit using the “fit map in map” algorithm in CHIMERA. This yielded a better fit, which resulted from simple rotation of the DNA/TBP/TFB density ∼30 degrees counterclockwise (). Most of the TFB and TBP densities fit well within the PIC density map. Although portions of the TBP/TFB density protrude from the EM density map, it is important to note that numerous factors likely impact the quality of the fit. For example, because P. furiosus is a hyperthermophile, we had to incubate RNAP, TBP, TFB and the DNA template at 65°C in order to assemble the PIC. This elevated temperature will contribute to a more dynamic assembly and likely precludes localization of DNA within the assembly. Also, EM reconstructions result from averaging thousands of single-particle images; thus, regions of the PIC showing significant movement would be underrepresented (i.e., averaged out) in the final 3-D structure.Citation41
Because the DNA template used for our EM analysis was short and not fully visible in the EM density map, we modeled a longer piece of DNA to aid in visualizing the organization of the TBP/TFB/DNA ternary complex into the PIC density map (). Altogether, our model for the archaeal PIC () is consistent with a previously proposed archaeal PIC modelCitation11 and in excellent agreement with the yeast RNAP-TFIIB structures that were recently reported by the Cramer and Kornberg labs.Citation22,Citation23 The position of TFB in our model corresponds well with the position and orientation of TFIIB in the yeast complex, but the overall position of TBP is rotated by approximately 30 degrees counterclockwise with respect to the axis of the DNA strands sitting in the enzyme DNA-binding cleft.
Discussion
The 3-D structure of the P. furiosus apo-RNAP described here is, as expected, highly consistent with a crystal structure recently obtained.Citation10 Notably, up to 70% of the P. furiosus and S. solfataricus RNAP protein sequences can be aligned with yeast RNAP II with a RMS deviation close to 2 Å.Citation42 Therefore, the P. furiosus RNAP structure bears striking similarities to the eukaryotic RNAP II structures described in the literature (reviewed by Kornberg).Citation43
In Archaea, RNAP, TBP and TFB are the only core transcription factors required for a functional PIC, with TBP and TFB each playing a role in recruiting RNAP to the promoter and directing accurate initiation of the transcript.Citation44 The molecular architecture of the archaeal PIC shown in is based upon de novo structural analysis of PICs reconstituted from highly purified, biochemically active components. The positioning of the archaeal TBP/TFB/DNA complex within this macromolecular assembly is based upon EM analysis as well as docking experiments with the archaeal TBP/TFB/DNA assembly and RNAP itself. After fitting the S. solfataricus apo-RNAP crystal structure into the EM map of the entire PIC, extra density was observed in one region that occupied a volume consistent with the size of TBP/TFB. Docking of TBP/TFB/DNA crystal structure resulted in a good fit, but not exact (). This may reflect structural differences between yeast TBP/TFIIB and archaeal TBP/TFB. The differences may also reflect the dramatically different conditions for assembly of the P. furiosus PIC. Because P. furiosus is a hyper-thermophile, stable PIC assembly requires elevated temperatures (e.g., PICs analyzed by EM were generated at 65°C and stabilized with 0.05% glutaraldehyde); consequently, despite its evident stability, the potential energy at these temperatures would cause considerable movement within the assembly. Such thermal motions make it significantly more difficult to obtain high-resolution structural information, yet they do not preclude structural analysis with EM. The high temperature required for the PIC assembly precluded localization of the TBP/TFB pair using immunolabeling experiments. Attempts to localize TBP within our PIC assembly using antibodies against TBP were unsuccessful at high temperature most likely because denaturation of the antibody, whereas the archaeal PIC disassembles upon lowering the temperature for antibody labeling experiments.
At present we cannot rule out that the position of TBP in our archaeal PIC model may slightly differ from that of yeast TBP due to the cross-linking agent. However, there is strong evidence provided by recently published data that supports our model. First, the structure-based model of the P. furiosus PIC described here () bears striking resemblance to the yeast PIC core (RNAP II/TBP/TFIIB) as proposed by using photo-cross-linking with native complexes,Citation20,Citation21,Citation45 as well as with recently reported X-ray structures of the yeast RNAP-IIB complexCitation22,Citation23 (see PDB ID 3K1F, ). Second, in each case TBP hugs the DNA double-helix from the back of the wall formed by RpoB (Rpb2 in yeast RNAP II) and TFB (TFIIB in yeast) contacts the large subunit (RpoA′; Rpb1 in yeast) via its N-terminus.
From the EM 3-D reconstruction, we completed the PIC modeling by replacing the PIC EM density map with a crystal structure of archaeal RNAPCitation10 to help visualize the entire assembly. The TBP/TFB density within the P. furiosus PIC is located opposite the RpoE/F stalk and proximal to the “foot” domain of RNAP, alongside the RpoB, D, L, N, P subunits (). This TBP/TFB location is consistent with past biochemical studies. For example, evidence for an interaction between RpoB and TBP/TFB was provided by Goede and co-workers, who defined an interaction between TBP/TFB and the RpoB/D/L/N/P subcomplex of P. furiosus in a series of protein-protein interaction assays.Citation45 Such interactions are visualized in our 3-D reconstruction of the P. furiosus PIC. Furthermore, past biochemical studies have suggested a direct TFB-RpoK interaction,Citation46 and the TBP-TFB docking shown in juxtaposes a portion of the TFB density near the small RpoK subunit, adjacent to the RpoE/F stalk. Consequently, the molecular architecture defined by 3-D reconstruction of the P. furiosus PIC corroborates past biochemical studies with archaeal PIC components.
The similar positioning of TBP/TFB within the archaeal PIC relative to yeast TBP/TFIIB suggests a common core PIC architecture was established and preserved in eukaryotes (). Arranging the position of the promoter DNA according to the RNAPII/TFIIB crystal structureCitation22,Citation23 allowed us to position TFB in our model and the overall position of TBP, albeit slightly rotated, is also in good agreement with its position in the eukaryotic PIC proposed earlier by the Hahn lab.Citation20,Citation47 Collectively, the results summarized here support the hypothesis that the structural architecture of the archaeal PIC represents a scaffold for the eukaryotic PIC and serves as a structural core for transcription initiation in Archaea and Eukaryotes.
Structure database.
The EM maps of RNAP-apo and RNAP-PIC were deposited in the Electron Microscopy Data Base with entries EMD-5024 and EMD-5025, respectively. A model of the PIC assembly in PDB format is available upon request.
Materials and Methods
Sample preparation for EM.
Native Pyrococcus furiosus RNAP stock solution [9.0 mg/ml] was obtained from the Murakami lab and purified as describedCitation10 and subsequently diluted to a final concentration of ∼0.05 mg/ml (for room temperature EM), in Hepes 0.1 M, pH 8.0, NaCl 50 mM, EDTA 0.1 mM, DTT 2 mM. The PIC complex was prepared as indicated by the Murakami protocolCitation24 and consisted in mixing RNAP (native, 95% pure), TBP, TFB (recombinant proteins) and DNA. Briefly, 28.9 µl of Hepes buffer (see above) were gently mixed with 1.2 µl of dsDNA [stock solution at 0.1 mM], 4 µl TBP [stock at 1.0 mg/ml], 13 µl TFB [0.5 mg/ml] and incubated for 10 min at room temperature. Afterwards, 2.8 µl of P. furiosus RNAP [9.0 mg/ml] were gently mixed to the previous solution and incubated for another 10 min at 65°C.
The promoter DNA used was a 54 nucleotides double-stranded DNA:
Non-template DNA
5′-AGA TAG AGT AAA GTT TAA ATA CTT ATA TAG ATA GAG TAT AGA TAG TGC ATG CCC-3′
Template DNA
5′-GGG CAT GCA CTA TCT ATA CTC TAT CTA TAT AAG TAT TTA AAC TTT ACT CTA TCT-3′
When required by the experiment, the RNAP-TBP-TFB-DNA complex was crosslinked in the presence of 0.05% glutaraldehyde right after incubation at 65°C, let react for 10 min at room temperature then quenched with 10 µl of 1 M Tris-Glycine. After chemical fixation, the fully-assembled PIC samples were subsequently purified on an AKTA FPLC system, using a Superdex 200 gel-filtration column (24 ml) at 4°C to assure removal of unbound species. The elution was monitored with a UV detector using a 280 nm wavelength.
In vitro transcription.
The DNA template plasmid for reconstituted transcription contained 54 bp of the T6 promoter upstream of the CAT gene; a 24 nt primer within CAT was then used for quantitation of transcripts by primer extension. Purified P. furiosus RNAP, TBP and TFB were each titrated over a 100-fold range to determine the optimal concentrations for each in the assay (data not shown). Ultimately, each reaction contained 200 ng template DNA (120 fmol) in the presence/absence of 60 ng RNAP, 50 ng TBP or 25 ng TFB. This mixture was allowed to pre-incubate 2 min at 60°C prior to the addition of NTPs to 0.6 mM final concentration. Transcription was allowed to proceed 15 min at 60°C, at which point STOP solution (20 mM EDTA, 0.2 M NaCl, 1% SDS, supplemented with glycogen and proteinase K) was added.
Electron microscopy.
For cryo-EM sample preparation, we followed the thin film vitrification technique of Adrian,Citation25 using Protochips C-Flat holey carbon films on 200 mesh copper grids, previously soaked and washed with chloroform (>30 min), dried in air, with no glow discharge applied. In the case of air-drying negative staining, continuous carbon film was freshly made and deposited on copper grids. The staining solution used consists of filtered 2% uranyl acetate; it was applied for about 30 sec on the sample, and then removed with filter paper. The grid was let dry and stored.
Image data were collected in a FEI Tecnai F20 transmission electron microscope at an acceleration voltage of 200 kV, and with a nominal magnification of x50 k, using a Gatan 626 cryo-specimen holder and cryo transfer kit (Gatan Inc., Warrendale, PA USA). All micrographs were recorded under strict low-dose conditions (1,500 e−/nm2), either at room temperature (negative staining) or at a specimen temperature of about −180°C for cryo-EM. Negative staining data was recorded on a Gatan 4 k by 4 k CCD camera, whereas cryo-EM data was recorded on Kodak SO-163 film plates, developed in full-strength Kodak D19 developer for 10 min at 20°C.
Image processing.
After observing their diffraction patterns on the Linux workstation with ‘ctfit’ from the EMAN package,Citation26 micrographs devoid of astigmatism, drift or charging effect, were converted in SPIDERCitation27 either after digitizing them in a Nikon Super Coolscan ED8000 scanner or directly from the Digital Micrograph DM3 format using the ‘proc2d’ command in EMAN. The final conversion resulted in all images with a sampling size of 2.25 Å/pixel (at the specimen scale). Image processing was then carried out on a PC-Linux workstation, using the SPIDER and WEB software package.Citation27
The initial model of the P. furiosus apo-RNAP was built using the projection matching strategy, also termed 3-D projection alignment.Citation28 This is a real-space refinement that is similar to the angular reconstitution method using sonograms.Citation29 With the help of a first reference structure that was built from a filtered version of our previous work with the human RNAP II (EMD-1282),Citation30 5,908 raw images were subjected to CTF correction by phase-flipping and several refinement cycles of projection matching to generate a 3-D reconstruction that was then used as new global reference volume for the next iteration. Cycles of iterative angular assignment were performed with decreasing angular steps (20°, 15°, 10° and 5°) until no further improvement could be detected. The progress of improvement was determined by calculating global FSC curve computed from one cycle to the next. The 3-D reconstructions were all low-pass filtered according to their RMEASURE resolution limit,Citation31 namely 18 Å for the cryo-EM apo model (5,766 particles) and 25 Å for the PIC model (5,582 particles), respectively. For the 3-D reconstruction of the PIC complex, particles were submitted to iterative 3-D projection alignment.Citation28 A starting reference model was calculated from our P. furiosus apo-RNAP cryo-EM data filtered at 50 Å, and was projected with an angular increment of 20°. After four refinement cycles the angular step was decreased to 5° and additional density due to the extra factors appeared and stabilized itself in the EM density map of the complex. All figures were prepared with UCSF CHIMERA.Citation32
Calculation of difference maps.
The difference maps (Suppl. Fig. 4) were rendered at a threshold representing ∼100% of the expected molecular weight of the PIC complex. The SPIDER procedures to calculate a difference map are available at the following URL: www.wadsworth.org/spider_doc/spider/docs/techs/diffmaps/index.html.
Comparison between electron microscopy and X-ray crystallography data.
In order to compare the cryo-EM density maps and the crystal structures of either Archaea (S. solfataricus PDB 2PMZ)Citation10 or the yeast RNAPs in the apo- or elongation states; all atomic coordinates (Suppl. Table 1) were translated to densities while imported in SPIDER format from the PDB. All the models were displayed in CHIMERACitation32 as density maps or using the ‘multiscale models’ function of CHIMERA with different resolution parameters.
The best fit of DNA/TBP/TFB (PDB 1AIS) into our PIC structure was obtained by first manually positioning the ternary complex roughly in the extra density center. The fit was then refined using the “fit map in map” function of CHIMERA allowing shift and rotation in real space.
Fitting of the RNAP X-ray crystal structure.
The atomic model of archaeal RNAP was roughly manually fitted into the scaled cryo-EM density map using CHIMERA and the resulting coordinates saved (see above).
This initial fit was then refined, using a least squares minimization procedure.Citation33 The algorithm is, in essence, the one described for the X-ray crystallography program FITING,Citation34 but substantially modified in order to fit atomic coordinates into cryo-EM density maps (http://www.igs.cnrs-mrs.fr/elnemo/NORMA/). The accuracy of the fit was assessed by evaluation of the correlation coefficient (CC) and R-factor (R), where: (1)and
(2)
Fem and Fmod are the Fourier coefficients of the cryo-EM map and the whole RNAP model (11 subunits), respectively. The final fitting result was imported and displayed in CHIMERA. The PDB model (accession code: 2PMZ)Citation10 was displayed as rounded ribbons using the CHIMERA preset #1, while the final 3-D reconstruction was masked with a 3-D mask in SPIDER, filtered to 20Å, and displayed as a grey mesh in CHIMERA with a threshold representing 100% of the expected molecular volume of the apo-RNAP or RNAP-PIC complex.
Authors' Contributions
S.D.C. did purification, sample preparation, electron microscopy and image analysis; S.C.L. and D.J.T. performed transcription assays; S.D.C. and D.J.T. designed experiments; S.D.C. prepared the figures; S.D.C. and D.J.T. wrote the paper.
Figures and Tables
Figure 1 Cryo-EM analysis of apo-RNAP. (A) Negative staining EM and selected class-averages of the P. furiosus apo-RNAP. Each class-average is composed of about 10–30 raw images and was aligned against an initial 3-D reference to define its orientation parameters. (B) cryo-EM micrograph and selected class-averages, illustrated with reversed contrast. (C) Fitting of the S. solfataricus apo-RNAP crystal structure (PDB 2PMZ)Citation10 into the cryo-EM refined model. The crystal structure was manually fitted in chIMeRa and the fit was refined with a least-square minimization algorithm (see Materials and Methods). Scale bar = 65 nm in (A and B); 5 nm in (C).
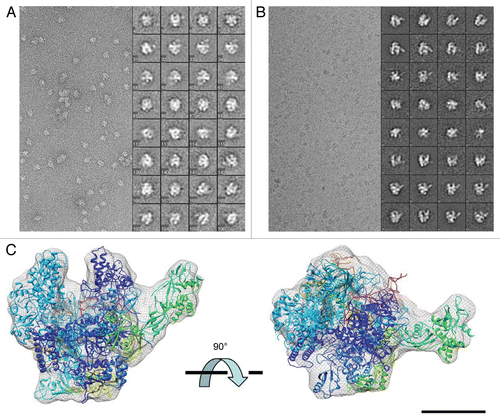
Figure 2 Functional analysis and purification of P. furiosus PIC (A, left) silver stain gel of purified RNAP from P. furiosus and reconstituted transcription. RNAP, TBP and/or TFB were added as shown. Asterisk, minor cryptic initiation site in the absence of TBP/TFB; Arrow, correct initiation site from the T6 promoter. (B) Coomassie-stained gel for PIC cross-linking. The letters B through P denote RNAP subunits; TBP and TFB are also indicated. (C) Elution profile for the cross-linked PIC purified with size-exclusion chromatography on a 24 ml Superdex 200 column. Time = 7 min is the column dead volume; the wavelength was set to 280 nm.
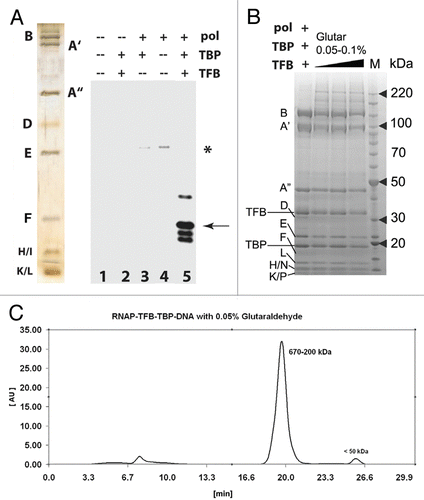
Figure 3 EM analysis of the P. furiosus PIC. (A) Negatively-stained micrograph and selected class-averages of the PIC (RNAP /TBP/TFB/DNA complex). Each class-average is composed of about 10–30 raw images and was aligned against an initial RNAP 3-D reference to define its orientation parameters. (B) PIC reconstruction (top) compared to apo-RNAP (bottom) in two different orientations. Extra density within PIC structure is indicated by red arrows. (C) Overlay of the RNAP cryo-EM structure (from ) or the X-ray structureCitation10 onto the EM density map of the PIC. A red star highlights extra density.
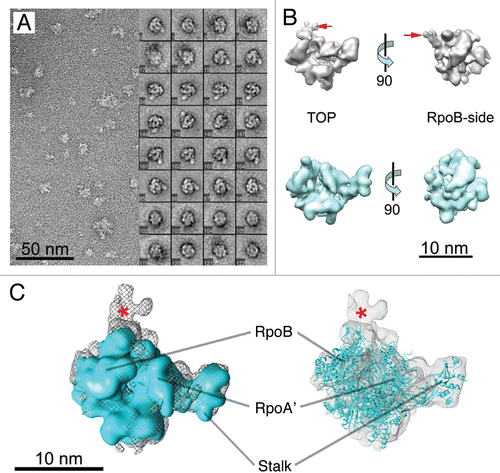
Figure 4 Localization of TBP/TFB within the P. furiosus PIC. (A) Back-view of the PIC EM structure (grey mesh) with fitted DNA/TBP/TFB crystal structure (PDB ID 1AIS).Citation40 (B) Same as (A), but the fit was improved by rotating the DNA/TBP/TFB complex about 30 degrees. (C) Proposed model of Archaeal PIC: top-view of the PIC EM density (grey) according to the improved fit shown in (B). (D) High-resolution model proposed for the Archaeal PIC (RNAP from PDB ID 2PMZ;Citation10 DNA/TBP/TFIIB from PDB ID 3K1F).Citation22 Scale bar = 5 nm in (A and B) and 10 nm in (C and D).
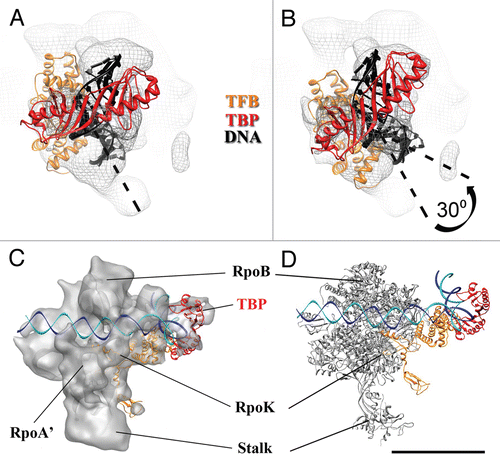
Figure 5 A conserved core architecture within archaeal and eukaryotic PIC? High-resolution model for (A) archaeal PIC. and (B) Yeast RNAP II/TFIIB complex from PDB ID 3K1F.Citation22 (C) Subunits composition of Archaea RNAP and Eukaryotic RNAP II. Scale bar = 10 nm.
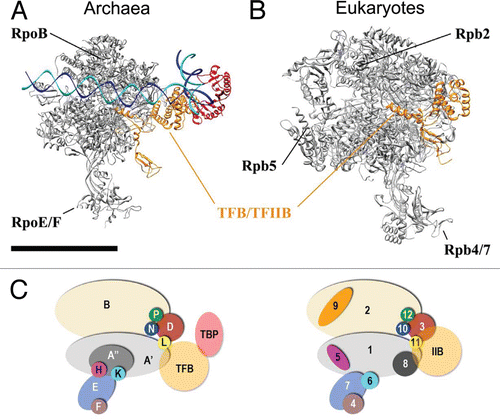
Table 1 Subunit composition, molecular weight and nomenclature of multi-subunit RNAPs
Additional material
Download Zip (5.4 MB)Acknowledgements
The authors thank K. Murakami and A. Hirata (Penn State) for the P. furiosus RNAP, TBP, TFB and DNA template samples as well as for providing the protocol for PIC. We thank Steven Hahn and Patrick Cramer for providing the crystallographic coordinates of their eukaryotic PIC models, prior to publication. We are grateful to Linda Drullinger and James Woodrich (Cristol Chemistry, C.U. Boulder) for providing the antibody against TBP. We are indebted to Eva Nogales (U.C. Berkeley) and the people in her lab for critical reading of the manuscript. Finally we thank Nesia Zurek for help during her rotation in the lab. Part of the instrumentation was supported by grant RR-000592 from the National Center for Research Resources of the National Institutes of Health to A.H. D.J.T. was supported by the National Cancer Institute (P01 CA112181). Partial support to S.D.C. was provided by the Research Centers in Minority Institutions (NIH/NCRR/RCMI) Grant G12-RR03060 to CCNY.
References
- Ebright RH. RNA polymerase: structural similarities between bacterial RNA polymerase and eukaryotic RNA polymerase II. J Mol Biol 2000; 304:687 - 698
- Zhang G, Campbell EA, Minakhin L, Richter C, Severinov K, Darst SA. Crystal structure of Thermus aquaticus core RNA polymerase at 3.3 A resolution. Cell 1999; 98:811 - 824
- Murakami KS, Masuda S, Campbell EA, Muzzin O, Darst SA. Structural basis of transcription initiation: an RNA polymerase holoenzyme-DNA complex. Science 2002; 296:1285 - 1290
- Vassylyev DG, Sekine S, Laptenko O, Lee J, Vassylyeva MN, Borukhov S, et al. Crystal structure of a bacterial RNA polymerase holoenzyme at 2.6 Å resolution. Nature 2002; 417:712 - 719
- Armache KJ, Kettenberger H, Cramer P. Architecture of initiation-competent 12-subunit RNA polymerase II. PNAS 2003; 100:6964 - 6968
- Bushnell DA, Westover KD, Davis RE, Kornberg RD. Structural basis of transcription: an RNA polymerase II-TFIIB cocrystal at 4.5 Angstroms. Science 2004; 303:983 - 988
- Cramer P, Bushnell DA, Kornberg RD. Structural basis of transcription: RNA polymerase II at 2.8 angstrom resolution. Science 2001; 292:1863 - 1876
- Wang D, Bushnell DA, Westover KD, Kaplan CD, Kornberg RD. Structural basis of transcription: role of the trigger loop in substrate specificity and catalysis. Cell 2006; 127:941 - 954
- Kusser AG, Bertero MG, Naji S, Becker T, Thomm M, Beckman R, et al. Structure of an archaeal RNA polymerase. J Mol Biol 2008; 376:303 - 307
- Hirata A, Klein BJ, Murakami KS. The X-ray crystal structure of RNA polymerase from Archaea. Nature 2008; 451:851 - 854
- Korkhin Y, Unligil UM, Littlefield O, Nelson PJ, Stuart DI, Sigler PB, et al. Evolution of complex RNA polymerases: the complete Archaeal RNA polymerase structure. PLoS Biology 2009; 7:1000102
- deHaseth PL, Zupancic ML, Record MT Jr. RNA polymerase-promoter interactions: the comings and goings of RNA polymerase. J Bacteriol 1998; 180:3019 - 3025
- Hahn S. Structure and mechanism of the RNA polymerase II transcription machinery. Nat Struct Mol Biol 2004; 11:394 - 403
- Taatjes DJ. The human Mediator complex: a versatile, genome-wide regulator of transcription. Trends Biochem Sci 2010; 35:315 - 322
- Thomas MC, Chiang CM. The general transcription machinery and general cofactors. Crit Rev Biochem Mol 2006; 41:105 - 178
- Geiduschek EP, Ouhammouch M. Archaeal transcription and its regulators. Mol Microbiol 2005; 56:1397 - 1407
- Bartlett MS. Determinants of transcription initiation by archaeal RNA polymerase. Curr Opin Microbiol 2005; 8:677 - 684
- Bell SD. Archaeal transcriptional regulation—variation on a bacterial theme?. Trends Microbiol 2005; 13:262 - 265
- Tsonis P. Anatomy of gene regulation: A three-dimensional structural analysis, 1 edn 2003; Cambridge Cambridge University Press
- Chen HT, Hahn S. Mapping the location of TFIIB within the RNA polymerase II transcription preinitiation complex: a model for the structure of the PIC. Cell 2004; 119:169 - 180
- Chen HT, Warfield L, Hahn S. The positions of TFIIF and TFIIE in the RNA polymerase II transcription preinitiation complex. Nat Struct Mol Biol 2007; 14:696 - 703
- Kostrewa D, Zeller ME, Armache KJ, Seizl M, Leike K, Thomm M, et al. RNA-polymerase II-TFIIB structure and mechanism of transcription initiation. Nature 2009; 462:292 - 293
- Liu X, Bushnell DA, Wang D, Calero G, Kornberg R. Structure of an RNA polymerase II-TFIIB complex and the transcription initiation mechanism. Science 2010; 327:206 - 209
- Hirata A, Kanai T, Santangelo TJ, Tajiri M, Reeve JN, Imanaka T, et al. Archaeal RNA polymerase subunits E and F are not required for transcription in vitro, but a Thermococcus kodakarensis mutant lacking subunit F is temperature-sensitive. Mol Microbiol 2008; 70:623 - 633
- Adrian M, Dubochet J, Lepault J, McDowall AW. Cryo-electron microscopy of viruses. Nature 1984; 308:32 - 36
- Ludtke SJ, Jakana J, Song JL, Chuang DT, Chiu W. A 11.5 Å single particle reconstruction of GroEL using EMAN. J Mol Biol 2001; 314:253 - 262
- Frank J, Radermacher M, Penczek P, Zhu J, Li Y, Ladjadj M, et al. SPIDER and WEB: processing and visualization of images in 3-D electron microscopy and related fields. J Struct Biol 1995; 116:190 - 199
- Penczek P, Grassucci RA, Frank J. The ribosome at improved resolution: New techniques for merging and orientation refinement in 3D cryoelectron microscopy of biological particles. Ultramicroscopy 1994; 53:251 - 270
- Radermacher M, Wagenknecht T, Verschoor A, Frank J. Three-dimensional reconstruction from a singleexposure, random conical tilt series applied to the 50S ribosomal subunit of Escherichia coli. J Microsc 1987; 146:113 - 116
- Kostek SA, Grob P, De Carlo S, Lipscomb JS, Garczarek F, Nogales E. Molecular architecture and conformational flexibility of human RNA polymerase II. Structure 2006; 14:1691 - 1700
- Sousa D, Grigorieff N. Ab initio resolution measurement for single particle structures. J Struct Biol 2007; 157:201 - 210
- Goddard TD, Huang CC, Ferrin TE. Visualizing density maps with UCSF Chimera. J Struct Biol 2007; 157:281 - 287
- Navaza J, Lepault J, Rey FA, Alvarez-Rua C, Borge J. On the fitting of model electron densities into EM reconstructions: a reciprocal-space formulation. Acta Cryst 2002; 58:1820 - 1825
- Castellano E, Oliva G, Navaza J. Fast rigid-body refinement for molecular replacement techniques. J Appl Cryst 1992; 25:281 - 284
- Darst SA, Kubalek EW, Kornberg RD. Three-dimensional structure of Escherichia coli RNA polymerase holoenzyme determined by electron crystallography. Nature 1989; 340:730 - 732
- De Carlo S, Carles C, Riva M, Schultz P. Cryo-negative staining reveals conformational flexibility within yeast RNA polymerase I. J Mol Biol 2003; 329:891 - 902
- Fernéndez-Tornero C, Bottcher B, Riva M, Carles C, Steuerwald U, Ruigrok RW, et al. Insights into transcription initiation and termination from the electron microscopy structure of yeast RNA polymerase III. Mol Cell 2007; 25:813 - 823
- Qureshi SA, Jackson SP. Sequence-specific DNA binding by the S. shibatae TFIIB homolog, TFB and its effect on promoter strength. Mol Cell 1998; 1:389 - 400
- Qureshi SA, Bell SD, Jackson SP. Factor requirements for transcription in the Archaeon Sulfolobus shibatae. EMBO J 1997; 16:2927 - 2936
- Kosa PF, Ghosh G, DeDecker BS, Sigler PB. The 2.1 Å crystal structure of an archaeal pre-initiation complex: TATA-box binding protein/transcription factor (II) B core/TATA-box. PNAS 1997; 94:6042 - 6047
- Leschziner AE, Nogales E. Visualizing flexibility at molecular resolution: analysis of heterogeneity in single- particle electron microscopy reconstructions. Annu Rev Biophys Biomol Struct 2007; 36:43 - 62
- Armache KJ, Mitterweger S, Meinhart A, Cramer P. Structures of complete RNA polymerase II and its subcomplex, Rpb4/7. J Biol Chem 2005; 280:7131 - 7134
- Kornberg RD. The molecular basis of eukaryotic transcription. PNAS 2007; 104:12955 - 12961
- Bell SD, Jaxel C, Nadal M, Kosa PF, Jackson SP. Temperature, template topology and factor requirements of archaeal transcription. PNAS 1998; 95:15218 - 15222
- Goede B, Naji S, von Kampen O, Ilg K, Thomm M. Protein-protein interactions in the Archaeal transcriptional machinery: binding studies of isolated RNA polymerase subunits and transcription factors. J Biol Chem 2006; 281:30581 - 30592
- Magill CP, Jackson SP, Bell SD. Identification of a conserved Archaeal RNA polymerase subunit contacted by the basal transcription factor TFB. J Biol Chem 2001; 276:46693 - 46696
- Miller G, Hahn S. A DNA-tethered cleavage probe reveals the path for promoter DNA in the yeast preinitiation complex. Nat Struct Mol Biol 2006; 13:603 - 610