Abstract
Group A streptococcus is a strict human pathogen that can cause a wide range of diseases, such as tonsillitis, impetigo, necrotizing fasciitis, toxic shock, and acute rheumatic fever. Modeling human diseases in animals is complicated, and rapid, simple, and cost-effective in vivo models of GAS infection are clearly lacking. Recently, the use of non-mammalian models to model human disease is starting to re-attract attention. Galleria mellonella larvae, also known as wax worms, have been investigated for modeling a number of bacterial pathogens, and have been shown to be a useful model to study pathogenesis of the M3 serotype of GAS. In this study we provide further evidence of the validity of the wax worm model by testing different GAS M-types, as well as investigating the effect of bacterial growth phase and incubation temperature on GAS virulence in this model. In contrast to previous studies, we show that the M-protein, among others, is an important virulence factor that can be effectively modeled in the wax worm. We also highlight the need for a more in-depth investigation of the effects of experimental design and wax worm supply before we can properly vindicate the wax worm model for studying GAS pathogenesis.
Introduction
Group A streptococcus (GAS, Streptococcus pyogenes) is a human pathogen responsible for a diverse range of infections from uncomplicated pharyngitis and tonsillitis to more severe and life threatening diseases such as necrotizing fasciitis.Citation1,Citation2 It is estimated that over 500 000 deaths are caused by GAS each year.Citation1 GAS expresses a wide array of virulence factors that are required for colonization, invasion, and immune evasion of the human host.Citation2-Citation4 One of the best characterized is the M-protein, a cell wall anchored protein that facilitates adhesion to host cells and inhibits phagocytosis by host neutrophils.Citation5,Citation6 Isogenic knockouts of the M-protein have shown reduced virulence in murine models of infection.Citation7,Citation8 The M-protein is encoded by the emm gene, of which there are over 100 types known.Citation9,Citation10 Different M-types have been associated with particular clinical syndromes. For example, M1 and M3 are associated with severe invasive disease, while M18 is associated with ARF.Citation11-Citation14 However, the same M-types are also commonly isolated from non-invasive disease patients and carriers suggesting that there may be a larger reservoir of these M-types in the population and that the dynamic interplay between pathogen and host is what ultimately determines the outcome of infection.Citation15,Citation16
The ability of GAS to sense its microenvironment and respond accordingly warrants the in vivo analysis of pathogenicity to better understand and dissect pathways involved in virulence. However, because GAS is a strict human pathogen it will always be difficult to accurately model disease in animals. Despite this there are a number of well-established models of GAS infection in mice and monkeys that have proven to be invaluable tools for dissecting events involved in GAS infection and the dynamics between pathogen and host.Citation17-Citation20 However, with the growing costs and ethical considerations involved with mammalian models, the use of non-mammalian models of infection is starting to re-attract attention.Citation21
The classic non-mammalian model organisms used for biological research are the nematode, Caenorhabditis elegans, and the common fruit fly, Drosophila melanogaster.Citation21-Citation23 Both share many advantages over mammalian models in that they are easy to obtain and convenient to use, cost-effective, and more ethically acceptable. Death as an endpoint in experiments is also able to be used, which is unacceptable for mammalian models in many countries, including New Zealand. Recently, interest in the larvae of the wax moth, Galleria mellonella (also known as the wax worm), has been gaining momentum and a number of groups have investigated its use for modeling bacterial and fungal infections.Citation24-Citation33 The main advantage the wax worm model has over C. elegans and D. melanogaster is their ability to survive at 37 °C. This is particularly important when studying human pathogens, including GAS, that naturally persist at human body temperatures. The immune system of the wax worm shares functional homology with the innate immune systems of mammals and possesses both humoral and cellular immunity.Citation34,Citation35 Importantly, wax worms have hemocytes which are very similar to mammalian phagocytic cells, and are capable of engulfing pathogenic bacteria and killing them by respiratory burst.Citation36 Recently, Olsen et al. validated the use of wax worms as an infection model for the M3-type of GAS.Citation37 In this study, we further validate the use of the wax worm infection model by using not only the M3-type of GAS, but multiple other serotypes of GAS as well. The effects of bacterial growth stage and incubation temperature were also investigated. In addition, we also show that mutants of the M1-type with attenuated virulence can be successfully modeled in the wax worm.
Results
Establishment of the wax worm model for M1 GAS (SF370) infection
To determine the pathogenicity of a M1-serotype of GAS (SF370) in wax worms, a dose titration was performed with stationary phase cultures ranging from 1 × 10⁴ colony forming units (CFU) to 2 × 10⁷ CFU. Groups of 10 wax worms were infected through their lower left proleg with each dose of GAS M1 SF370 or PBS control. PBS control injected larvae all remained alive over the 5 d time course (). In contrast, GAS-infected wax worms were killed rapidly resulting in 100% death after 1 d at doses above 6.7 × 10⁶ CFU (). Survival curves correlated with inoculum dose, with greater number of deaths observed at higher doses (). Inoculums below 8 × 10⁴ CFU were no longer lethal (data not shown). In order to obtain more subtle differences in larvae health status, each wax worm was also scored according to 4 major observations: activity, cocoon formation, melanization, and survival. Higher activity and more cocoon formation correspond to a healthier wax worm. Production of melanin by the wax worm also occurs as a result of an immune response against infection, as melanin aids to trap and kill pathogens.Citation38 Typically complete melanization (a sign that the immune response has been overwhelmed) correlates with death of the wax worm soon after. A score was assigned to each observation and an overall health index score was calculated for each wax worm. Increasing health index scores correlated well with increasing inoculum dose, and day 1 health index scores reflected the final outcome of wax worms at day 5 ().
Figure 1. Virulence of different growth phases of M1 GAS in wax worms. Wax worms were inoculated with a dose titration of fresh stationary (St) phase, fresh exponential (Exp) phase, or pre-frozen exponential phase M1 GAS and monitored daily for 5 d. (A) Kaplan-Meier survival curves of wax worms infected with a dose titration of stationary phase M1 GAS. *P < 0.05 (log-rank). (B) Mean ± SEM health index scores of wax worms infected with a dose titration of stationary phase M1 GAS. *P < 0.05 (2-way ANOVA). (C) Nonlinear regression of wax worm death on day 1 post-infection with a dose titration of stationary or exponential phase cultures of M1 GAS. (D) Mean ± SEM health index scores of wax worms 1 d post-infection with a dose titration of stationary or exponential phase cultures of M1 GAS.
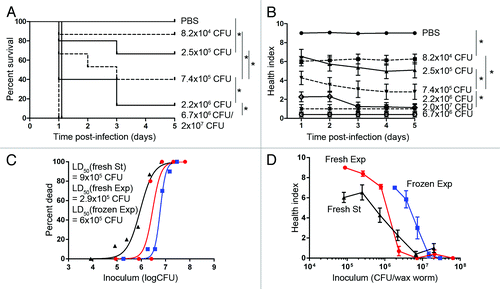
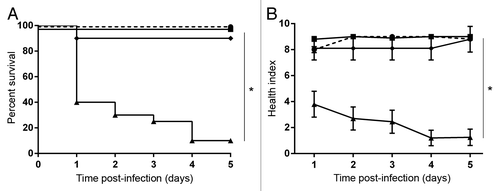
The metabolic state of bacteria is known to affect their pathogenicity due to the regulation of expressed virulence factors.Citation39-Citation41 To test if the growth phase of bacteria has any effect on virulence toward wax worms, M1 GAS was grown to exponential phase prior to injection. In addition, cultures were also frozen at exponential phase and thawed at the time of inoculation to determine the effect of storage on bacterial virulence. Fresh exponential phase cultures were more virulent than frozen exponential phase cultures with lower health index scores () and lower day 1 LD50 concentrations of 2.9 × 10⁶ CFU/wax worm and 6 × 10⁶ CFU/wax worm, respectively (). The higher virulence observed with fresh cultures is expected due to its greater metabolically active state prior to inoculation. Surprisingly however, fresh exponential phase cultures were ~3-fold less virulent than fresh stationary phase cultures of GAS (). Although a number of virulence factors are known to be differentially expressed during exponential and stationary phase cultures, many cell-wall associated factors are more highly expressed during early growth stages while secreted virulence factors tend to have higher expression during later growth stages. To test if secreted virulence factors are involved in the enhanced virulence of stationary phase GAS, filtered supernatants from either fresh exponential phase or fresh stationary phase cultures were injected directly into wax worms and monitored for toxicity. Complete survival and high health index scores of wax worms were observed with both exponential phase supernatants and media controls (). In contrast, wax worms injected with stationary phase supernatants showed a rapid decline in health and survival (). This toxicity seen with stationary phase supernatants was negated when supernatants were heat-treated prior to injection ().
Figure 2. Toxicity of exponential or stationary phase supernatants of M1 GAS in wax worms. M1 GAS was grown to exponential or stationary phase and supernatants collected and filter sterilized prior to injection. Where indicated, heat-inactivation of supernatant was performed at 60 °C for 1 h prior to injection. (A) Kaplan-Meier survival curves of wax worms injected with exponential phase supernatant (squares), stationary phase supernatant (triangles), heat-inactivated stationary phase supernatant (diamonds), or media alone (circles). *P < 0.05 (log-rank). (B) Mean ± SEM health index scores of wax worms injected with exponential phase supernatant (squares), stationary phase supernatant (triangles), heat-inactivated stationary phase supernatant (diamonds), or media alone (circles). *P < 0.05 (2-way ANOVA).
Although higher virulence was achieved using fresh cultures of GAS, to enable better comparison with previously published work on the M3-serotype of GAS in wax worms,Citation37 the remainder of experiments were performed with frozen exponential phase cultures.
Kinetics of bacterial growth in vivo
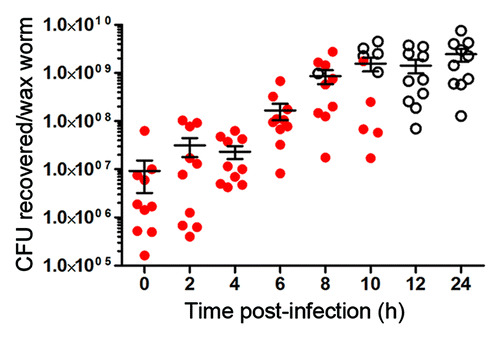
To determine the kinetics of bacterial growth in vivo, wax worms were infected with a lethal dose of M1 GAS. At each time point, individual wax worms were homogenized in PBS and plated for bacterial enumeration. As expected, bacterial numbers increased over time until reaching what seems to be a critical value that causes death of the wax worm between 108 and 109 CFU (). By 12 h there were no longer any surviving wax worms; however, bacteria were able to continue to survive within the dead wax worm for at least a further 12 h (). To ensure that the bacteria recovered from these wax worms were GAS, a spectinomycin-resistant mutant of GAS SF370 was tested in a similar manner. In absence of GAS infection, there was a baseline level of natural flora recovered from wax worms that were able to grow on BHI agar, but not BHI agar containing spectinomycin (Fig. S2A). However, the growth of natural flora was quickly overtaken when the spectinomycin-resistant GAS was injected, so that the majority of bacteria that were recovered from these wax worms were GAS. This was shown by the similar bacterial counts recovered on BHI vs. BHI/spectinomycin agar (Fig. S2B). In vivo growth kinetics of the spectinomycin-resistant GAS was similar to WT GAS.
Figure 3. Kinetics of M1 GAS bacterial growth in vivo. Wax worms were inoculated with a lethal dose of M1 GAS. At each time point, wax worms were homogenized in 0.5 ml PBS and β-hemolytic bacteria enumerated by plating on blood agar. Each symbol represents bacterial counts obtained from an individual wax worm. Closed circles represent wax worms that were still alive, open circles represent wax worms that were dead. Line indicates the mean ± SEM.
The effect of incubation temperature on GAS virulence
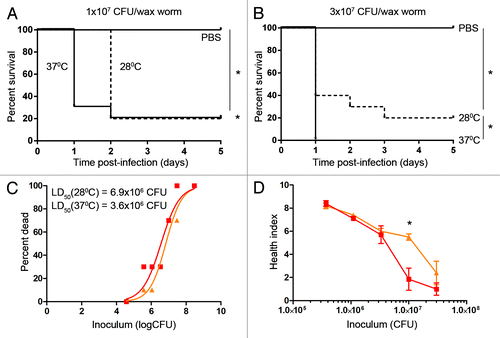
The effect of incubation temperature on GAS virulence was tested by maintaining wax worms at either 28 °C or 37 °C post-infection. Temperature did not affect the survival of wax worms injected with the PBS control (). However, dropping the temperature had a minor effect on wax worms injected with M1 GAS by delaying death at higher inoculums (). There was no significant difference in survival at inoculums 3.3 × 10⁶ CFU and below (data not shown). Day 1 LD50 values were approximately 2-fold higher in wax worms maintained at 28 °C (6.9 × 10⁶ CFU/wax worm) compared with wax worms maintained at 37 °C (3.6 × 10⁶ CFU/wax worm) () and significant differences in day 1 health index scores were only observed at 1 × 10⁷ CFU ().
Figure 4. The effect of incubation temperature on GAS virulence. Wax worms were infected with a dose titration of M1 GAS then maintained at either 28 °C or 37 °C. (A) Kaplan-Meier survival curves of wax worms infected with 1 × 10⁷ CFU M1 GAS/wax worm. *P < 0.05 (log-rank). (B) Kaplan-Meier survival curves of wax worms infected with 3 × 10⁷ CFU M1 GAS/wax worm. *P < 0.05 (log-rank). (C) Nonlinear regression of wax worm death at day 1 post-infection at 28 °C (triangles) or 37 °C (squares). (D) Mean ± SEM day 1 health index scores of wax worms maintained at either 28 °C (triangles) or 37 °C (squares). *P < 0.05 (t-test).
Attenuated virulence mutants of M1 GAS can be monitored in the wax worm model
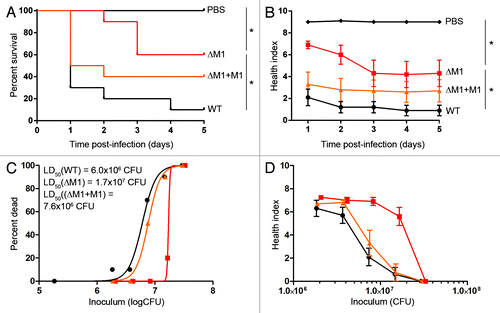
One of the potential uses of the wax worm model could be to screen novel genetic mutations for altered phenotypes. As proof of principle, we took two known virulence factors of GAS and created isogenic knockout mutants using a gene replacement strategy. Complemented strains were also created for each knockout mutant to reintroduce the full length gene in a constitutively active plasmid. M-protein is an important and well characterized virulence factor that has many functions including adhesion and immune evasion. Wax worms inoculated with the M-protein knockout mutant (ΔM1) had enhanced survival and higher health index scores compared with wax worms inoculated with WT GAS (). Complementing the knockout mutant with the full-length emm gene (ΔM1+M1) restored the survival rate and health status to levels comparable to WT (). These results were reflected by the day 1 LD50 values which were 6 × 10⁶ CFU for WT, 7.6 × 10⁶ CFU for ΔM1+M1, and 1.7 × 10⁷ CFU for ΔM1 (). Bacteria recovered from wax worms over the first 24 h suggested that reduced virulence of the M-protein knockout mutant may be due to a reduction in replication/survival rate as shown by a shift to the right of the in vivo growth kinetic curve compared with WT (Fig. S3).
Figure 5. Knockout of M-protein in M1 GAS reduces virulence in the wax worm model. Wax worms were inoculated with a dose titration of WT (circles), M-protein knockout (squares), or M-protein complemented (triangles) GAS and monitored daily for 5 d. (A) Kaplan-Meier survival curves at an inoculum of 7.5 × 10⁶ CFU/wax worm. *P < 0.05 (log-rank test). (B) Mean ± SEM health index scores of wax worms post-infection with 7.5 × 10⁶ CFU/wax worm. *P < 0.05 (2-way ANOVA). (C) Nonlinear regression of wax worm death at day 1 post-infection. (D) Mean health ± SEM index scores of wax worms at day 1 post-infection.
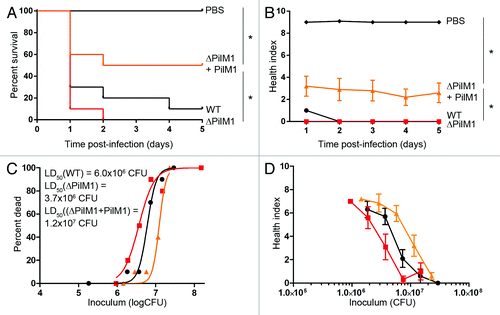
The second mutant tested was the GAS pilus knockout (ΔPilM1) and complemented strain (ΔPilM1+PilM1). Pilus structures are found on the surface of GAS, and have been described to aid in bacterial adherence to the host and in biofilm formation.Citation42-Citation44 Surprisingly, the pilus knockout mutant showed increased virulence compared with the WT, although this did not reach statistical significance (). Bacteria recovered from wax worms infected with ΔPilM1 indicated that replication/survival rate was increased in this mutant as shown by a shift to the left of the in vivo growth kinetic curve compared with WT (Fig. S3). Significantly higher survival rates and health index scores were observed with the complemented strain compared with the knockout mutant (), suggesting that constitutive expression of the pilus reduces virulence. These results were reflected by the LD50 values which were highest for ΔPilM1+PilM1 at 1.2 × 10⁷ CFU, followed by WT at 6 × 10⁶ CFU, and ΔPilM1 at 3.7 × 10⁶ CFU.
Figure 6. Constitutive pilus expression in M1 GAS decreases virulence in the wax worm model. Wax worms were inoculated with a dose titration of WT (circles), pilus knockout (squares), or pilus complemented (triangles) GAS and monitored daily for 5 d. (A) Kaplan-Meier survival curves at an inoculum of 7.5 × 10⁶ CFU/wax worm. *P < 0.05 (log-rank test). (B) Mean ± SEM health index scores of wax worms post-infection with 7.5 × 10⁶ CFU/wax worm. *P < 0.05 (2-way ANOVA). (C) Nonlinear regression of wax worm death at day 1 post-infection. (D) Mean health ± SEM index scores of wax worms at day 1 post-infection.
Differential virulence observed from various GAS M-types
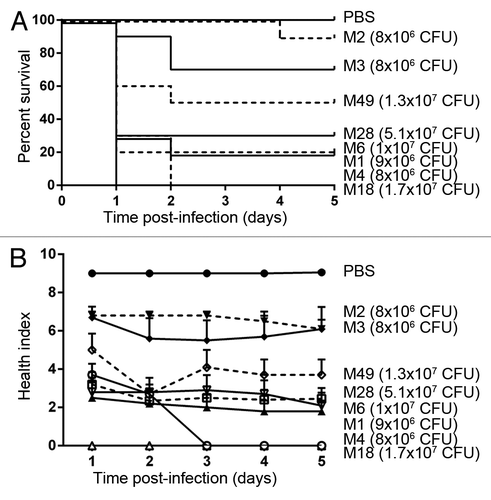
To show that multiple strains of GAS can be pathogenic in the wax worm model, eight different strains, each representing a different M-type, were tested. Although it was difficult to compare between M-types because they did not all receive exactly the same dose, it was clear that infection with different M-type strains gave a wide range of responses in the wax worm model ().
Figure 7. Different M-types of GAS are able to infect wax worms to different degrees. (A) Kaplan-Meier survival curves of wax worms over 5 d post-infection with ~1 × 10⁷ CFU GAS. (B) Mean ± SEM health index scores of wax worms over 5 d post-infection with ~1 × 10⁷ CFU GAS.
Discussion
The use of wax worms for modeling bacterial infections in vivo has been investigated for a number of pathogens. However, only one study thus far has investigated the use of wax worms for modeling GAS in vivo. In this study we provide further evidence toward the validity of the wax worm model by testing different GAS serotypes and investigating the effect of a number of environmental factors on infection. The additional use of the health index scoring system also enabled measurement of some of the more subtle differences that are often observed during wax worm infection. Health index scores from a very early stage post-infection correlated well with infectious dose, with higher inoculums resulting in lower health index scores. Day 1 health index scores could therefore be used as a predictor of the overall outcome of infection without the need to monitor wax worms for extended periods of time.
One surprising finding was that stationary phase cultures of GAS were more pathogenic than exponential phase cultures of GAS, with use of stationary phase cultures resulting in a ~3-fold lower LD50 (). While this difference was not large, it suggests that virulence factors expressed during the later stage of bacteria growth may be more deliterious to wax worms than those expressed during exponential phase. It is known that many virulence factors are differentially expressed during different growth phases of GAS.Citation39-Citation41 Those involved in immune evasion, adherence, and internalization, for example the M-protein, are more highly expressed during exponential phase of growth to aid in host colonization.Citation40 Conversely, during stationary growth, factors involved in local tissue destruction and bacterial spreading, for example the cysteine protease SpeB, are upregulated.Citation40 The increase in virulence at the stationary growth phase may therefore reflect the greater impact of these later-expressed genes on wax worms. This difference in virulence may also be dependent on the route of infection as the “colonization” stage is somewhat bypassed by injecting the bacteria directly into the hemocoel. Because secreted virulence factors are often upregulated during the stationary phase of GAS growth, supernatants from either exponential phase or stationary phase cultures were injected directly into wax worms to test for toxicity. Results showed that a secreted, heat-labile factor active during stationary phase was indeed involved in toxicity to wax worms. However, we cannot exclude the possibility that this factor was also produced during exponential phase, but had simply not accumulated in the supernatant to high enough levels to be toxic.
When maintained at 37 °C post-inoculation, bacterial burden increased within the wax worm over time and reaches a plateau at ~1 × 10⁹ CFU (). This appears to be a critical value for the GAS strain that causes death of a wax worm, as CFUs recovered from dead wax worms regardless of the inoculum dose or time of death were always approximately 1 × 10⁹ CFU ().
The effect of incubation temperature was also investigated in this study, as one of the benefits the wax worm model has over other insect models is their ability to survive at human body temperatures. A minor delay in wax worm death was observed with some inoculums when wax worms were maintained at a lower temperature (28 °C) post-infection (), as one might expect due to the growth disadvantage of the bacteria at this temperature. However, we cannot exclude the possibility that known differences in temperature-dependent virulence factor expressionCitation45 may have caused this delay.
Attenuated virulence mutants of M1 GAS can be monitored in the wax worm model. In this study we show that the M-protein knockout mutant had reduced virulence compared with the WT strain, with virulence being restored with the complemented strain (). These results are consistent with experiments using a mouse model of GAS infection.Citation7,Citation8 However, these results contrast those published by Olsen et al. who suggested that an M-protein mutation may not be as important in wax worms as it is in mammals due to the lack of expression of specific mammalian targets in the wax worm.Citation37 However, this suggestion was based on the lack of correlation between the LD50 values in mice vs. wax worms of a M3-carrier strain that had a natural deletion of the N-terminal region of the M-protein.Citation37 The authors did not however exclude the possibility that there were other virulence factors that were also differentially expressed in this strain that may have caused the increased virulence in wax worms compared with those observed in mice. Another possibility is that the small 195 bp deletion of the M-protein found in this M3-carrier strain affected the function of the M3 protein in a different way from a complete knockout.
Interestingly, the pilus knockout mutant had an opposing effect, showing increased virulence compared with the complemented strain (). One explanation might be because pilus proteins are often expressed early on during infection to aid in colonization, but are subsequently downregulated to promote bacterial spread.Citation46 Having a constitutively expressed pilus in the complemented strain may have prevented bacterial spreading and therefore reduced virulence in this model. A similar effect was observed in a murine model of infection using a knockout mutant of the major pilus protein.Citation47 The authors of this study showed that the enhanced virulence observed in mice with the major pilus protein knockout was due to the prevention of neutrophil entrapment.Citation47
To confirm that multiple serotypes of GAS were pathogenic in the wax worm model, we tested an additional 7 M-types of GAS (originating from patients with a range of diseases from uncomplicated pharyngitis to severe invasive disease) and observed a wide variation in responses (). This confirmed that multiple M-types were able to cause infection in wax worms, but did not show any correlation between virulence in wax worms and severity of disease in humans from which the samples were taken. Correlations between virulence in wax worms and human disease will however require far larger libraries of GAS strains to be tested. Of note is that the M3 strain used in this study was the same reference strain used in the study by Olsen et al.,Citation37 MGAS315. MGAS315 was clearly less pathogenic in our study () compared with the previously published LD50 of below 105 CFU for this strain.Citation37 Although more of the same strains need to be tested in different labs to draw meaningful conclusions, this highlights the potential differences either in wax worms provided by different suppliers, environmental, or experimental conditions. In a recent publication, Banville et al.Citation48 showed that nutritional deprivation led to a reduction in immune response and an increased susceptibility to infection. This does not explain the differences between our study and that conducted by Olsen et al. as both our wax worms were starved post-infection. However, there were other differences including equilibration at different temperatures pre-inoculation. Additional inconsistencies may also arise from wax worms coming from different suppliers such as the type of food, use of antibiotics, natural flora, or genetic make-up. While the wax worm model is unable to fully recapitulate GAS pathogenesis in humans, we have shown that it can provide a useful and cost-effective tool to answer certain questions. As more research groups begin to use wax worms as a model for infection, we also highlight the need for more information about wax worm supply, and further investigation on the effects of different experimental conditions on susceptibility to infection.
Materials and Methods
Bacterial strains and cultures
WT reference strains for each of the 8 M-types used in this study are described in . Unless otherwise stated, GAS strains were prepared by culturing in brain heart infusion media (BHI) at 37 °C under static conditions until reaching an optical density at 600 nm (OD600) of 0.4–0.6. Media was then removed and bacteria resuspended in phosphate buffered saline (PBS) containing 10% glycerol at an OD600 equivalent to 10. Aliquots were stored at −80 °C until required. When using fresh cultures, bacteria were cultured overnight at 37 °C (for stationary phase) or diluted 1/10 the next day and incubated at 37 °C until OD600 = 0.4–0.6 (for exponential phase cultures). Prior to all inoculations, bacteria were washed once with PBS, and then diluted to the required concentration with PBS before injection. The infecting dose was confirmed for each experiment by serial dilution and colony counting. Kanamycin (200 µg/ml) or spectinomycin (100 µg/ml) was added to growth media where required.
Table 1. GAS strains used in this study
Generation of knockout and complemented strains
The M-protein knockout strain (ΔM1) was generated by gene-replacement using the plasmid pFW11.Citation49 Flanking regions of the emm1 gene of GAS SF370 were amplified using spyM1_2018 FR1 F/R and spyM1_2018 FR2 F/R primer pairs. PCR products were cloned into pFW11 at MCS-1 and MCS-2 flanking the spectinomycin resistance (aad9) gene, and the construct electroporated into GAS SF370. Knockout mutants were selected by spectinomycin resistance and confirmed by PCR using gene-specific primer pairs spyM1_2018r F/R and aad9F/spyM1_2018 FR2R (Fig. S1). The ΔM1 mutant was complemented by re-introducing the emm1 gene in the pLZ12-Km2 plasmidCitation50 (ΔM1+M1). Briefly, the full length emm1 gene was amplified using the spyM1_2018 FL F/R primer pair and cloned into the EcoRI-BamHI sites of pLZ12-Km2. This construct was then electroporated into the ΔM1 mutant, screened by kanamycin resistance, and confirmed by PCR using the gene-specific primer pairs spyM1_2018r F/R and aad9.fw/spyM1_2018 FR2R (Fig. S1).
The pilus knockout (ΔPilM1) and the pilus complemented strains (ΔPilM1 + PilM1) were generated in a similar way using the primer pairs spyM1_0125 FR1 F/R, spyM1_0130 FR2 F/R, and PilM_Bam fw/rev. Presence or absence of the pilus operon was confirmed by PCR using gene-specific primers spy0128 fw/rev and aad9.fw/spyM1_0130 FR2R (Fig. S1). Pilus expression was phenotypically confirmed by western blot of cell wall extracts using polyclonal rabbit IgG against spy0128 as described elsewhere.Citation51
The spectinomycin-resistant mutant of SF370 was generated by gene replacement of the non-essential sugar phosphate isomerase spy0535Citation52 using the primer pairs spyM1_0535 FR1 F/R and spyM1_0535 FR2 F/R.
All primers used are listed in .
Table 2. PCR primers
Infection of Galleria mellonella larvae
Galleria mellonella larvae were purchased from Biosuppliers, maintained at room temperature in the dark with food, and used within 2 weeks. As the normal supply of larvae were supplemented with tetracycline in their feed, which prevented their infection by GAS (data not shown), a special supply of antibiotic-free larvae was purchased. Larvae weighed between 100 and 150 mg at time of inoculation. Ten larvae per group were each injected with 20 µl of inoculum into the lower left proleg using an insulin syringe. Each group of 10 insects were incubated at 37 °C in 9 cm petri dishes without food for up to 5 d unless otherwise specified.
Monitoring of Galleria mellonella larvae
Post-infection, Galleria mellonella larvae were monitored daily for the following attributes: Activity, extent of silk production (cocoon formation), melanization, and survival. A score was provided for each attribute that contributed toward an overall health index of an individual wax worm (Wiles, unpublished). A healthy, uninfected wax worm typically scores between 9 and 10, and an infected, dead wax worm typically scores 0. Scoring for each attribute has been summarized in . Where relevant, wax worms were suspended in 0.5 ml PBS and homogenized by mechanical disruption. Serial dilution and plating of the homogenate onto horse blood agar or BHI agar with or without spectinomycin (100 µg/ml) or kanamycin (200 µg/ml) where appropriate, was performed to determine the bacterial burden per wax worm.
Table 3. Health index scoring system
| Abbreviations: | ||
| GAS | = | group A streptococcus, CFU, colony forming units |
Additional material
Download Zip (358.5 KB)Acknowledgments
We would like to thank Andreas Podbielski (University of Rostock) for sending us the pFW11 vector and Nobuhiko Okada (Kitasato University) for providing the pLZ12km2 vector. This work was supported by a grant from the Health Research Council of New Zealand to TP. SW is supported by a Sir Charles Hercus Fellowship from the Health Research Council of New Zealand. The funders had no role in study design.
Disclosure of Potential Conflicts of Interest
No potential conflicts of interest were disclosed.
Supplemental Materials
Supplemental materials may be found here: www.landesbioscience.com/journals/virulence/article/24930
References
- Carapetis JR, Steer AC, Mulholland EK, Weber M. The global burden of group A streptococcal diseases. Lancet Infect Dis 2005; 5:685 - 94; http://dx.doi.org/10.1016/S1473-3099(05)70267-X; PMID: 16253886
- Cunningham MW. Pathogenesis of group A streptococcal infections and their sequelae. Adv Exp Med Biol 2008; 609:29 - 42; http://dx.doi.org/10.1007/978-0-387-73960-1_3; PMID: 18193655
- Chaussee MA, McDowell EJ, Chaussee MS. Proteomic analysis of proteins secreted by Streptococcus pyogenes. Methods Mol Biol 2008; 431:15 - 24; PMID: 18287744
- Severin A, Nickbarg E, Wooters J, Quazi SA, Matsuka YV, Murphy E, et al. Proteomic analysis and identification of Streptococcus pyogenes surface-associated proteins. J Bacteriol 2007; 189:1514 - 22; http://dx.doi.org/10.1128/JB.01132-06; PMID: 17142387
- Fischetti VA. Streptococcal M protein: molecular design and biological behavior. Clin Microbiol Rev 1989; 2:285 - 314; PMID: 2670192
- Bisno AL, Brito MO, Collins CM. Molecular basis of group A streptococcal virulence. Lancet Infect Dis 2003; 3:191 - 200; http://dx.doi.org/10.1016/S1473-3099(03)00576-0; PMID: 12679262
- Waldemarsson J, Stålhammar-Carlemalm M, Sandin C, Castellino FJ, Lindahl G. Functional dissection of Streptococcus pyogenes M5 protein: the hypervariable region is essential for virulence. PLoS One 2009; 4:e7279; http://dx.doi.org/10.1371/journal.pone.0007279; PMID: 19794915
- Ashbaugh CD, Warren HB, Carey VJ, Wessels MR. Molecular analysis of the role of the group A streptococcal cysteine protease, hyaluronic acid capsule, and M protein in a murine model of human invasive soft-tissue infection. J Clin Invest 1998; 102:550 - 60; http://dx.doi.org/10.1172/JCI3065; PMID: 9691092
- Facklam RF, Martin DR, Lovgren M, Johnson DR, Efstratiou A, Thompson TA, et al. Extension of the Lancefield classification for group A streptococci by addition of 22 new M protein gene sequence types from clinical isolates: emm103 to emm124. Clin Infect Dis 2002; 34:28 - 38; http://dx.doi.org/10.1086/324621; PMID: 11731942
- Beall B, Facklam R, Thompson T. Sequencing emm-specific PCR products for routine and accurate typing of group A streptococci. J Clin Microbiol 1996; 34:953 - 8; PMID: 8815115
- O’Brien KL, Beall B, Barrett NL, Cieslak PR, Reingold A, Farley MM, et al. Epidemiology of invasive group a streptococcus disease in the United States, 1995-1999. Clin Infect Dis 2002; 35:268 - 76; http://dx.doi.org/10.1086/341409; PMID: 12115092
- Colman G, Tanna A, Efstratiou A, Gaworzewska ET. The serotypes of Streptococcus pyogenes present in Britain during 1980-1990 and their association with disease. J Med Microbiol 1993; 39:165 - 78; http://dx.doi.org/10.1099/00222615-39-3-165; PMID: 8366514
- Sharkawy A, Low DE, Saginur R, Gregson D, Schwartz B, Jessamine P, et al, Ontario Group A Streptococcal Study Group. Severe group a streptococcal soft-tissue infections in Ontario: 1992-1996. Clin Infect Dis 2002; 34:454 - 60; http://dx.doi.org/10.1086/338466; PMID: 11797171
- Veasy LG, Tani LY, Daly JA, Korgenski K, Miner L, Bale J, et al. Temporal association of the appearance of mucoid strains of Streptococcus pyogenes with a continuing high incidence of rheumatic fever in Utah. Pediatrics 2004; 113:e168 - 72; http://dx.doi.org/10.1542/peds.113.3.e168; PMID: 14993572
- Ranin L, Opavski N, Djukic S, Mijac V. Epidemiology of diseases caused by Streptococcus pyogenes in Serbia during a nine-year period (1991-1999). Indian J Med Res 2004; 119:Suppl 155 - 9; PMID: 15232184
- Su YF, Wang SM, Lin YL, Chuang WJ, Lin YS, Wu JJ, et al. Changing epidemiology of Streptococcus pyogenes emm types and associated invasive and noninvasive infections in Southern Taiwan. J Clin Microbiol 2009; 47:2658 - 61; http://dx.doi.org/10.1128/JCM.01078-09; PMID: 19515840
- Roberts S, Scott JR, Husmann LK, Zurawski CA. Murine models of Streptococcus pyogenes infection. Curr Protoc Microbiol 2006; Chapter 9:Unit 9D 5.
- Skinner JM, Caro-Aguilar IC, Payne AM, Indrawati L, Fontenot J, Heinrichs JH. Comparison of rhesus and cynomolgus macaques in a Streptococcus pyogenes infection model for vaccine evaluation. Microb Pathog 2011; 50:39 - 47; http://dx.doi.org/10.1016/j.micpath.2010.10.004; PMID: 21035535
- Shea PR, Virtaneva K, Kupko JJ 3rd, Porcella SF, Barry WT, Wright FA, et al. Interactome analysis of longitudinal pharyngeal infection of cynomolgus macaques by group A Streptococcus. Proc Natl Acad Sci U S A 2010; 107:4693 - 8; http://dx.doi.org/10.1073/pnas.0906384107; PMID: 20179180
- Sumby P, Tart AH, Musser JM. A non-human primate model of acute group a Streptococcus pharyngitis. Methods Mol Biol 2008; 431:255 - 67; PMID: 18287762
- Glavis-Bloom J, Muhammed M, Mylonakis E. Of model hosts and man: using Caenorhabditis elegans, Drosophila melanogaster and Galleria mellonella as model hosts for infectious disease research. Adv Exp Med Biol 2012; 710:11 - 7; http://dx.doi.org/10.1007/978-1-4419-5638-5_2; PMID: 22127881
- Kurz CL, Ewbank JJ. Infection in a dish: high-throughput analyses of bacterial pathogenesis. Curr Opin Microbiol 2007; 10:10 - 6; http://dx.doi.org/10.1016/j.mib.2006.12.001; PMID: 17178462
- Mahajan-Miklos S, Rahme LG, Ausubel FM. Elucidating the molecular mechanisms of bacterial virulence using non-mammalian hosts. Mol Microbiol 2000; 37:981 - 8; http://dx.doi.org/10.1046/j.1365-2958.2000.02056.x; PMID: 10972817
- Arvanitis M, Glavis-Bloom J, Mylonakis E. Invertebrate models of fungal infection. Biochim Biophys Acta 2013; In press PMID: 23517918
- Desbois AP, Coote PJ. Wax moth larva (Galleria mellonella): an in vivo model for assessing the efficacy of antistaphylococcal agents. J Antimicrob Chemother 2011; 66:1785 - 90; http://dx.doi.org/10.1093/jac/dkr198; PMID: 21622972
- Erickson DL, Russell CW, Johnson KL, Hileman T, Stewart RM. PhoP and OxyR transcriptional regulators contribute to Yersinia pestis virulence and survival within Galleria mellonella. Microb Pathog 2011; 51:389 - 95; http://dx.doi.org/10.1016/j.micpath.2011.08.008; PMID: 21964409
- Evans BA, Rozen DE. A Streptococcus pneumoniae infection model in larvae of the wax moth Galleria mellonella. Eur J Clin Microbiol Infect Dis 2012; 31:2653 - 60; http://dx.doi.org/10.1007/s10096-012-1609-7; PMID: 22466968
- Harding CR, Schroeder GN, Reynolds S, Kosta A, Collins JW, Mousnier A, et al. Legionella pneumophila pathogenesis in the Galleria mellonella infection model. Infect Immun 2012; 80:2780 - 90; http://dx.doi.org/10.1128/IAI.00510-12; PMID: 22645286
- Lebreton F, Le Bras F, Reffuveille F, Ladjouzi R, Giard JC, Leclercq R, et al. Galleria mellonella as a model for studying Enterococcus faecium host persistence. J Mol Microbiol Biotechnol 2011; 21:191 - 6; http://dx.doi.org/10.1159/000332737; PMID: 22286046
- Mukherjee K, Altincicek B, Hain T, Domann E, Vilcinskas A, Chakraborty T. Galleria mellonella as a model system for studying Listeria pathogenesis. Appl Environ Microbiol 2010; 76:310 - 7; http://dx.doi.org/10.1128/AEM.01301-09; PMID: 19897755
- Senior NJ, Bagnall MC, Champion OL, Reynolds SE, La Ragione RM, Woodward MJ, et al. Galleria mellonella as an infection model for Campylobacter jejuni virulence. J Med Microbiol 2011; 60:661 - 9; http://dx.doi.org/10.1099/jmm.0.026658-0; PMID: 21233296
- Wand ME, Bock LJ, Turton JF, Nugent PG, Sutton JM. Acinetobacter baumannii virulence is enhanced in Galleria mellonella following biofilm adaptation. J Med Microbiol 2012; 61:470 - 7; http://dx.doi.org/10.1099/jmm.0.037523-0; PMID: 22194338
- Wand ME, Müller CM, Titball RW, Michell SL. Macrophage and Galleria mellonella infection models reflect the virulence of naturally occurring isolates of B. pseudomallei, B. thailandensis and B. oklahomensis. BMC Microbiol 2011; 11:11; http://dx.doi.org/10.1186/1471-2180-11-11; PMID: 21241461
- Hoffmann JA. Innate immunity of insects. Curr Opin Immunol 1995; 7:4 - 10; http://dx.doi.org/10.1016/0952-7915(95)80022-0; PMID: 7772280
- Lionakis MS. Drosophila and Galleria insect model hosts: new tools for the study of fungal virulence, pharmacology and immunology. Virulence 2011; 2:521 - 7; http://dx.doi.org/10.4161/viru.2.6.18520; PMID: 22186764
- Bergin D, Reeves EP, Renwick J, Wientjes FB, Kavanagh K. Superoxide production in Galleria mellonella hemocytes: identification of proteins homologous to the NADPH oxidase complex of human neutrophils. Infect Immun 2005; 73:4161 - 70; http://dx.doi.org/10.1128/IAI.73.7.4161-4170.2005; PMID: 15972506
- Olsen RJ, Watkins ME, Cantu CC, Beres SB, Musser JM. Virulence of serotype M3 Group A Streptococcus strains in wax worms (Galleria mellonella larvae). Virulence 2011; 2:111 - 9; http://dx.doi.org/10.4161/viru.2.2.14338; PMID: 21258213
- Cerenius L, Söderhäll K. The prophenoloxidase-activating system in invertebrates. Immunol Rev 2004; 198:116 - 26; http://dx.doi.org/10.1111/j.0105-2896.2004.00116.x; PMID: 15199959
- Unnikrishnan M, Cohen J, Sriskandan S. Growth-phase-dependent expression of virulence factors in an M1T1 clinical isolate of Streptococcus pyogenes. Infect Immun 1999; 67:5495 - 9; PMID: 10496938
- Kreikemeyer B, McIver KS, Podbielski A. Virulence factor regulation and regulatory networks in Streptococcus pyogenes and their impact on pathogen-host interactions. Trends Microbiol 2003; 11:224 - 32; http://dx.doi.org/10.1016/S0966-842X(03)00098-2; PMID: 12781526
- Chaussee MA, Dmitriev AV, Callegari EA, Chaussee MS. Growth phase-associated changes in the transcriptome and proteome of Streptococcus pyogenes. Arch Microbiol 2008; 189:27 - 41; http://dx.doi.org/10.1007/s00203-007-0290-1; PMID: 17665172
- Abbot EL, Smith WD, Siou GP, Chiriboga C, Smith RJ, Wilson JA, et al. Pili mediate specific adhesion of Streptococcus pyogenes to human tonsil and skin. Cell Microbiol 2007; 9:1822 - 33; http://dx.doi.org/10.1111/j.1462-5822.2007.00918.x; PMID: 17359232
- Becherelli M, Manetti AG, Buccato S, Viciani E, Ciucchi L, Mollica G, et al. The ancillary protein 1 of Streptococcus pyogenes FCT-1 pili mediates cell adhesion and biofilm formation through heterophilic as well as homophilic interactions. Mol Microbiol 2012; 83:1035 - 47; http://dx.doi.org/10.1111/j.1365-2958.2012.07987.x; PMID: 22320452
- Manetti AG, Zingaretti C, Falugi F, Capo S, Bombaci M, Bagnoli F, et al. Streptococcus pyogenes pili promote pharyngeal cell adhesion and biofilm formation. Mol Microbiol 2007; 64:968 - 83; http://dx.doi.org/10.1111/j.1365-2958.2007.05704.x; PMID: 17501921
- Smoot LM, Smoot JC, Graham MR, Somerville GA, Sturdevant DE, Migliaccio CA, et al. Global differential gene expression in response to growth temperature alteration in group A Streptococcus. Proc Natl Acad Sci U S A 2001; 98:10416 - 21; http://dx.doi.org/10.1073/pnas.191267598; PMID: 11517341
- Nakata M, Köller T, Moritz K, Ribardo D, Jonas L, McIver KS, et al. Mode of expression and functional characterization of FCT-3 pilus region-encoded proteins in Streptococcus pyogenes serotype M49. Infect Immun 2009; 77:32 - 44; http://dx.doi.org/10.1128/IAI.00772-08; PMID: 18852238
- Crotty Alexander LE, Maisey HC, Timmer AM, Rooijakkers SH, Gallo RL, von Köckritz-Blickwede M, et al. M1T1 group A streptococcal pili promote epithelial colonization but diminish systemic virulence through neutrophil extracellular entrapment. J Mol Med (Berl) 2010; 88:371 - 81; http://dx.doi.org/10.1007/s00109-009-0566-9; PMID: 19960175
- Banville N, Fallon J, McLoughlin K, Kavanagh K. Disruption of haemocyte function by exposure to cytochalasin b or nocodazole increases the susceptibility of Galleria mellonella larvae to infection. Microbes Infect 2011; 13:1191 - 8; http://dx.doi.org/10.1016/j.micinf.2011.07.001; PMID: 21782965
- Podbielski A, Spellerberg B, Woischnik M, Pohl B, Lütticken R. Novel series of plasmid vectors for gene inactivation and expression analysis in group A streptococci (GAS). Gene 1996; 177:137 - 47; http://dx.doi.org/10.1016/0378-1119(96)84178-3; PMID: 8921859
- Okada N, Tatsuno I, Hanski E, Caparon M, Sasakawa C. Streptococcus pyogenes protein F promotes invasion of HeLa cells. Microbiology 1998; 144:3079 - 86; http://dx.doi.org/10.1099/00221287-144-11-3079; PMID: 9846743
- Chang A, Khemlani A, Kang H, Proft T. Functional analysis of Streptococcus pyogenes nuclease A (SpnA), a novel group A streptococcal virulence factor. Mol Microbiol 2011; 79:1629 - 42; http://dx.doi.org/10.1111/j.1365-2958.2011.07550.x; PMID: 21231972
- Park HS, Francis KP, Yu J, Cleary PP. Membranous cells in nasal-associated lymphoid tissue: a portal of entry for the respiratory mucosal pathogen group A streptococcus. J Immunol 2003; 171:2532 - 7; PMID: 12928403
- Suvorov AN, Ferretti JJ. Physical and genetic chromosomal map of an M type 1 strain of Streptococcus pyogenes. J Bacteriol 1996; 178:5546 - 9; PMID: 8808951
- Beres SB, Richter EW, Nagiec MJ, Sumby P, Porcella SF, DeLeo FR, et al. Molecular genetic anatomy of inter- and intraserotype variation in the human bacterial pathogen group A Streptococcus. Proc Natl Acad Sci U S A 2006; 103:7059 - 64; http://dx.doi.org/10.1073/pnas.0510279103; PMID: 16636287
- Musser JM, Hauser AR, Kim MH, Schlievert PM, Nelson K, Selander RK. Streptococcus pyogenes causing toxic-shock-like syndrome and other invasive diseases: clonal diversity and pyrogenic exotoxin expression. Proc Natl Acad Sci U S A 1991; 88:2668 - 72; http://dx.doi.org/10.1073/pnas.88.7.2668; PMID: 1672766
- Martin JM, Green M, Barbadora KA, Wald ER. Erythromycin-resistant group A streptococci in schoolchildren in Pittsburgh. N Engl J Med 2002; 346:1200 - 6; http://dx.doi.org/10.1056/NEJMoa013169; PMID: 11961148
- Smoot JC, Barbian KD, Van Gompel JJ, Smoot LM, Chaussee MS, Sylva GL, et al. Genome sequence and comparative microarray analysis of serotype M18 group A Streptococcus strains associated with acute rheumatic fever outbreaks. Proc Natl Acad Sci U S A 2002; 99:4668 - 73; http://dx.doi.org/10.1073/pnas.062526099; PMID: 11917108
- Green NM, Zhang S, Porcella SF, Nagiec MJ, Barbian KD, Beres SB, et al. Genome sequence of a serotype M28 strain of group a streptococcus: potential new insights into puerperal sepsis and bacterial disease specificity. J Infect Dis 2005; 192:760 - 70; http://dx.doi.org/10.1086/430618; PMID: 16088825