Figures & data
Figure 1. Synthesis of AL-GP and HA-GP.
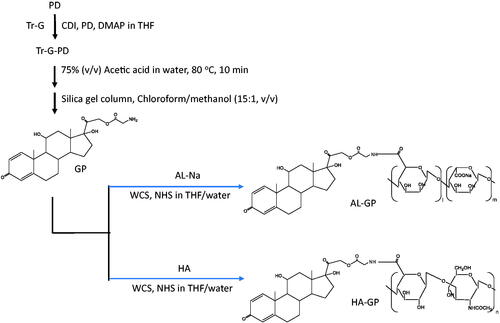
Figure 2. Schematic diagram of nanogel formation by organic solvent evaporation.
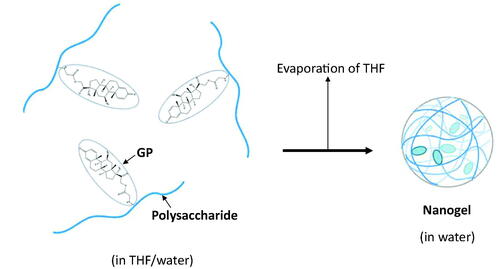
Figure 3. In vivo experimental schedules for examination of efficacy of conjugate nanogels.
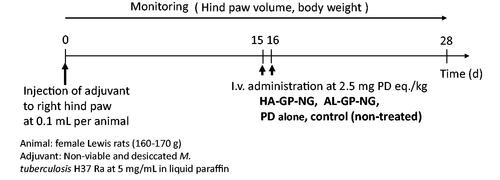
Figure 4. Size distributions of conjugate nanogels.
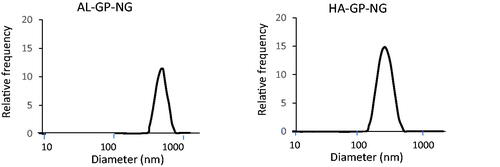
Table 1. Preparation of conjugate nanogels and their particle features.
Figure 5. In vitro release of PD from conjugate nanogels at pH 6 and 7.4 at 37 °C. The results are expressed as the mean ± S.D. (n = 3).
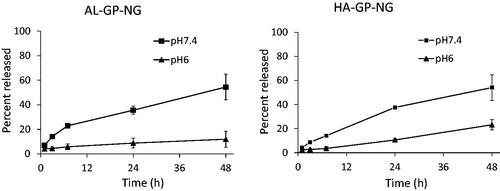
Figure 6. Plasma concentration–time profiles of free and total (free + conjugated) PD after i.v. administration of conjugate nanoparticles in normal rat. The results are expressed as the mean ± S.E. (n = 3).
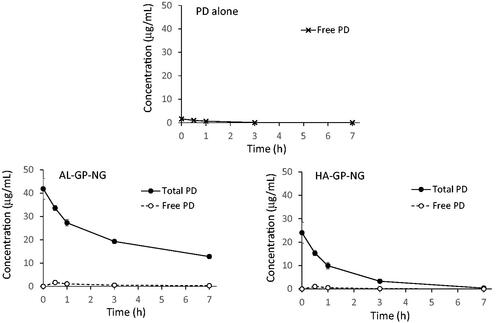
Table 2. Pharmacokinetic parameters of free and total PD in i.v. administration of AL-GP-NG to rats.
Table 3. Pharmacokinetic parameters of free and total PD in i.v. administration of HA-GP-NG to rats.
Figure 7. Change in body weight after i.v. administration of conjugate nanoparticles in rats with adjuvant-induced arthritis. The results are expressed as the mean ± S.E. (n = 3). *p< .05 vs. control.
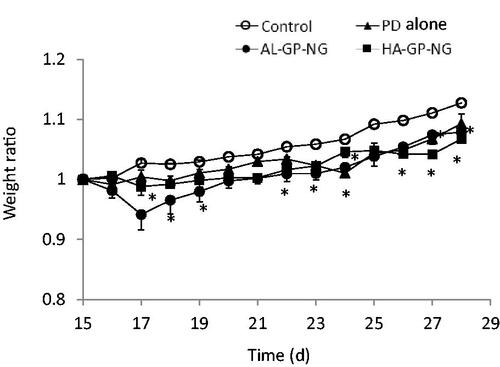
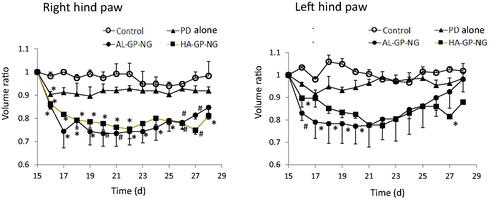
Figure 8. Change in body weight after i.v. administration of conjugate nanoparticles in rats with adjuvant-induced arthritis. The results are expressed as the mean ± S.E. (n = 3). *p< .05 vs. control and #p< .05 vs. PD alone.