
Figures & data
Figure 1. (a) Microscopy image of eggs on arrival (1 dpf), and flow-through images of eggs at (b) the beginning of the exposure period (3 dpf) and (c) the end of exposure (7 dpf). Scale bars 1 mm. Eggs shown were drawn from the sample not used in the exposure experiments.
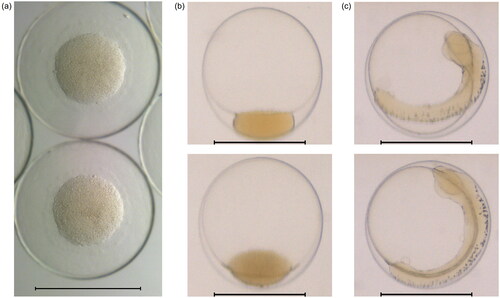
Table 1. Timeline of the experiment.
Figure 2. Example microscopy images at 17 dpf, showing: (a) a fish from the seawater 4 d control group; (b) a fish from the Statfjord A 40 d treatment group; and (c) a fish from the ULSFO 28 d-2 treatment group. Spinal deformity is visible in the SFA animal, and severe craniofacial and spinal deformities, as well as an enlarged yolk sac and pericardial edema, can be seen in the ULSFO fish. Scale bars 5 mm, 1 mm divisions.
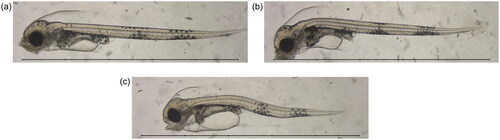
Figure 3. The imaging chamber used in this study. (a,b) show two rendered views of the 3D printed connectors used to mate the imaging chamber to the flow-through tubing, while (c) is a photo of the imaging chamber. Note the Central tube through which the samples are transported, and the two fill tubes on the right side.
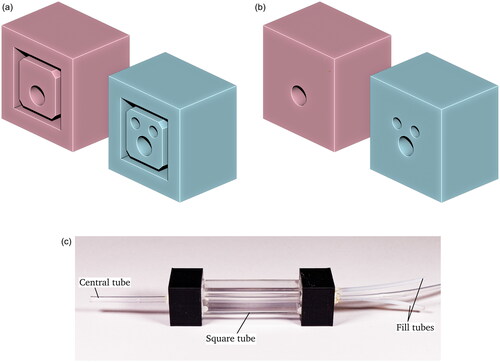
Figure 4. Example images from the automated imaging system at 17 dpf. Images show fish from 3 different treatment groups: (a) seawater 4 d (control); (b) Statfjord A 40 d; (c) ULSFO 28 d-2. The ULSFO animal shows severe developmental issues including spinal and craniofacial deformity and pericardial and yolk sac edemas. Scale bars 5 mm, 1 mm divisions.
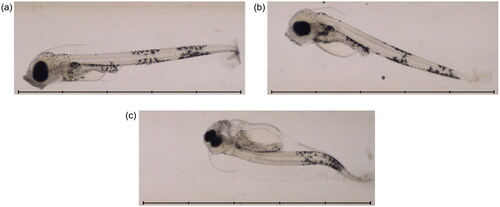
Figure 5. Comparison of mean measured values for automated and manual measurements. Blue circles (), red pluses (
) and black crosses (
) indicate the seawater, statfjord a and ULSFO groups respectively. Error bars show standard deviation. If both methods agreed exactly, points would lie on the dotted Center line. Points below the line indicate an underestimate by the automated method compared to the manual method, above the line an overestimate.
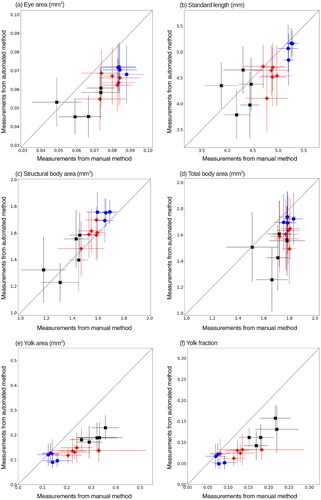
Figure 6. Difference in means of the automated and manual measurements. Blue circles (), red pluses (
) and black crosses (
) indicate the seawater, statfjord a and ULSFO groups respectively. Negative values indicate the automated method underestimates relative to the manual method, positive that it overestimates. Black lines show linear regression, indicating whether the size of the difference between methods increases with measurement size.
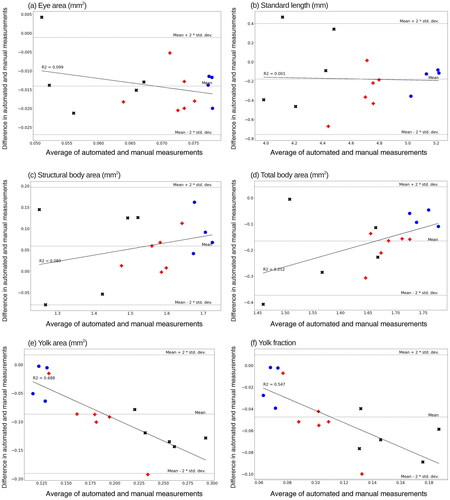
Table 2. Hatching success, and survival up to 18 dpf, of cod embryos exposed for 4 days (3–7 dpf) to seawater (SW), dissolved fraction of crude statfjord A (SF) and refined ULSFO (UL) oils incubated at 9C for up to 60 days.
Table 3. The numbers of individual fish used and measurements made by the automated system for each treatment group.
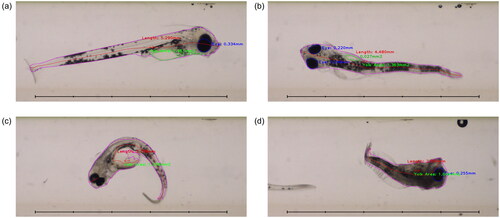
Figure 8. Flow-through images of fish with neural network segmentation and automated measurements. (a) Shows a fish from the SW-4d control group, displaying good segmentation and measurements. (b) Shows a fish from the SFA-21d group imaged from ‘above’, with poor measurement of the partially obscured yolk sac. (c) Shows a deformed fish from the ULSFO 28d-3 group imaged at an inconvenient angle, where segmentation and measurement has failed badly. (d) Shows a severely deformed (and possibly deceased) fish from the ULSFO 60d-1 group. Scale bars 5 mm, 1 mm divisions.
Supplemental Material
Download PDF (66.4 KB)Data availability statement
The data that support the findings of this study are available from the corresponding author upon reasonable request. The code used for image annotation and analysis is openly available in the ‘Fish Annotator’ repository at https://github.com/davidrwilliamson/fish-annotator, with an archive of the current version at publication available at https://doi.org/10.5281/zenodo.7934921.