Figures & data
Figure 1. Low expression of miR-187 was observed in prostate cancer. A, A heat map of the expression of the differentially expressed miRs in the GSE45604 microarray dataset. B, A heat map of the expression of the differentially expressed miRs in the GSE76260 microarray dataset. The ordinate represents the gene name. The histogram on the upper right is color gradation, with each rectangle representing a corresponding sample expression value. C, miR-187 expression in prostate cancer analyzed by starBase Pan-Cancer Analysis Platform. D, miR-187 expression in prostate cancer and adjacent normal tissues measured by RT-qPCR (N = 57). E, miR-187 expression in prostate cancer cell lines (22Rv1, LNCaP, Du145, and PC-3) and normal prostatic epithelial cell line RWPE-1 measured by RT-qPCR. F, The correlation of miR-187 expression with the prognosis of patients with prostate cancer analyzed by Kaplan-Meier curve. Panel D-F was measurement data and expressed as mean ± standard deviation. Paired t-test was used for Panel D, and in panel E, one-way ANOVA was used for the comparison among multiple groups, followed by Turkey’s post-hoc test. In panel F, the log-rank method was used for survival difference test. * p < .05 vs. adjacent normal tissues or normal prostatic epithelial cell line RWPE-1. The experiments were repeated three times.
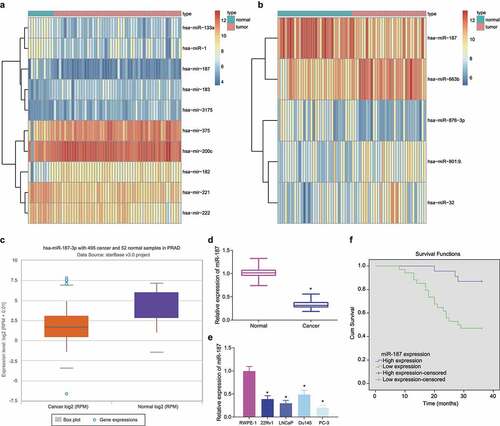
Figure 2. Overexpression of miR-187 contributes to suppression of prostate cancer cell proliferation, invasion and migration and promoted cell apoptosis. PC-3 cells were treated with NC-mimic or miR-187 mimic. A, miR-187 expression in PC-3 cells evaluated by RT-qPCR. B, Viability of PC-3 cells evaluated by CCK-8 assay. C, Apoptosis of PC-3 cells evaluated by flow cytometry. D, Invasion of PC-3 cells evaluated by Transwell assay (200×). E, Migration of PC-3 cells evaluated by Wound-healing assay. F, The protein expression of proliferation/apoptosis-related genes (Ki67, Bcl-2 and Bax) and EMT-related genes (E-cadherin, N-cadherin and Slug) in PC-3 cells evaluated by Western blot analysis. Du145 cells were treated with NC inhibitor or miR-187 inhibitor. G, miR-187 expression in Du145 cells evaluated by RT-qPCR. H, Viability of Du145 cells evaluated by CCK-8 assay. I, Apoptosis of Du145 cells evaluated by flow cytometry. J, Invasion of Du145 cells evaluated by Transwell assay (200×). K, Migration of Du145 cells evaluated by Wound-healing assay. L, The protein expression of proliferation/apoptosis-related genes (Ki67, Bcl-2 and Bax) and EMT-related genes (E-cadherin, N-cadherin and Slug) in Du145 cells evaluated by Western blot analysis. The measurement data were expressed as mean ± standard deviation. Comparison between two groups was analyzed using independent sample t-test. Comparison among groups at different time points was analyzed using two-way ANOVA. * p < .05 vs. NC mimic-treated PC-3 cells or NC inhibitor-treated Du145 cells. The experiments were repeated three times.
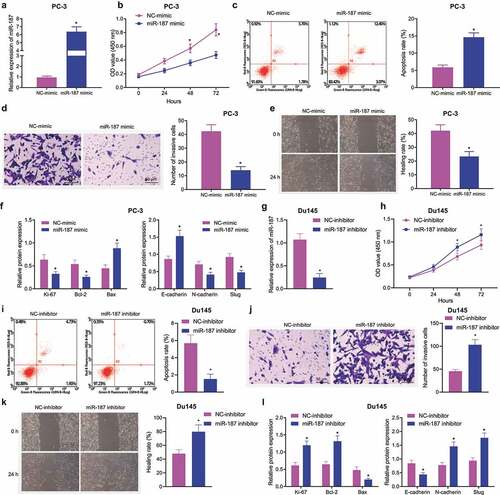
Figure 3. CD276 is a target gene of miR-187 in prostate cancer cells. A, Venn diagram of target genes of miR-187 predicted by the RNA22, miRSearch, miRDB, TarBase and DIANA databases and the differentially expressed genes in prostate cancer samples obtained from the GSE30994 microarray dataset. B, CD276 expression in prostate cancer samples in the GSE30994 microarray dataset. C, CD276 expression in prostate cancer samples analyzed by starBase Pan-Cancer Analysis Platform. D, The specific binding sites between CD276 and miR-187 predicted by the TargetScan database. E, The binding of miR-187 to CD276 verified by dual-luciferase reporter assay. F, The effect of miR-187 mimic on CD276 expression in PC-3 cells analyzed by RT-qPCR and Western blot analysis. G, The effect of miR-187 inhibitor on CD276 expression in Du145 cells was detected by RT-qPCR and Western blot analysis. H, CD276 expression in prostate cancer and adjacent normal tissues measured by immunohistochemistry (200×). I, The expression of CD276 in prostate cancer cell lines and normal prostate epithelial cell line assessed by Western blot analysis. The measurement data (E-G, I) were expressed as mean ± standard deviation. Comparison between two groups was analyzed using independent sample t-test, and one-way ANOVA was used for comparison among multiple groups, followed by Turkey’s post-hoc test. The count data (h) were analyzed by Chi-square test. * p < .05 vs. adjacent normal tissues, normal prostatic epithelial cell line RWPE-1, NC mimic-treated PC-3 cells or NC inhibitor-treated Du145 cells. The experiments were repeated three times.
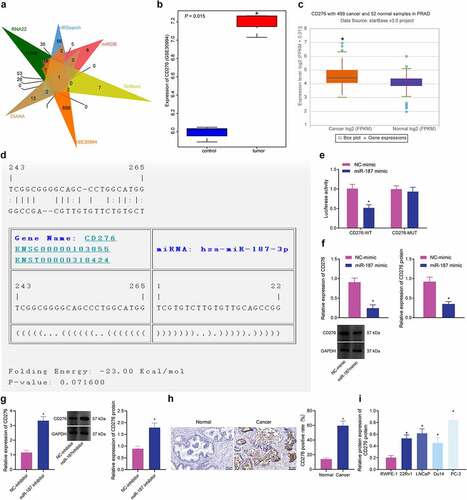
Figure 4. miR-187 downregulates CD276 and inactivates the JAK3-STAT3-Slug signaling pathway to suppress the malignant phenotype of prostate cancer cells. A, CD276 overexpression efficiency in PC-3 cells verified by RT-qPCR and Western blot analysis. PC-3 cells were treated with miR-187 mimic + oe-NC or miR-187 mimic + oe-CD276. B, miR-187 expression in PC-3 cells evaluated by RT-qPCR. C, CD276 expression in PC-3 cells evaluated by RT-qPCR and Western blot analysis. D, PC-3 cell viability evaluated by CCK-8 assay. E, PC-3 cell apoptosis evaluated by flow cytometry. F, PC-3 cell invasion evaluated by Transwell assay (200×). G, PC-3 cell migration evaluated by Wound-healing assay. H, The expression of apoptosis-related genes (Ki67, Bcl-2 and Bax) in PC-3 cells evaluated by Western blot analysis. I, The expression of the JAK3-STAT3-Slug signaling pathway-related genes in PC-3 cells evaluated by Western blot analysis. The measurement data were expressed as mean ± standard deviation. Cell viability at different time points among multiple groups was compared using two-way ANOVA, and comparison between two groups was analyzed using independent sample t-test. Comparison among multiple groups was analyzed using one-way ANOVA with Tukey’s post hoc test. * p < .05 vs. PC-3 cells treated with oe-NC or NC mimic + oe-NC. # p < .05 vs. PC-3 cells treated with miR-187 mimic + oe-NC. The experiments were repeated three times.
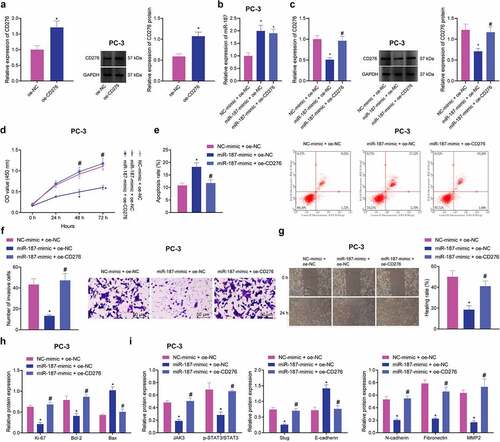
Figure 5. hBMSC-exos transfer miR-187 into prostate cancer cells. A, Expression of hBMSC surface markers CD29, CD44, CD90, CD34 and CD45 detected by flow cytometry. B, Ultrastructure of hBMSC-exos observed under a TEM (scale bar = 200 nm). C, Particle size of hBMSC-exos analyzed by Zetasizer Nano ZS. D, The expression of exosome-specific surface markers (TSG101, CD63 and CD9) in hBMSC-exos detected using Western blot analysis. E, miR-187 expression in hBMSCs and purified hBMSC-exos treated with miR-187 mimic detected by RT-qPCR. F, The uptake of hBMSC-exos by prostate cancer cells at 0, 12, 24 and 48 h observed by a fluorescence microscope (200×, PKH67: green fluorescent, DAPI: blue fluorescence). G, The expression of miR-187 and CD276 in PC-3 cells co-cultured with hBMSCs-exo-miR-187-mimic at 0, 12, 24 and 48 h detected by RT-qPCR and Western blot analysis. Measurement data were expressed as mean ± standard deviation. Comparisons between two groups were analyzed using independent sample t-test. Comparison among multiple groups was analyzed using one-way ANOVA with Tukey’s post hoc test. * p < .05 vs. PC-3 cells treated with hBMSCs-exo-NC-mimic or at 0 h. The experiments were repeated three times.
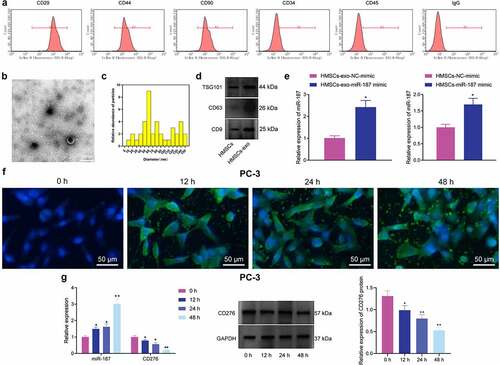
Figure 6. The delivery of miR-187 by hBMSC-exos inhibits the viability, invasion, and migration of prostate cancer cells by inhibiting CD276-dependent JAK3-STAT3-Slug signaling pathway. PC-3 cells were co-cultured with Exo-NC-mimic, Exo-miR-187-mimic or oe-CD276. A, PC-3 cell viability detected using CCK-8. B, PC-3 cell apoptosis detected using flow cytometry. C, PC-3 cell invasion detected using Transwell assay (200×). D, PC-3 cell migration detected using Wound healing test. E, The expression of CD276, JAK3-STAT3-Slug signaling pathway- and apoptosis-related genes in PC-3 cells analyzed by Western blot analysis. The measurement data were expressed as mean ± standard deviation. Cell viability at different time points among multiple groups was compared using two-way ANOVA, and comparison among multiple groups was analyzed using one-way ANOVA with Tukey’s post hoc test. * p < .05 vs. control PC-3 cells. # p < .05 vs. PC-3 cells treated with exo-NC-mimic; & p < .05 vs. PC-3 cells treated with Exo-miR-187-mimic + oe-NC. The experiments were repeated three times.
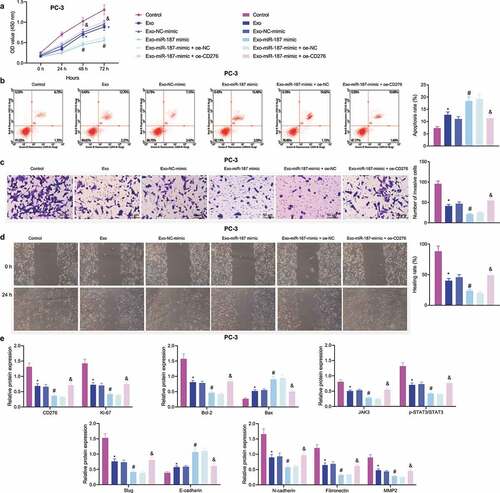
Figure 7. hBMSC-derived exosomal miR-187 inhibits tumorigenesis and metastasis of prostate cancer cells in vivo by inhibiting CD276-dependent JAK3-STAT3-Slug signaling pathway. The mice was injected with normal saline, Exo, Exo-NC-agomir, Exo-miR-187 agomir, Exo-miR-187 agomir + oe-NC, or Exo-miR-187 agomir + oe-CD276. A, Tumor volume of mice. B, The representative images of tumorigenesis and lung metastasis of nude mice. C, Tumor weight of mice. D, The number of pulmonary metastatic nodules in mice. E, The expression of miR-187 and CD276 in tumor tissues of mice detected by RT-qPCR. F, Western blot analysis of CD276, Bcl-2, E-cadherin, Bax, and the JAK3-STAT3-Slug signaling pathway-related proteins in tumor tissues of mice. Data at different time points were compared using repeated measures ANOVA and one-way ANOVA was used for the comparison among multiple groups, followed by Turkey’s post hoc test. The measurement data were expressed as mean ± standard deviation. * p < .05 vs. untreated mice; # p < .05 vs. mice treated with Exo-NC-agomir; &. p < .05 vs. mice treated with Exo-miR-187-agomir + oe-NC. n = 5.
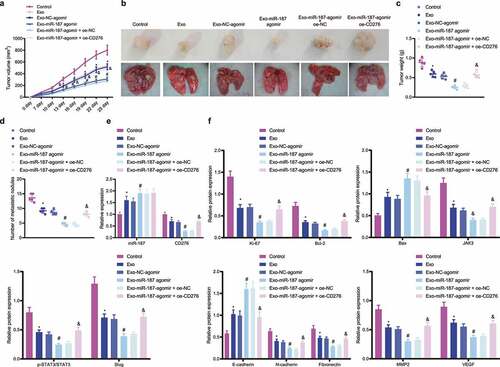
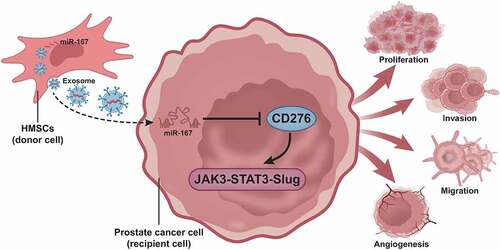
Figure 8. A molecular mechanism map depicting the involvement of hBMSC-derived exosomal miR-187 in the growth and metastasis of prostate cancer. hBMSC-derived exosomal miR-187 targeted CD276 and inactivated the JAK3-STAT3-Slug signaling pathway, thereby suppressing the growth and metastasis of prostate cancer.