Figures & data
Figure 1. Cell line development for co-expression of RMD and IgG for generation of afucosylated mAb. A. Schematic representation of expression plasmids for RMD and IgG HC and IgG LC, either in two separate vectors or in single vectors (GS-IRES-RMD and LC-IRESRMD). B. Strategy for cell line engineering and screening to co-express IgG and RMD for production of afucosylated mAb. Ci. Distribution of geometric means for stable cell lines surface-stained with FITC-LCA. LCA-stained cells from -RMD, +RMD, GS-IRES-RMD and LC-IRES-RMD were analyzed using LSRII instrument. Cii. Distribution of geometric means for stable cell lines surface-stained with FITC-LCA. LCA-stained cells from co-transfection (RMD and IgG) were analyzed using FACSCalibur instrument. Unpaired t test was used to determine the P values. D. IgG Titer distribution of stable cell lines expressing fucosylated (-RMD) or afucosylated mAbs derived from different expression vectors. Unpaired t test was used to determine the P values.
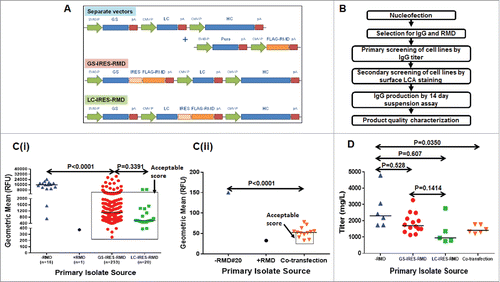
Table 1. Colony screening summary.
Figure 2. Biochemical characterization of stable cell lines and secreted IgG products. A. Detection of intracellular FLAG-RMD by western blotting in cell lysates extracted from stable primary isolates derived from GS-IRES-RMD, LC-IRES-RMD and -RMD control vectors. B. Detection of RMD mRNA expression by QRTPCR in cell lines derived from GS-IRES-RMD, LC-IRES-RMD and -RMD vectors. C. Detection of GS expression by western blotting in cell lysates extracted from cell lines derived from GS-IRES-RMD, LC-IRES-RMD and -RMD vectors. D. N-linked glycan profiles of the purified IgG products derived from cell lines with high RMD expression (GS-IRES-RMD#14, LC-IRES-RMD #15 and #17), intermediate RMD expression (GS-IRES-RMD (#2, #3) and low RMD expression (GS-IRES-RMD #6). E. Competitive cell based HTRF assay monitoring Fc gamma receptor binding (CD16a) of IgG purified from selected RMD cell lines.
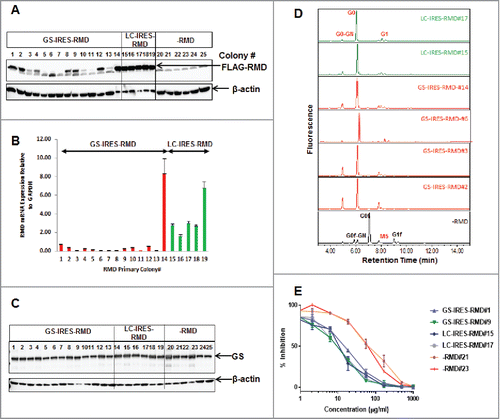
Table 2a. Fucosylation status and glycosylation profile of mAbA in presence or absence of RMD.
Table 2b. Determination of EC50 in cell-based potency assay.
Figure 3. Application of the GS-IRES-RMD Format for IgG Expression in Stable Cell Line Development Campaign. A. Strategy for cell line engineering, clone selection and phenotypic stability determination for co-expressing IgG and RMD in a single vector format for production of afucosylated mAb. B. Titer distribution on day 10 of mAb expressing clonal cells screened in 96-deep-well plates in high throughput format. C. Titer distribution of top 10 clones in 14-day fed-batch assay in shake flasks. D. LCA staining showing low binding due to afucosylation of top 10 clones. -RMD#20 cell line was used as a positive control for LCA binding to cell surface.
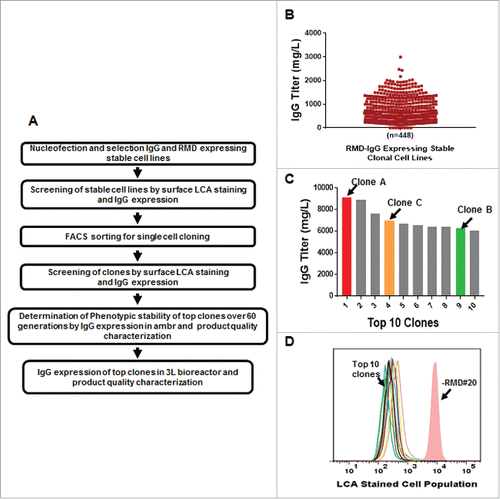
Figure 4. Phenotypic stability studies for RMD-IgG Clones in GS-IRES-RMD format. A. Consistent IgG production profile of RMD-IgG Clones A, B and C at 10, 30, 45 and 60 PDLs performed in milliliter scale in ambr15™ bioreactors in duplicate. B. Evaluation of LCA binding, a metric of afucosylation, to cell surface of IgG expressing clones co-expressing RMD at 10, 30, 45 and 60 PDL. C. Consistency in IgG expression in RMD-IgG Clones A, B and C at 45 PDL in milliliter scale in ambr15™ bioreactors and platform bench-scale 3L bioreactors.
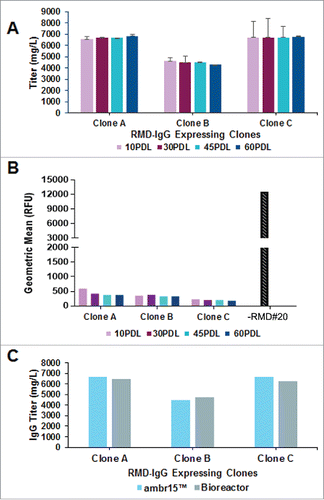
Table 3. Fucosylation status and glycosylation profile for 3 clones co-expressing RMD.
Figure 5. Reversal of afucosylation of secreted mAbs by addition of L-fucose to cell culture medium. Stable IgG cell lines co-expressing RMD were cultured in the presence or absence of L-fucose and the IgG produced monitored for fucosylation. A. Flow cytometry analysis of LCA stained cells from GS-IRES-RMD#6, LC-IRES-RMD#17 and -RMD#20 cell lines on day 6 of fed-batch culture in the presence of different concentrations of L-fucose (0, 5, 10, 20, 50, 100 µM). B. Statistical analyses of geometric mean derived from LCA cell surface stained cells growing in presence of 0, 5, 10, 20, 50 or, 100 µM of L-fucose. C. Glycan profiles of IgG purified from primary isolates GS-IRES-RMD#6 and LC-IRES-RMD#17 grown in presence of different concentrations of L-fucose. D. Western Blot analysis of purified IgG from cells expressing RMD using biotinylated LCA to detect the fucose moiety (f-HC) (upper panel). The membrane was probed for IgG HC and LC to confirm equal sample loading (lower panel). E and F. Activity of the IgG samples purified from primary isolate GS-IRES-RMD#6, LC-IRES-RMD#17 and -RMD#20 cultured in presence of different concentrations of L-fucose was measured by an HTRF-based CD16a cellular binding assay. afucosylated antibodies from GS-IRES-RMD#6 and LC-IRES-RMD#17 cell lines cultured in 0–50 µM L-fucose (dotted lines) showed higher binding activity to CD16a than fucosylated antibodies purified from cells cultured in presence of 100 µM L-fucose (solid lines).
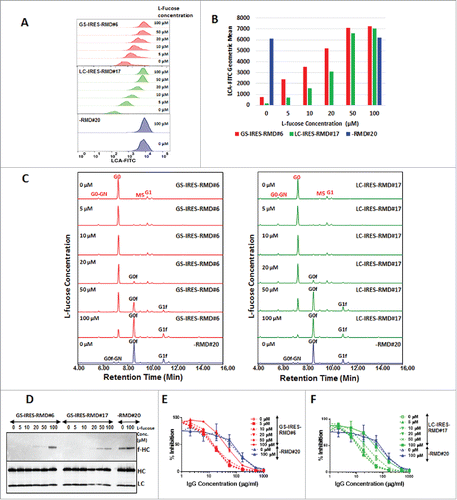
Table 4a. (i). Reversal of afucosylation by addition of fucose in cell culture medium for RMD expressing primary isolate GS-IRES-RMD#6.
Table 4a. (ii). Reversal of afucosylation by addition of fucose in cell culture medium for RMD expressing primary isolate LC-IRES-RMD#17.
Table 4a. (iii). Reversal of afucosylation by addition of fucose in cell culture medium for RMD negative primary isolate -RMD#20.
Table 4b. Difference in EC50 in cell-based potency assay due to reversal of afucosylation by addition of fucose in cell culture medium for RMD expressing mAbA stable cell lines.
Figure 6. Intracellular localization and detection of RMD in secreted mAb. A. Localization of recombinant RMD in primary isolate LC-IRES-RMD#17 by confocal microscopy. B. Targeted detection of RMD peptides using mass spectrometry using multiple reaction monitoring. Three distinct peptides unique to RMD were monitored in whole cell lysates, in supernatants of RMD expressing cells and in purified IgG samples. Each peptide was analyzed in isolation to examine the distribution of ions detected (Library). Library indicates mass spectral library of peptides; y ions represent the fragment ions; area is the sum of y ions. The dotP value represents dot product value, which is the similarity extent between targeted spectrum and the library spectrum in the Skyline software. C. Western blot analysis of cell lysates, cell supernatants and purified IgG from GS-IRES-RMD#6, LC-IRES-RMD#17 and -RMD#20 (upper panel). The bottom panel represents a blot used as a loading control where 10 µg cell lysates and 1 µg cell supernatants and purified IgGs were probed with HRP conjugated HC and LC antibodies.
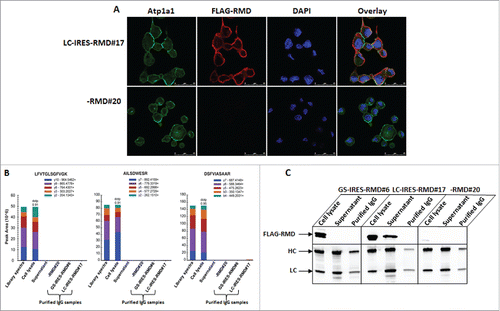
Table 5. List of peptides identified from RMD protein in cell lysates at high confidence peptide level cutoff (1%FDRFootnote1).
