Figures & data
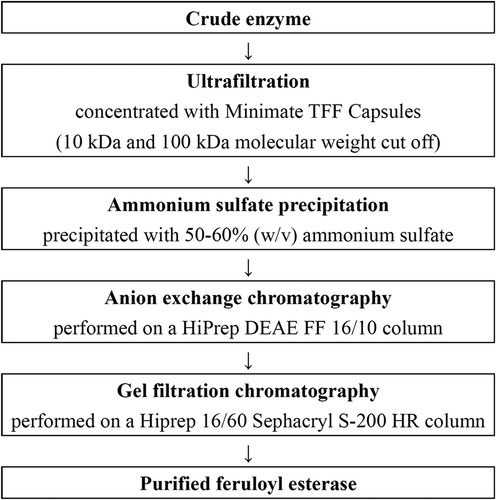
Figure 1. Purification flow chart of feruloyl esterase from P. sumatrense NCH-S2.
Figura 1. Diagrama de flujo de la purificación de la feruloil esterasa de P. sumatrense NCH-S2

Figure 2. The elution profile of (a) anion exchange and (b) gel filtration chromatography of feruloyl esterase from P. sumatrense NCH-S2.
Figura 2. Perfil de elución de (a) intercambio de aniones y (b) cromatografía de filtración en gel de feruloil esterasa de P. sumatrense NCH-S2

Table 1. Purification of feruloyl esterase from P. sumatrense NCH-S2.
Tabla 1. Purificación de feruloil esterasa a partir de P. sumatrense NCH-S2
Figure 3. (a) SDS-PAGE and (b) determination of molecular mass of feruloyl esterase (FAE) from P. sumatrense NCH-S2. M: standard protein markers; lane 1: proteins of 50–60% ammonium sulfate saturation; lane 2: proteins of anion exchange chromatography; lane 3: protein of gel filtration chromatography.
Figura 3. (a) SDS-PAGE y (b) determinación de la masa molecular de la feruloil esterasa (FAE) a partir de P. sumatrense NCH-S2. M: marcadores de proteína estándar; carril 1: proteínas de saturación de 50–60% de sulfato de amonio; carril 2: proteínas de cromatografía de intercambio aniónico; carril 3: proteína de cromatografía de filtración en gel

Figure 4. Determination of molecular mass of the purified feruloyl esterase (FAE) from P. sumatrense NCH-S2 by gel filtration chromatography.
Figura 4. Determinación de la masa molecular de la feruloil esterasa purificada (FAE) a partir de P. sumatrense NCH-S2 por cromatografía de filtración en gel

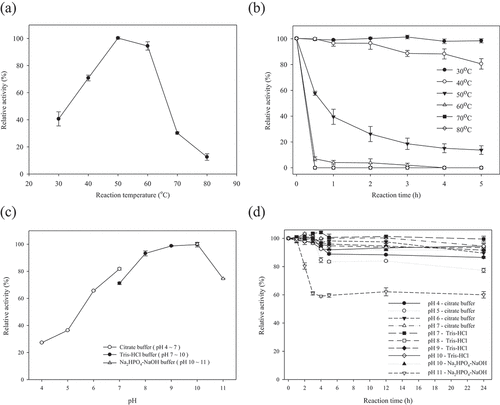
Figure 5. (a) Optimum temperature, (b) thermal stability, (c) optimum pH and (d) pH stability of the purified feruloyl esterase from P. sumatrense NCH-S2. Mean values and standard deviations from three replicate experiments are presented.
Figura 5. a) Temperatura óptima, b) estabilidad térmica, c) pH óptimo y d) estabilidad del pH de la feruloil esterasa purificada de P. sumatrense NCH-S2. Se presentan los valores medios y las desviaciones estándar de tres experimentos replicados

Table 2. Substrate specificity of feruloyl esterase from P. sumatrense NCH-S2.
Tabla 2. Especificidad del sustrato de la feruloil esterasa de P. sumatrense NCH-S2
Figure 6. Antioxidant activity and total polyphenol content of defatted rice bran treated with purified feruloyl esterase. Control of each experiment was performed by replacing the purified feruloyl esterase with distilled water. Mean values and standard deviations from three replicate experiments are presented. Bars with different letters (a-b) are significantly different (p < 0.05).
Figura 6. Actividad antioxidante y contenido total de polifenoles del salvado de arroz desgrasado tratado con feruloil esterasa purificada. El control de cada experimento se realizó sustituyendo la feruloil esterasa purificada por agua destilada. Se presentan los valores medios y las desviaciones estándar de tres experimentos replicados. Las barras con letras distintas (a-b) son significativamente diferentes (p < 0.05)

Table 3. Variation in the amount of ferulic acid and saccharides released from defatted rice bran by enzymatic hydrolysis with different enzyme addition sequences.
Tabla 3. Variación de la cantidad de ácido ferúlico y sacáridos liberados del salvado de arroz desgrasado por hidrólisis enzimática con diferentes secuencias de adición de enzimas

