Figures & data
Figure 1 Continued.
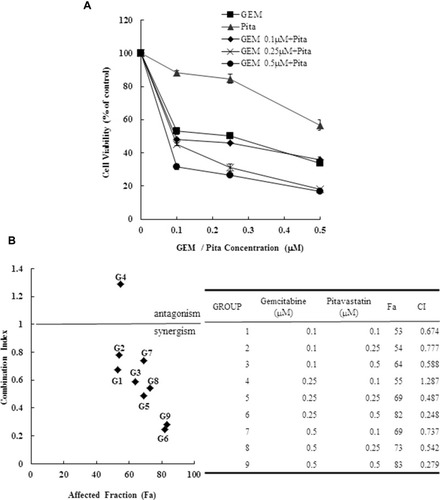
Figure 1 Cytotoxicity of combination GEM and Pita chemotherapy. (A) MIA PaCa-2 cells were cultured with increasing doses of GEM and Pita (0.1–0.5 μM) alone or in combination for 48 h. Then, the percentage of surviving cells in relation to the control was determined using CCK-8. Significant dose-dependent cell death was induced by GEM and Pita monotreatment. The combination of GEM + Pita showed enhanced additive cytotoxic effects for MIA PaCa-2 cells. (B) The CIs of GEM in combination with Pita were calculated using Chou–Talalay analyses; CI of < 1 indicates synergy, CI of >1 indicates antagonism, and an average CI of 1 is additive. Treatment with 0.25 μM GEM and 0.1 μM Pita resulted in antagonistic effects, whereas other combinations of varying drug concentrations had synergistic effects; 0.5 μM Pita combined with 0.25 μM or 0.5 μM GEM therapy had strong synergistic effects and at higher affected fractions of MIA PaCa-2 cells. (C) Cell migration analysis showing reduced MIA PaCa-2 cell migration capability treated with 0.25 μM or 0.5 μM GEM, 0.5 μM Pita, or their combination for 48 h compared with the untreated control group. Magnification 100×, bar = 100 μm. (D) Representative Western blot for hENT1, hCNT3, PCNA, dCK and RRM2 showing the expression of GEM uptake, cell proliferation and GEM resistance-related proteins in the MIA PaCa-2 cells treated with different doses of GEM and Pita for 48 h. GAPDH served as a loading control. (E) Significantly increased hENT1, hCNT3, dCK protein expressions and decreased PCNA, RRM2 protein expressions were detected in the GEM–Pita combination treatment compared with other groups. The density for the control group was set at 1; Values are means ± SD from three replicates. §, *, † and δ represent significant difference p-values, P ˂ 0.05, compared to the only CON, G0.25- or G0.5- or P0.5-treated group.
Abbreviations: GEM, gemcitabine; Pita, pitavastatin; CCK-8, cell counting kit-8; CIs, combination indices; hENT1, human equilibrative nucleoside transporter 1; hCNT3, human concentrative nucleoside transporter 3; PCNA, proliferating cell nuclear antigen; dCK, deoxycytidine kinase; RRM2, ribonucleotide reductase subunit M2.
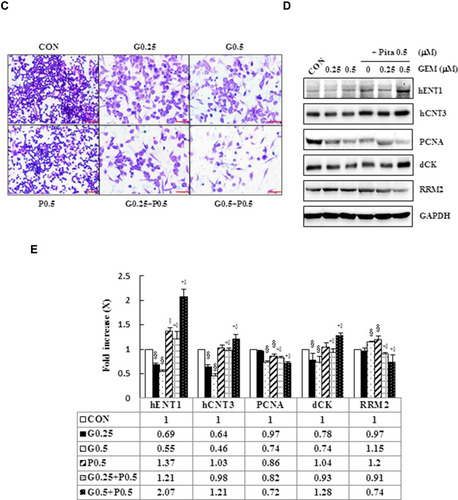
Figure 2 Antiproliferative effects of GEM combined with Pita in MIA PaCa-2 cells are mediated through cell cycle arrest. MIA PaCa-2 cells were treated with the indicated concentrations of GEM, Pita, or their combination for 48 h. Cell cycle progression was analyzed using flow cytometry and PI staining. (A) Histograms show sub-G1 and S phase cell percentages after various treatments. (B–C) Quantitative data of the sub-G1and S phase cell percentages are presented as mean ± SD from three replicates. GEM and Pita treatment led to the arrest of cells in the sub-G1 phase, with a consecutive increase in the percentage of MIA PaCa-2 cells in the S phase. Considerably higher amounts of sub-G1and S phase cells were observed in the combination treatment group. §, *, † and δ represent significant difference p-values, P ˂ 0.05, compared to the only CON or G0.25- or G0.5- or P0.5-treated group.
Abbreviations: GEM, gemcitabine; Pita, pitavastatin; PI, propidium iodide.
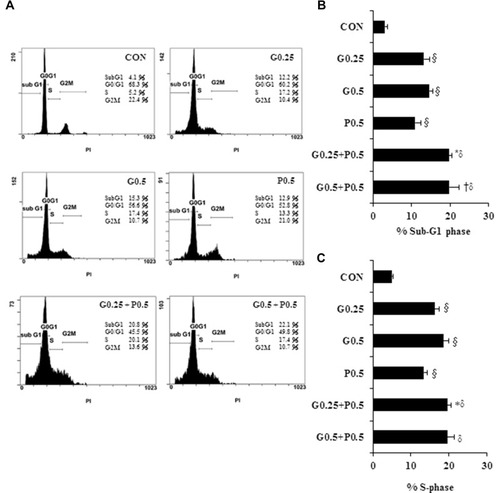
Figure 3 Induction of apoptosis by GEM and Pita but Pita only induces necrosis. Apoptosis and necrosis of MIA PaCa-2 cells in response to GEM, Pita, or their combination for 48 h was determined through annexin V/PI staining. (A) GEM and Pita treatment caused the significant upregulation of late apoptotic/necrotic proportions in MIA PaCa-2 cells (annexin V+/PI+ cells). The combination of GEM and Pita was more effective in inducing late apoptosis/necrosis than was monotherapy. (B) The percentage of cells in different phases was determined from at least three independent experiments. (C) The total cell death rate was defined by the sum of late apoptotic/necrotic and early apoptotic (annexin V+/PI− cells) cell numbers. Similarly, the total cell death percentage was also significantly increased after GEM and Pita combination treatment; mean ± SD from three replicates; §, *, † and δ represent significant difference p-values, P ˂ 0.05, compared to the only CON, G0.25- or G0.5- or P0.5-treated group.
Abbreviations: GEM, gemcitabine; Pita, pitavastatin; PI, propidium iodide.
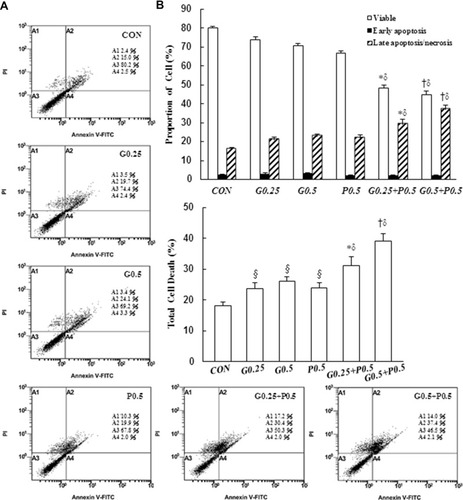
Figure 4 Continued.
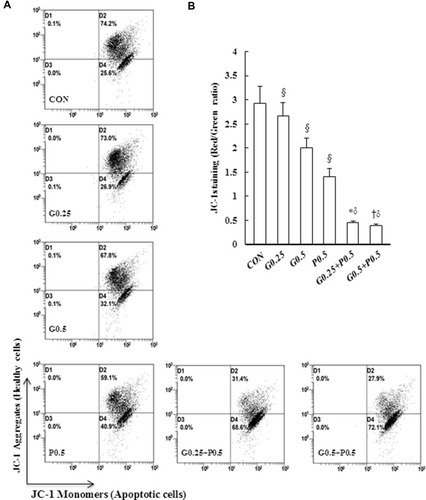
Figure 4 GEM and Pita induce low ∆ѱm and high OXPHOS expression. (A) MIA PaCa-2 cells were treated with the indicated concentrations of GEM and Pita for 48 h and were stained with JC-1. The mean JC-1 fluorescence intensity was detected using fluorescence- activated cell sorting analysis. (B) Graph showing significant reduction of mitochondrial membrane integrity in cells treated with GEM, Pita, or GEM + Pita. (C) Percentage of the OXPHOS complex (I–V) band intensities is presented in the graph. OXPHOS complex subunits were detected through Western blotting with appropriate antibodies. Significantly increased expression levels of electron chain complex I–V proteins were observed in the GEM with Pita combination group than in the GEM and Pita monotreatment groups. (D) Columns represent average values of at least three independent experiments. The density for the control group was set at 1; GAPDH was used as a loading control. Values are means ± SD from three replicates. §, *, † and δ represent significant difference p-values, P ˂ 0.05, compared to the only CON, G0.25- or G0.5- or P0.5-treated group.
Abbreviations: GEM, gemcitabine; Pita, pitavastatin; ∆ѱm, mitochondrial transmembrane potential; OXPHOS, oxidative phosphorylation.
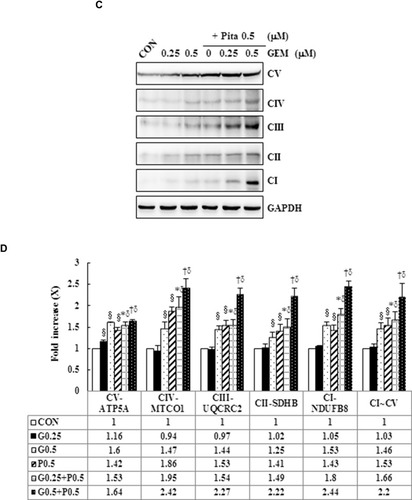
Figure 5 GEM and Pita induce apoptosis through the mitochondrial- and caspase- mediated pathways. (A) Representative Western blot data showing the expression of apoptosis-related proteins in the MIA PaCa-2 cells treated with different doses of GEM and Pita for 48 h. GAPDH served as a loading control. (B) Densitometric analysis of the Western blot obtained in three independent experiments. Significantly decreased antiapoptotic Bcl-2 protein expression and increased proapoptotic Bax, Nix, cytochrome (C) cleaved caspase-3 and −9, and cleaved RARP-1 protein expression were detected in the GEM–Pita combination treatment compared with other groups. The density for the control group was set at 1; Values are means ± SD from three replicates. §, *, † and δ represent significant difference p-values, P ˂ 0.05, compared to the only CON, G0.25- or G0.5- or P0.5-treated group.
Abbreviations: GEM, gemcitabine; Pita, pitavastatin; Bcl-2, B-cell lymphoma 2; Bax, BCL2 associated X; RARP-1, poly (ADP-ribose) polymerase 1.
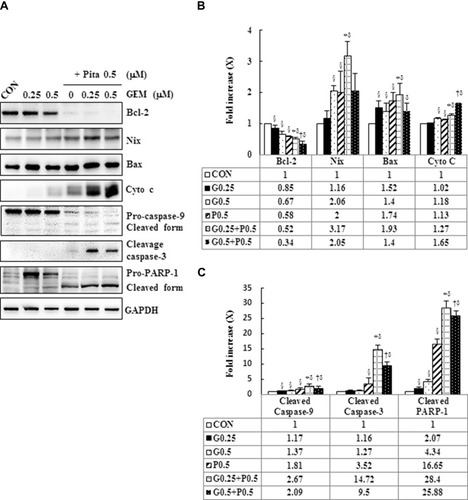
Figure 6 GEM and Pita modulate S phase cell cycle-regulated proteins and RIP1-RIP3- MLKL-dependent pathway in MIA PaCa-2 cells. (A) MIA PaCa-2 cells were treated with different doses of GEM and Pita for 48 h. The expression of S phase cell cycle-regulated proteins and necrosis-regulated proteins was measured using Western blot analysis. GAPDH served as loading control. (B–C) The bands were quantitatively analyzed using Fusion-Capt Advanced FX7 software, and all data are presented as mean ± SD from three replicates. The strongest reduction and addition were observed in cyclin A2/CDK2 and KIP1-p27/WAF-p21 in MIA PaCa-2 cells after treatment with GEM combined with Pita, although no significant differences were observed in p27/p21 expression in post hoc tests after GEM and Pit monotreatment compared with the vehicle control. Similarly, the expression of the necrosis-related protein RIP1-RIP3- MLKL also increased considerably after GEM–Pita treatment compared with other treatments. Surprisingly, the expression of autophagy-related proteins P62 and LC3II in the Pita monotherapy and GEM–Pita combination groups was significantly diminished and elevated, respectively, whereas no significant differences were found in the GEM monotherapy groups compared with the vehicle control. The density for the control group was set at 1; §, *, † and δ represent significant difference p-values, P ˂ 0.05, compared to the only CON, G0.25- or G0.5- or P0.5-treated group.
Abbreviations: GEM, gemcitabine; Pita, pitavastatin; RIP1, receptor-interacting serine-threonine kinase 1; RIP3, receptor-interacting serine-threonine kinase 3; MLKL, mixed lineage kinase domain-like; CDK2, cyclin-dependent kinase 2; P62, sequestosome 1; LC3, light chain 3.
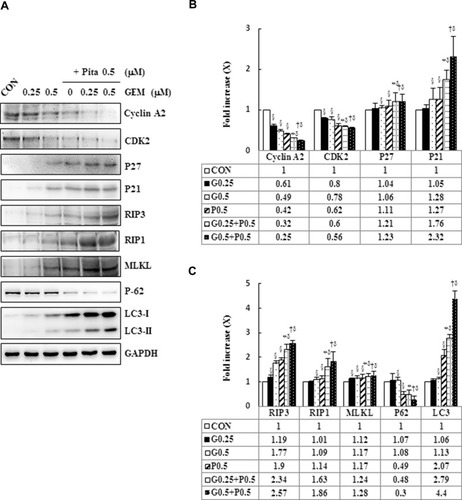
Figure 7 Continued.
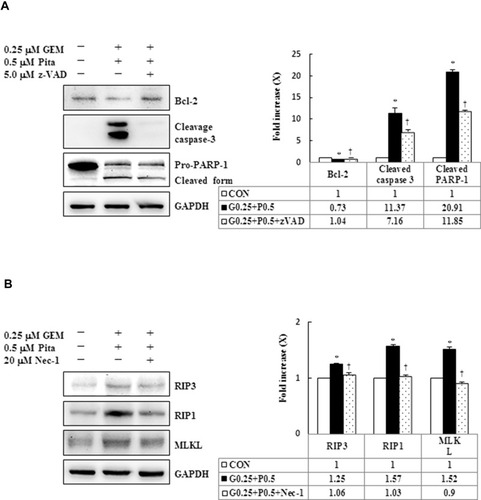
Figure 7 Influence of z-VAD-fmk, Nec-1, and BafA1 on apoptotic, necrotic, and autophagy signaling proteins, respectively. MIA PaCa-2 cells were pretreated with 5 μM z-VAD-fmk, 20 μM Nec-1, or 2 nM BafA1 for 2 h and were then treated with 0.25 μM GEM + 0.5 μM Pita for 48 h. (A–C) Cell lysates were analyzed using Western blot with the indicated antibodies. Quantitative data are presented as mean ± SD from three replicates. (A) Expression levels of the antiapoptotic marker Bcl-2 were reduced by GEM combined with Pita but were elevated by z-VAD-fmk. Meanwhile, the apoptotic markers of cleaved caspase-3 and cleaved PARP-1 were also suppressed by z-VAD-fmk. (B) Expression levels of the necrotic markers RIP3, RIP1, and MLKL were elevated by GEM combined with Pita but were suppressed by Nec-1. (C) Expression level of the autophagy marker LC3-II was elevated by GEM combined with Pita but was suppressed by BafA1. (D) MIA PaCa-2 cell viability was determined using CCK-8. Cells with GEM combined with Pita treatment exhibited significantly decreased cell viability. When pretreated with z-VAD-fmk, Nec-1, or BafA1, the cells exhibited increased cell viability. The density for the control group was set at 1; * and † represent significant difference p-values, P ˂ 0.05, compared to the untreated or G0.25+P0.5-treated group; mean ± SD from three replicates.
Abbreviations: z-VAD-fmk, Z-Val-Ala-Asp-fluoromethylketone; Nec-1, necrostatin-1; Baf-A1, bafilomycin A1; GEM, gemcitabine; Pita, pitavastatin; Bcl-2, B-cell lymphoma 2; RARP-1, poly (ADP-ribose) polymerase 1; RIP1, receptor-interacting serine-threonine kinase 1; RIP3, receptor-interacting serine-threonine kinase 3; MLKL, mixed lineage kinase domain-like; LC3, light chain 3. CCK-8, cell counting kit-8.
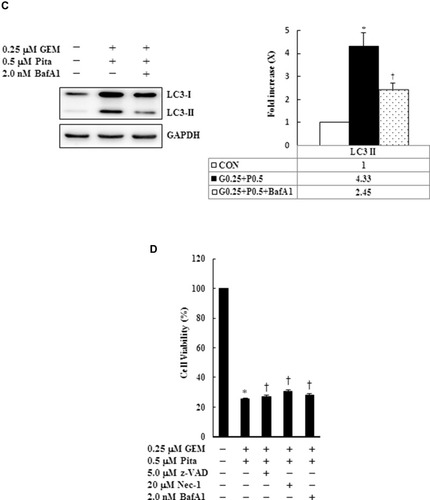
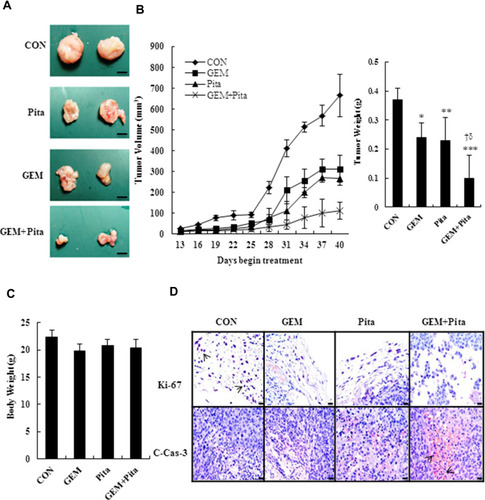
Figure 8 GEM and Pita act synergistically against a xenograft tumor model of pancreatic cancer in vivo. Nude mice were used to construct a xenograft tumor model with MIA PaCa-2 cells. (A) Xenograft tumors of four groups, bar = 0.5 mm. (B) Tumor volume and weight. (C) Mouse body weight at the end of treatment. n = 5 mice for each group. (D) Immunohistochemistry stained with cell proliferation marker Ki-67 (nucleus, arrows) and the apoptosis marker cleaved caspase-3 (c-cas-3, cytoplasm, arrows), magnification 400x, bar = 20 μm.*P=0.003, **P= 0.028, ***P=0.001 compared with the untreated group. † and δ represent to compare with the GEM or Pita group, P ˂ 0.05, respectively.
Abbreviations: GEM, gemcitabine; Pita, pitavastatin.