
Figures & data
Point your SmartPhone at the code above. If you have a QR code reader the video abstract will appear. Or use:

Figure 1 Illustration of the CTOIDD system model (A); the tube section was fixed on the conjunctiva of a rabbit eye (B, C); the pump section was connected with the tube and delivered the norvancomycin to the ocular surface. Rabbits were kept in individual cages with food and water provided during drug administration (D).
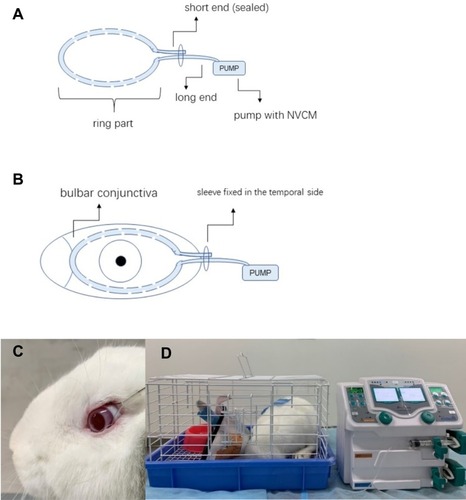
Figure 2 Structural formula of (A) norvancomycin; (B) vancomycin.
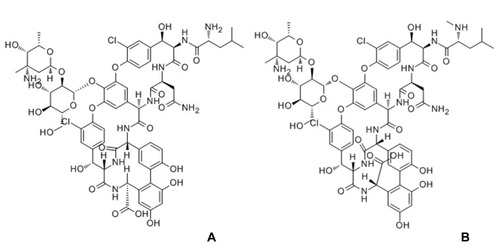
Figure 3 Chromatograph of blank plasma in the HPLC-PDA method (A); chromatograph of blank plasma spiked with norvancomycin and vancomycin (B).
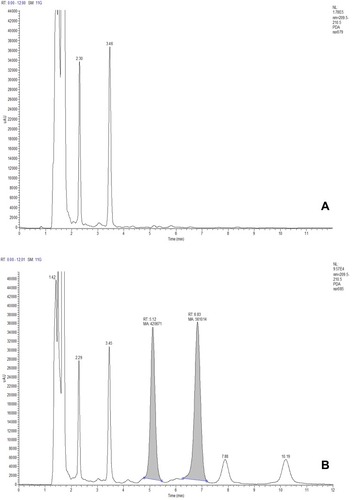
Table 1 Mean Recovery Rates of Norvancomycin and Vancomycin in Plasma
Table 2 Intra-Day Precision and Inter-Day Precision
Table 3 Stability of Long-Term Storage
Table 4 Norvancomycin Concentrations in the Anterior Segment Tissue and Blood Plasma in OTCIDD and Eye Drop Groups
Figure 4 Concentration–time curve of norvancomycin concentration in conjunctiva (A), cornea (B), iris (C), ciliary body (D), aqueous humour (E), and blood plasma (F) in the two groups. The aread under the concentration–time curve from 0 to 24 h were compared using the t-test. Values are given as the mean±SD (n=6), **p<0.01.
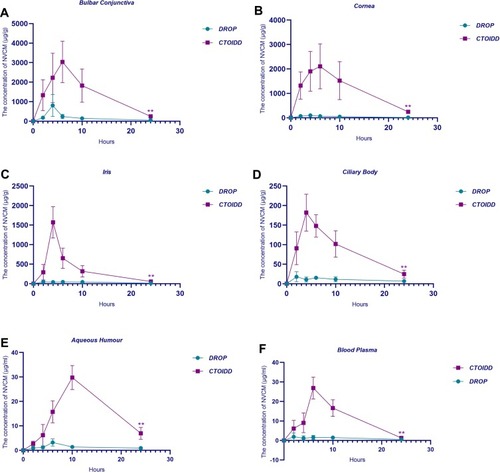
Figure 5 Comparison of the levels of norvancomycin at different time-points between the two groups in conjunctiva (A), cornea (B), iris (C), ciliary body (D), aqueous humour (E), and blood plasma (F). One-way analysis of variance was used to compare the overall difference between the CTOIDD group and eye drop group. Values are given as the mean±SD (n=6), *p<0.05, **p<0.01.
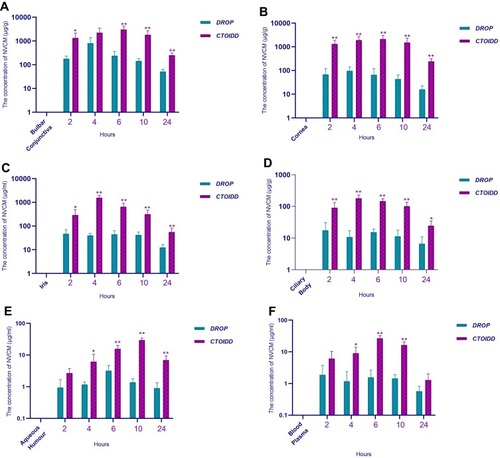
Table 5 Concentration Ratio of Conjunctiva/Cornea, Iris/Cornea, and Plasma/Cornea in OTCIDD and Eye Drop Groups
Figure 6 Norvancomycin concentration–time profiles in different anterior segment tissue and blood plasma in the CTOIDD group (A) and eye drop group (B).
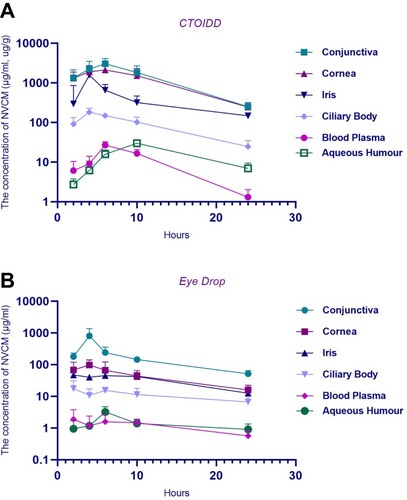
Table 6 Pharmacokinetic Parameters of Norvancomycin in Rabbit’ Anterior Segment Tissue in OTCIDD and Eye Drop Groups