Figures & data
Figure 1 Examples of some approved HDACi.
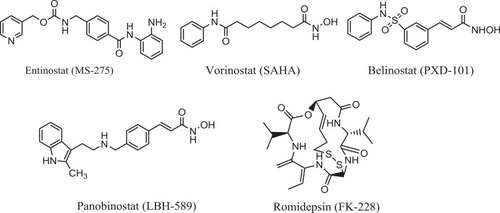
Figure 2 Examples on some microtubule targeting agents with affinity for colchicine-binding site.
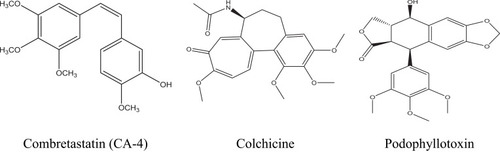
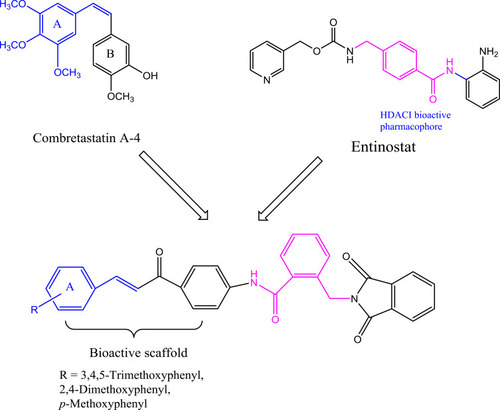
Figure 3 Diagram represents the design strategy of novel HDAC/tubulin inhibitors and the reported anticancer compounds CA-4 and entinostat.
Scheme 1 Synthesis of compounds 6 and 7: Reagents and conditions: (A) Zn dust, NaOH, CuSO4; (B) KOH, Acetone; (C) DMF, reflux 6 hr, HCl; SOCl2, reflux, 4 hr; (D) 4-Aminoacetophenone, CH2Cl2, TEA, 4 hr, rt; (E) Aromatic aldehyde, 20% NaOH, EtOH, 8–20 hr, rt.
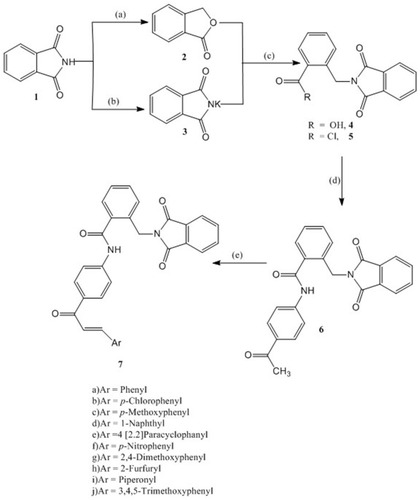
Figure 4 X-ray structural analysis of compound 6. Ellipsoids represent 50% probability levels.
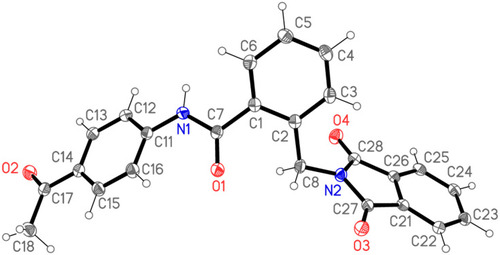
Table 1 IC50 Values for Anticancer Activity of Compounds 6, 7a–7j and CA4 Using MTT Assay Against MCF-7, and HepG2 Cell Lines
Figure 5 (A) IC50 values for anticancer activity of compounds 6, 7a–7j and CA4 using MTT assay against MCF-7 cell line. (B) IC50 values for anticancer activity of compounds 6, 7a–7j and CA-4 using MTT assay against Hep G2 cell line.
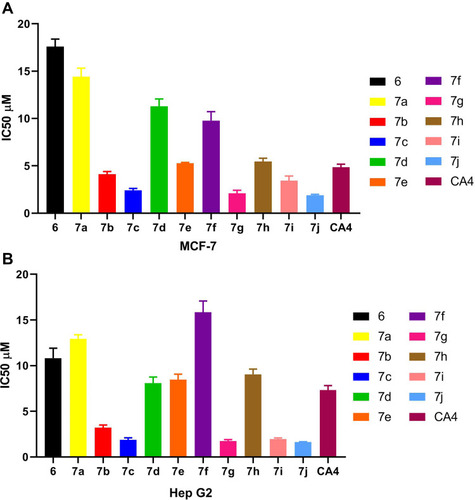
Table 2 IC50 Values for in vitro β-Tubulin Polymerization Inhibitory Activity of 7c, 7g, 7j, and CA-4 Using ELISA Assay
Figure 6 IC50 values for in vitro β-tubulin polymerization inhibitory activity of 7c, 7g, 7j and CA-4 using ELISA assay.
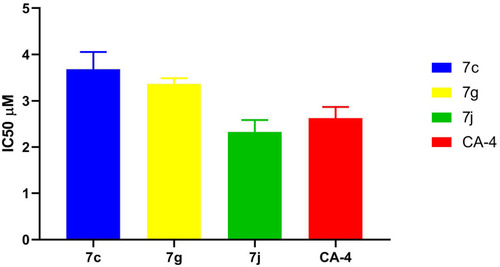
Table 3 IC50 Values for in vitro HDAC1 & 2 Inhibitory Activity of Compounds 7c, 7g, 7j and Entinostat
Figure 7 IC50 values for in vitro HDAC1 and HDAC2 inhibitory activity of compounds 7c, 7g, 7j and entinostat.
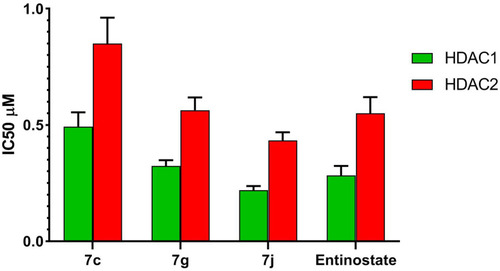
Table 4 Cell Cycle Analysis of Compounds 7j, 7g, CA-4 and Entinostat Against MCF-7 Cell Line
Figure 8 (A) Cell cycle analysis in MCF-7 cell line treated with 7j and 7g hybrids at their IC50 (µM). (B) Cell cycle analysis and apoptosis effect in MCF-7 cell line treated with 7j, 7g, CA-4 and entinostat compounds.
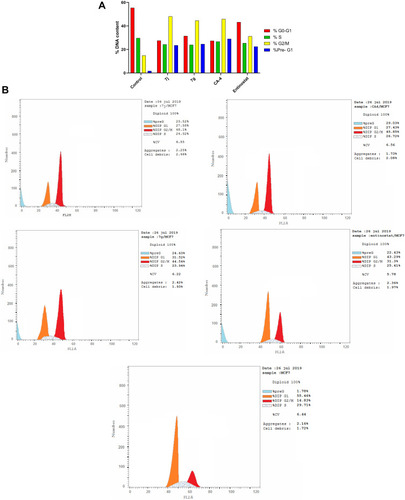
Table 5 Results of Apoptotic Assay of 7j, 7g, CA-4 and Entinostat
Figure 9 Flow cytometric analysis of Annexin V-FITC/PI induced by compounds 7j, 7g, CA-4, entinostat at their IC50 (µM).
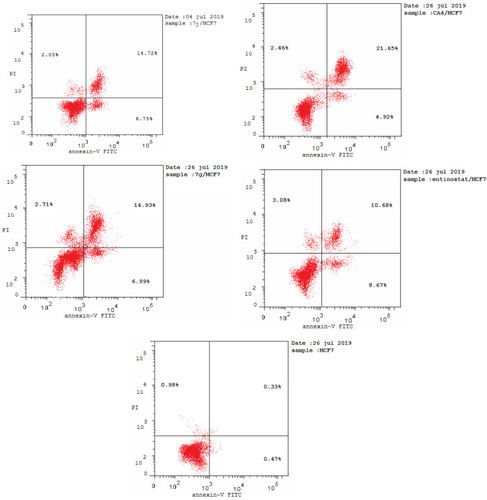
Table 6 Energy Binding Scores (Kcal/mol) for Compounds 7j, 7g, 7c and CA4 with the Colchicine Binding Site
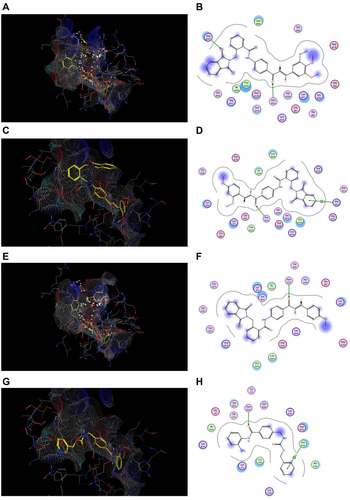
Figure 10 Docking and binding pattern of compounds 7j, 7g, 7c and CA-4 showing interactions with different amino acid residues found in the active site of colchicine binding site in tubulin protein (PDB code: 1SA0). (A) 3D structure of compound 7j (yellow) (B) 2D structure of compound 7j. (C) 3D structure of compound 7g (yellow) (D) 2D structure of compound 7g. (E) 3D structure of compound 7c (yellow) (F) 2D structure of compound 7c. (G) 3D structure of reference compound CA-4 (yellow) (H) 2D structure of reference compound CA-4.
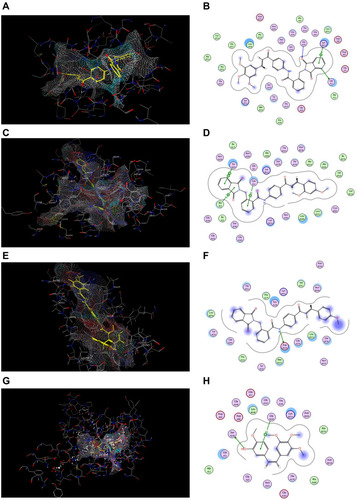
Table 7 Energy Binding Scores (Kcal/mol) for Compounds 7j, 7g, 7c and Entinostat at the Active Site of HDAC2
Figure 11 Docking and binding pattern of compounds 7j, 7g, 7c and CA-4 showing interactions with different amino acid residues found in HDAC2 active site (PDB code: 4LXZ). (A) 3D structure of compound 7j (yellow) (B) 2D structure of compound 7j. (C) 3D structure of compound 7g (yellow) (D) 2D structure of compound 7g. (E) 3D structure of compound 7c (yellow) (F) 2D structure of compound 7c. (G) 3D structure of entinostat reference compound (yellow) (H) 2D structure of entinostat reference compound.