Figures & data
Table 1 Criteria Used to Determine Small Intestine Histology Score
Figure 1 H2 inhalation meliorated the 7-day survival rates in septic mice. The survival rates of mice were monitored for 7 days (n = 20). *P < 0.05 versus Sham group, #P < 0.05 versus Sepsis group.
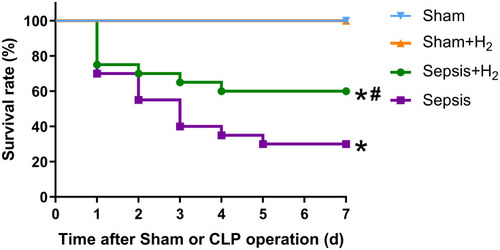
Figure 2 H2 enhanced the clearance of bacterial burden in the blood and peritoneal lavage of septic mice. The blood (A) and peritoneal lavage (B) were harvested at 24 h after Sham or CLP operation. Results were displayed as mean ± SD (n=6). *P < 0.05 versus Sham group, #P < 0.05 versus Sepsis group.
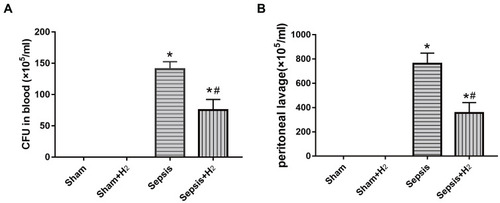
Figure 3 H2 can alleviate intestinal pathological damage caused by sepsis. Intestinal tissues were obtained at 24 h after sham or CLP operation. The structures of intestinal villi were normal in Sham (A) and Sham+H2 (B) group. Intestinal villi were disordered, submucosal and primary blood vessels were congested, and the continuity of intestinal villi was broken in Sepsis (C) group. The small intestine histology change in Sepsis+H2 (D) group were significantly improved compared with Sepsis group. (E) HE histopathological scores for each group. Results were displayed as mean ± SD (n = 6). Scale bar = 100 µm. *P < 0.05 versus Sham group, #P < 0.05 versus Sepsis group.
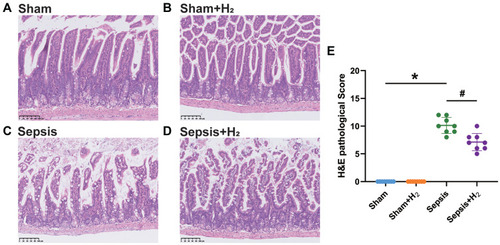
Figure 4 H2 can improve the intestinal tight junction barrier. FITC-dextran permeability was measured at 90 min, 180 min, 360 min, and 720 min after sham or CLP operation. Results were displayed as mean ± SD (n = 6). *P < 0.05 versus Sham group, #P < 0.05 versus Sepsis group.
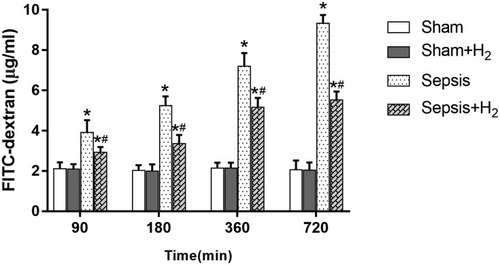
Figure 5 H2 can increase the expressions of Occludin and ZO-1. The intestinal tissues were obtained from mice at 6 h, 12 h, and 24 h after sham or CLP operation. The tight junction protein expressions of Occludin and ZO-1 measured by Western blot (A, D, G). Quantitative analysis of Occludin (B, E, H) and ZO-1 (C, F, I) is shown as the ratio of band density to that of β-actin respectively. Results were displayed as mean ± SD (n = 6). *P < 0.05 versus Sham group, #P < 0.05 versus Sepsis group.
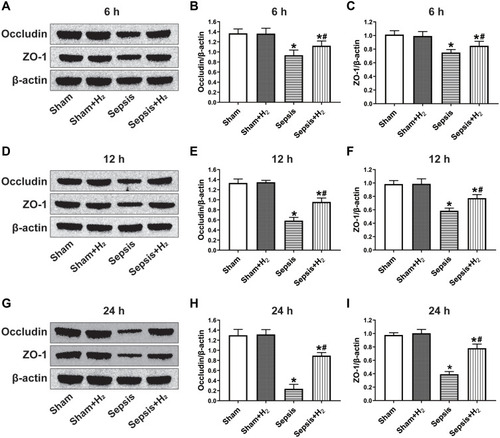
Table 2 List of the Several H2-Related Significantly Differential Proteins According With Condition One
Table 3 List of the Several H2‐Related Significantly Differential Proteins According With Condition Two
Figure 6 Significant enrichment analysis of differentially expressed proteins. We performed GO and KEGG to further understand the functions of 49 H2-related proteins. (A) The top ten significantly enriched molecular function GO terms. (B) The top ten significantly enriched cellular component GO terms. (C) The top ten significantly enriched biological process GO terms. (D) Differential protein enriched KEGG pathway (n = 10).
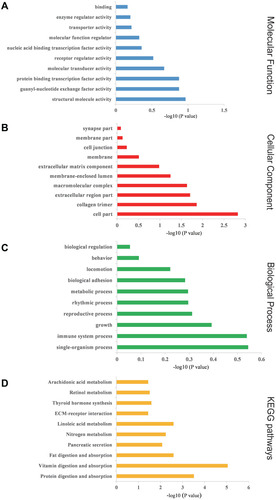
Figure 7 Interconnected protein networks composed of differential proteins.
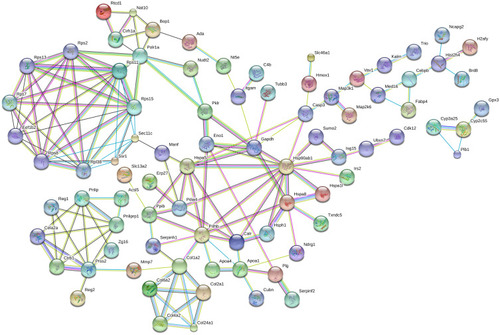
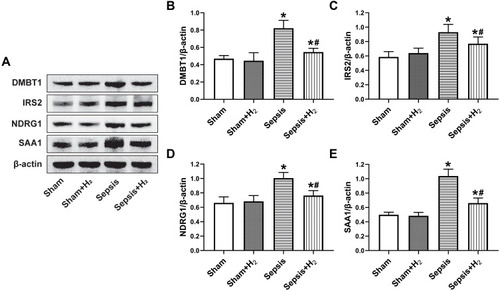
Figure 8 Effects of H2 on the protein expressions of DMBT1, IRS2, NDRG1, and SAA1 in intestinal tissue of septic mice. The intestinal samples were harvested at 24 h after sham or CLP operation. The protein expressions of DMBT1, IRS2, NDRG1, and SAA1 measured by Western blot (A). Quantitative analysis of DMBT1 (B), IRS2 (C), NDRG1 (D), and SAA1 (E) is shown as the ratio of band density to that of β-actin respectively. Results were displayed as mean ± SD (n = 6). *P< 0.05 versus Sham group, #P < 0.05 versus Sepsis group.