
Figures & data
Table 1 Hydrodynamic size, zeta potential, and PDI of SiNPs in distilled water or DMEM as dispersion medium at different time points
Table 2 Trace-metal impurity levels in SiNPs (μg/10 mg SiO2)
Figure 1 Morphology and size distribution of SiNPs.
Notes: (A) TEM image: SiNPs had a near-spherical shape and good monodispersity, with an average diameter of 58 nm. (B) Size distribution measured by ImageJ software showed an almost normal distribution.
Abbreviations: SiNPs, silica nanoparticles; TEM, transmission electron microscopy; Std dev, standard deviation.
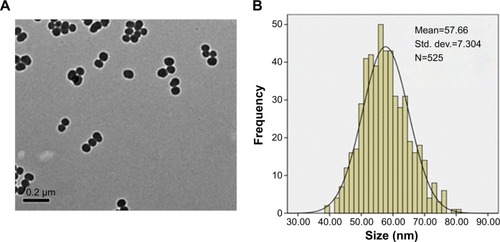
Figure 2 Cytotoxicity of HUVECs induced by SiNPs.
Notes: *P<0.05 versus control. Data presented as means ± SD of three identical experiments made in triplicate. (A) Morphological changes of HUVECs after exposure to SiNPs with various concentrations for 24 hours. Under observation by optical microscopy with 100× magnification, SiNPs induced cellular morphological changes, characterized by cell-density reduction, irregular shape, and cellular shrinkage. (B) Dose- and time-dependent cell-viability decline in HUVECs measured by MTT assay after 24 and 48 hours’ SiNP exposure. (C) Dose-dependent induction of LDH leakage to HUVECs after SiNP exposure for 24 hours. (D) A significant negative correlation between cell viability and membrane damage (LDH leakage) after 24 hours’ exposure to 12.5, 25, 50, and 100 μg/mL of SiNPs. The results indicated that SiNPs induced cytotoxicity in a dose- and time-dependent manner.
Abbreviations: HUVECs, human umbilical vein endothelial cells; SiNPs, silica nanoparticles; SD, standard deviation; MTT, 3-(4,5-dimethylthiazol-2-yl)-2,5-diphenyltetrazolium bromide; LDH, lactate dehydrogenase.
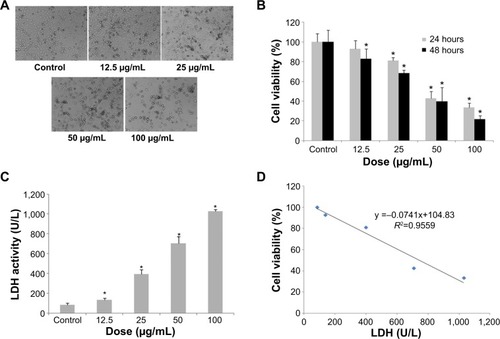
Figure 3 Oxidative stress and damage induced by SiNPs in HUVECs.
Notes: *P< 0.05 versus control. Data expressed as means ± SD from three independent experiments. HUVECs were treated with increasing concentrations of SiNPs for 24 hours, and then the fluorescence intensity of DCF was measured using laser scanning confocal microscopy and flow cytometry. The intracellular levels of ROS were significantly increased in a dose-dependent manner (A, B), and so was the production of MDA (C). SOD activity was increased, while GSH-Px levels decreased significantly in a dose-dependent way (D, E). Meanwhile, the relative mRNA expression of SOD2 and GSH-Px were measured by quantitative real-time PCR. Significant changes in their mRNA expressions were observed, which was consistent with the corresponding change in their activities (F). Additionally, GSH content increased, induced by SiNPs, and the relative mRNA expression of GCLC normalized to β-actin was upregulated, but there was no significant change in that of GCLM (G, H). In figure A the upper images were DCFH-DA staining under confocal microscopy. The lower images were DCFT-DA staining merged with optical morphology at the same visual field.
Abbreviations: HUVECs, human umbilical vein endothelial cells; SiNPs, silica nanoparticles; SD, standard deviation; DCF, dichlorofluorescein; ROS, reactive oxygen species; MDA, malondialdehyde; GSH-Px, glutathione peroxidase; PCR, polymerase chain reaction; mRNA, messenger ribonucleic acid; DA, diacetate; SOD, superoxide dismutase; GCLC, glutamate cysteine ligase – catalytic; GCLM, glutamate cysteine ligase – modifier.
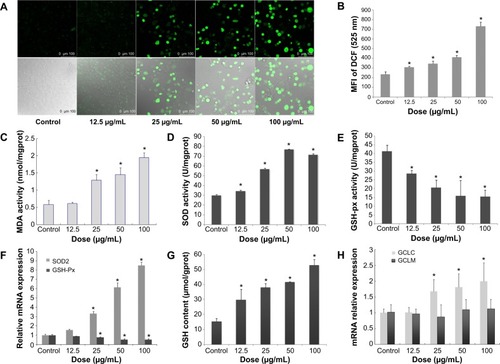
Figure 4 NO/NOS systemic disorder and downregulated ET-1 mRNA expression mediated by SiNP exposure in HUVECs.
Notes: *P<0.05 versus control. Data presented as means ± SD, n=3. (A) Release of NO after SiNP exposure for 24 hours in HUVECs. (B) Real-time PCR assessment of mRNA levels for eNOS, iNOS, and ET-1 normalized to β-actin in HUVECs after 24 hours’ SiNP treatment.
Abbreviations: eNOS, endothelial nitric oxide synthase; iNOS, inducible NOS; SiNP, silica nanoparticle; HUVECs, human umbilical vein endothelial cells; SD, standard deviation; ET-1, endostatin 1; PCR, polymerase chain reaction; mRNA, messenger ribonucleic acid.
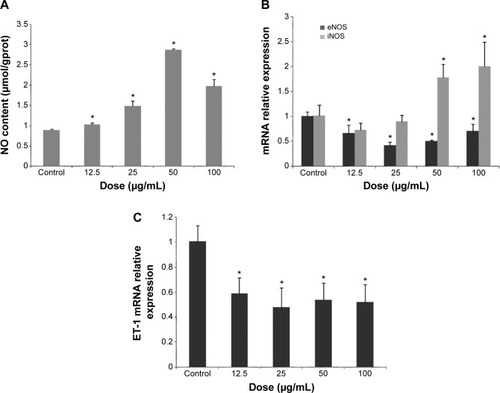
Figure 5 Inflammatory response induced by SiNPs in HUVECs.
Notes: *P<0.05 versus control. Data presented as means ± SD, n=3. After exposure of HUVECs for 24 hours, SiNPs upregulated the endothelial gene expressions of inflammatory cytokines, including IL-1β, IL-6, IL-8, and TNFα, and adhesion molecules, such as ICAM-1, VCAM-1, and MCP-1, as recorded by quantitative real-time PCR.
Abbreviations: SiNPs, silica nanoparticles; HUVECs, human umbilical vein endothelial cells; SD, standard deviation; PCR, polymerase chain reaction; mRNA, messenger ribonucleic acid.
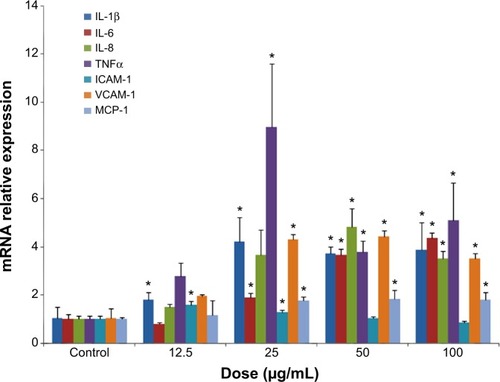
Figure 6 Redox-mediated Nrf2, NF-κB, and MAPK signaling pathway involved in SiNP cytotoxicity in HUVECs.
Notes: The mRNA expression of Nrf2 and its key downstream genes, including HMOX1, CAT, TXN1, TXNRD1, and NQO1, was measured through quantitative real-time PCR (A), and the protein levels of Nrf2, HO-1, NF-κB, ERK, JNK, p38 MAPK, and corresponding phosphorylated forms were measured through Western blot analysis (B). *P<0.05 vs control. Data presented as means ± SD, n=3.
Abbreviations: NF, nuclear factor; SiNP, silica nanoparticle; HUVECs, human umbilical vein endothelial cells; mRNA, messenger ribonucleic acid; PCR, polymerase chain reaction; HO, heme oxygenase; GAPDH, glyceraldehyde 3-phosphate dehydrogenase; SD, standard deviation.
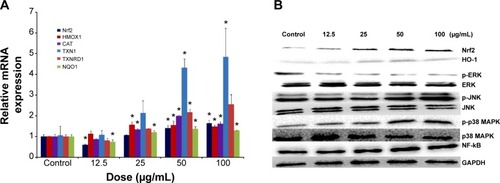
Table S1 Real-time PCR primer pairs