698
Views
13
CrossRef citations to date
0
Altmetric
Research Article

1,2,4-thiadiazol-5(4H)-ones: a new class of selective inhibitors of Trypanosoma cruzi triosephosphate isomerase. Study of the mechanism of inhibition

, , , , , , , , , & show all
Pages 981-989 | Received 29 Apr 2012, Accepted 05 Jun 2012, Published online: 18 Jul 2012

Figures & data

Figure 1.  Chemical structure of 1,2,4-thiadiazol derivatives and the previously studiedCitation12 1,3,4-oxathiazol. Derivatives 1 and 2 were also analyzed against HsTIM showing at least 10-fold selectivity for TcTIM.

Figure 1.  Chemical structure of 1,2,4-thiadiazol derivatives and the previously studiedCitation12 1,3,4-oxathiazol. Derivatives 1 and 2 were also analyzed against HsTIM showing at least 10-fold selectivity for TcTIM.

Table 1.  Classic inhibition assay of Tc, Hs, Lm and Tb TIMs to evaluate the selectivity of the inhibitor compounds.

Figure 2.  Effect of compounds 1 on the activity of TcTIM. (a) Lineweaver–Burk plot of TcTIM alone and TcTIM+compound 1 (3.5 µM). (b) TcTIM activity dependence on compound 1 concentration.
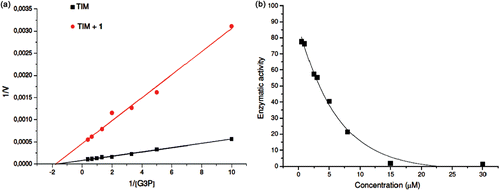
Figure 2.  Effect of compounds 1 on the activity of TcTIM. (a) Lineweaver–Burk plot of TcTIM alone and TcTIM+compound 1 (3.5 µM). (b) TcTIM activity dependence on compound 1 concentration.

Figure 3.  Effect of compound 1 on TcTIM stability. (a) Effect of compound 1 on TcTIM stability. The enzyme was incubated at the indicated concentrations for 2 h at 37°C with (▪) and without (•;) 3.5 µM compound 1 and the activity of each of the samples was measured. (b) Effect of compound 1 on the formation of active TcTIM from GdnHCl unfolded monomers. The experiment was performed as described in the Methods section. Activity was measured 15 () and 60 (▪) min after the denaturing mixture was diluted one hundred fold.

Figure 3.  Effect of compound 1 on TcTIM stability. (a) Effect of compound 1 on TcTIM stability. The enzyme was incubated at the indicated concentrations for 2 h at 37°C with (▪) and without (•;) 3.5 µM compound 1 and the activity of each of the samples was measured. (b) Effect of compound 1 on the formation of active TcTIM from GdnHCl unfolded monomers. The experiment was performed as described in the Methods section. Activity was measured 15 (•) and 60 (▪) min after the denaturing mixture was diluted one hundred fold.
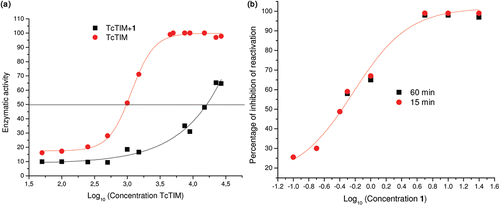
Figure 4.  Calculated electronic distribution for compounds 1–4. (a) Potential electrostatic molecular maps. The solid arrow shows the reaction centre (sulfur 1, S1) and the dotted arrow points the protonated centre (nitrogen 2, N2). (b) HOMO maps (red-blue) superimposed to electron density bond maps (silver). The solid arrows show the contribution of S1 and N2 to the HOMO only in derivative 1. The S1-N2 bond lengths for each compound are also shown.
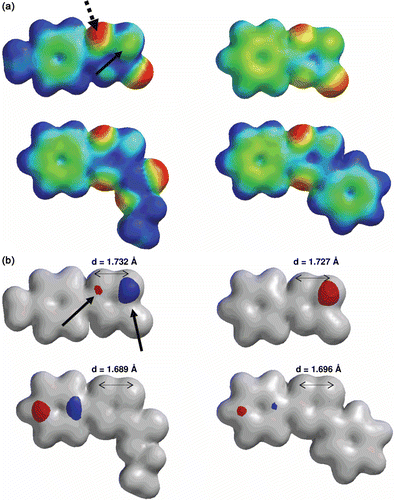
Figure 4.  Calculated electronic distribution for compounds 1–4. (a) Potential electrostatic molecular maps. The solid arrow shows the reaction centre (sulfur 1, S1) and the dotted arrow points the protonated centre (nitrogen 2, N2). (b) HOMO maps (red-blue) superimposed to electron density bond maps (silver). The solid arrows show the contribution of S1 and N2 to the HOMO only in derivative 1. The S1-N2 bond lengths for each compound are also shown.

Figure 5.  Structural similarities of the analyzed compounds (1–4).

Figure 5.  Structural similarities of the analyzed compounds (1–4).

Table 2.  Classic inhibition assay, using modified TcTIMs, to evaluate the selectivity of the inhibitor 1.

Figure 6.  Stereoview of TcTIM showing the regions of TbTIM (in red) that were grafted in TcTIM to generate the chimera studied herein.
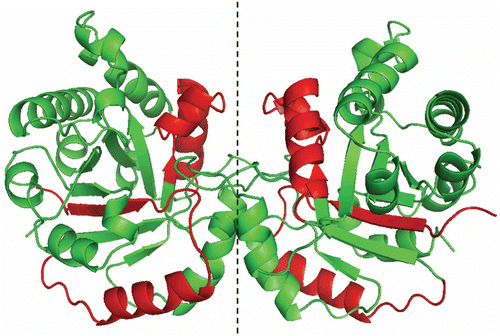
Figure 6.  Stereoview of TcTIM showing the regions of TbTIM (in red) that were grafted in TcTIM to generate the chimera studied herein.

Figure 7.  T. cruzi growth inhibition assays. (a) Dose-response curves showing growth inhibition of T. cruzi by compound 1 incorporated into phospholipid (PL). (b) Dose-response curves showing growth inhibition of T. cruzi by compound 1 incorporated into PL and the reference drugs, Nifurtimox (Nfx) and Benznidazole (Bnz).
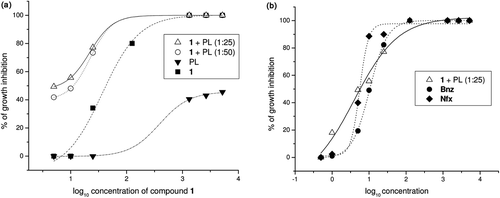
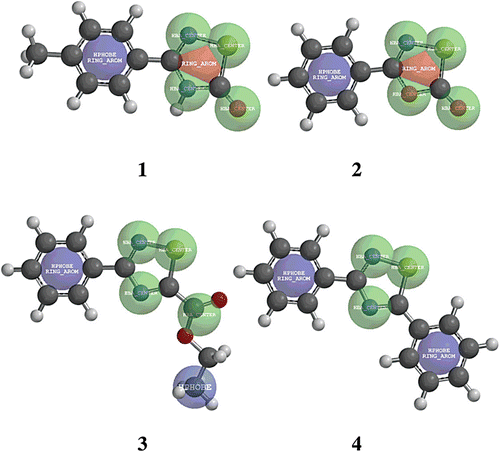
Figure 7.  T. cruzi growth inhibition assays. (a) Dose-response curves showing growth inhibition of T. cruzi by compound 1 incorporated into phospholipid (PL). (b) Dose-response curves showing growth inhibition of T. cruzi by compound 1 incorporated into PL and the reference drugs, Nifurtimox (Nfx) and Benznidazole (Bnz).

Reprints and Corporate Permissions

Please note: Selecting permissions does not provide access to the full text of the article, please see our help page How do I view content?

To request a reprint or corporate permissions for this article, please click on the relevant link below:

Academic Permissions

Please note: Selecting permissions does not provide access to the full text of the article, please see our help page How do I view content?

Obtain permissions instantly via Rightslink by clicking on the button below:

If you are unable to obtain permissions via Rightslink, please complete and submit this Permissions form. For more information, please visit our Permissions help page.