Abstract
Chagas' disease is a parasitic infection widely distributed throughout Latin America, with devastating consequences in terms of human morbidity and mortality. Cruzain, the major cysteine protease from Trypanosoma cruzi, is an attractive target for antitrypanosomal chemotherapy. In the present work, classical two-dimensional quantitative structure-activity relationships (2D QSAR) and hologram QSAR (HQSAR) studies were performed on a training set of 45 thiosemicarbazone and semicarbazone derivatives as inhibitors of T. cruzi cruzain. Significant statistical models (HQSAR, q2 = 0.75 and r2 = 0.96; classical QSAR, q2 = 0.72 and r2 = 0.83) were obtained, indicating their consistency for untested compounds. The models were then used to evaluate an external test set containing 10 compounds which were not included in the training set, and the predicted values were in good agreement with the experimental results (HQSAR, ![]() = 0.95; classical QSAR,
= 0.95; classical QSAR, ![]() = 0.91), indicating the existence of complementary between the two ligand-based drug design techniques.
= 0.91), indicating the existence of complementary between the two ligand-based drug design techniques.
Introduction
Enzymes are extremely attractive targets for small-molecule drug intervention in human diseases [Citation1–4]. The ability to efficiently design or discover novel, patentable new chemical entities which are potent and specific inhibitors of enzymes is, therefore, of great importance [Citation5,6]. Chagas' disease or American trypanosomiasis is a major cause of morbidity and mortality in Latin America, where about 16-18 million people are infected with Trypanosoma cruzi [Citation7]. The two nitroheterocyclic drugs (nifurtimox and benznidazole) available for the treatment of this parasitic disease have severe limitations, including poor efficacy, high toxicity, and long courses of parenteral administration. Therefore, there is an urgent need for new drugs for chemotherapy of the disease [Citation8–10]. This has led to a new paradigm for the discovery of drug candidates that act on specific enzymes or metabolic pathways. Cysteine proteases are essential components for the survival of several parasitic protozoa. Cruzain, the major cysteine protease of the protozoan parasite T. cruzi, has been identified as an attractive target for the development of a new generation of antitrypanosomal agents [Citation11,12].
Structure- and ligand-based drug design techniques are vital components of modern drug discovery. Success in this endeavor has been driven by scientific and technological innovation that enabled the discovery of new therapeutic agents [Citation13,14]. Computational techniques have provided valuable information for the design of enzyme inhibitors with a wide variety of pharmacological properties, however, designing compounds that are effective against a single target is a difficult task [Citation15]. The understanding of the chemical basis involved in the complex process of molecular recognition and biological activity, remains a major challenge. One of the key strategies in inhibitor drug design is the development of quantitative structure-activity relationships (QSAR) from a correct interpretation of the mutual binding-mode and mechanism of action within series of structurally related inhibitors. In the present study, hologram QSAR (HQSAR) and classical QSAR methods have been employed to explore both the molecular basis underlying the selective modulation of T. cruzi cruzain, and to investigate the QSAR of a series of chemically versatile thiosemicarbazone and semicarbazone derivatives as selective inhibitors of this trypanosomal cysteine protease.
Materials and methods
Data sets
The data set used for the QSAR studies contains 55 thiosemicarbazone and semicarbazone derivatives as inhibitors of the trypanosomal cysteine protease cruzain, which have been selected from the literature [Citation16]. The structures and corresponding IC50 values for the whole set of inhibitors are included in . The IC50 (concentration required for 50% inhibition of cruzain) values were converted to pIC50 ( − log IC50) values and used as dependent variables in the QSAR analyses. The complete data set was divided into training (compounds 1–45, ) and test (compounds 46–55, ) sets. A statistical cluster analysis was carried out with Tsar 3D version 3.3 (Accelrys, San Diego, USA) using the complete linkage clustering method (Euclidean distances) with no data standardization.
Table I. Chemical structures and corresponding pIC50 values for a series of inhibitors of cruzain from Trypanosoma cruzi.
HQSAR analysis
The HQSAR modelling analyses, calculations and visualisations were performed using the SYBYL 7.3 package (Tripos Inc., St. Louis, USA) running on Red Hat Linux 7.3 workstations, as previously described [Citation17–21]. Basically, HQSAR models can be affected by a number of parameters concerning hologram generation: hologram length, fragment size, and fragment distinction. The generation of the molecular holograms was carried out using several combinations of the following fragment distinction: Atoms (A), Bonds (B), Connections (C), Hydrogen atoms (H), Chirality (Ch), and Donor & Acceptor (DA). The influence of fragment size, which controls the minimum and maximum length of fragments to be included in the hologram, was further investigated by using six distinct fragment sizes over the 12 default series of hologram lengths of 53, 59, 61, 71, 83, 97, 151, 199, 257, 307, 353, and 401 bins. The patterns of fragment counts from the training set inhibitors were then related to the experimental biological data using the partial least squares (PLS) analysis.
Classical QSAR analysis
Classical QSAR studies were carried out using the DRAGON 5.4 (Talette SRL, Milan, Italy), BuildQSAR [Citation22] and PIROUETTE 3.11 software (Infometrix, Washington, USA), as previously described [Citation19,20]. Briefly, 2D molecular descriptors, including topological descriptors, connectivity indices, 2D autocorrelation descriptors, and Burden eigenvalues indices, among others, were computed using the software DRAGON 5.4 and used as independent variables in the QSAR analyses. Next, about 950 molecular descriptors were subjected to the following selection criteria. Descriptors with zero variance as well as those with poor correlation to biological property (r2 < 0.10) or those more than 0.97 pairwise correlated were discarded. This strategy afforded a total of 247 descriptors. Subsequently, the BuildQSAR software was employed to search for multiple linear regressions (MLR) models of up to 4 variables using genetic algorithm (GA). The selection protocol was applied to 50 individuals (models with up to 4 variables) that were evaluated through 200,000 generations. During this processes mutation (10%) and cross-over were allowed in order to increase model fitness, which was evaluated according to the correlation coefficient criteria. All descriptors present in the 10 best MLR models were pooled together, autoscaled and used for the PLS analyses performed with the PIROUETTE software.
QSAR models validation
The QSAR models were investigated using full cross-validated r2 (q2) PLS. Leave-one-out (LOO) cross-validation has been applied to determine the number of components that yield optimally predictive models. Leave-many-out (LMO) validation procedures with either 10 (LMO10) or 5 (LMO5) randomly selected groups were used as more rigorous tests to assess model stability and statistical significance. Each random cross-validation run was repeated 25 times to obtain mean values for q2 and the corresponding standard error of prediction (SDEP). External validation was conducted employing a test set of 10 compounds, which were not considered for QSAR model generation.
Results and discussion
Chemical and biological data
HQSAR and classical QSAR models were derived for a data set of 55 inhibitors of T. cruzi cruzain (). The series of chemically attractive thiosemicarbazone and semicarbazone derivatives examined has substantial structural diversity. The bulk of the structural diversity lies in the nature of the substituent linked to the N1, N4 and C5 of the thiosemicarbazone and semicarbazone moieties ().
Figure 1. General scaffold of thiosemicarbazone and semicarbazone derivatives.
The in vitro IC50 values employed in this work were measured under the same experimental conditions [Citation16], a fundamental requirement for QSAR studies [Citation5,17,20]. The IC50 values of the data set inhibitors vary from 20 to 10,000 nM, and are acceptably distributed across the range of property values ().
Figure 2. Distribution of pIC50 values for the data set compounds.
The generation of consistent statistical models is dependent on the adequacy of the training and test sets used. Therefore, from the original data set, 45 inhibitors (compounds 1–45, ) were selected as members of the training set for model generation, whereas the other 10 inhibitors (compounds 46–55, ) were held as part of the test set for external validation. A statistical cluster analysis revealed an appropriate composition of both training and test sets in terms of chemical diversity and distribution of the biological property across the range of IC50 values. Thus, the data set is suitable for QSAR model development.
HQSAR analysis
HQSAR analyses require as input only 2D chemical structures and the corresponding biological activity data. Basically, the 2D QSAR analyses carried out in this work involved three main steps: (i) the generation of substructural fragments for each T. cruzi cruzain inhibitor member of the data set; (ii) the encoding of these fragments into a molecular hologram; (iii) the statistical generation of PLS QSAR models [Citation20,23]. The molecular hologram (a specialised fragment fingerprint) generated consists of several substructural fragments of the thiosemicarbazone and semicarbazone derivatives that were counted into bins of a fixed length array. The bins represent all of the unique fragments included within a particular molecule and were assigned by a cyclic redundancy check (CRC) algorithm. The bin occupancies of the molecular hologram are structural descriptors (independent variables) encoding compositional and topological molecular information, that is, a fundamental component of molecular basis for the process of target recognition and biological activity. Thus, the molecular hologram includes information on the quantity and type of each fragment in each molecule of the data set, encoding all linear, branched, and overlapping molecular fragments without requiring the 3D alignment of the inhibitors.
HQSAR uses the molecular holograms and PLS to generate fragment-based structure-activity relationships. This investigation requires selecting values for parameters that specify the length of the hologram, as well as the size and type of the fragments that are to be encoded [Citation–26]. Therefore, several combinations of fragment distinction were considered during the QSAR modelling runs using the fragment size default (4-7), as follows: A/B, A/B/C, A/B/C/H, A/B/C/H/Ch, A/C, A/C/Ch, A/C/DA, A/C/H/Ch, A/C/Ch/DA, A/B/H, A/B/C/Ch, A/B/DA, A/B/C/DA, A/B/H/DA, A/B/C/H/DA, and A/B/H/Ch/DA. The HQSAR analyses were performed over the 12 default series of hologram lengths ranging from 53 to 401 bins. The statistical results from the PLS analyses for the 45 training set inhibitors of T. cruzi cruzain using several fragment distinction combinations are summarized in .
Table II. HQSAR analysis for various fragment distinctions on the key statistical parameters using fragment size default (4-7).
As can be seen, the best statistical results were obtained using A/C/Ch/DA as distinction information (model 9, q2 = 0.72 and r2 = 0.94, with SEE = 0.23). During the development of the several models, a considerable influence of the fragment distinction parameter on the predictive ability of the models was observed, as indicated by the values of q2 in (models 1–8, 10–15). This is probably due to an increase in poor information generated by the descriptors used for model development, which adds substantial noise to the cross-validation process [Citation27]. Conversely, the inclusion of the fragment distinction Ch and DA has dramatically improved the predictive ability of the model 9 when compared to models 6 and 7, suggesting that steric and hydrogen-bonding properties play a major role towards the inhibitory potency in this series of cruzain inhibitors. These results highlight the importance of selecting the most appropriate combination of molecular descriptors for the generation of predictive models, which reflects the quantitative description of the structure-activity relationships within the data set. Subsequently, the influence of different fragment sizes on the key statistical parameters was further investigated for the best HQSAR model generated (). Fragment size parameters control the minimum and maximum lengths of fragments to be included in the hologram fingerprint. The results for the different fragment sizes evaluated (2–5, 3–6, 4–7, 5–8, 6–9 and 7–10) show that the statistical quality of models improved with the increasing of the fragment size up to 6–9 (model 21, q2 = 0.75 and r2 = 0.96, with SEE = 0.20).
Table III. HQSAR analysis for the influence of different fragment sizes on the statistical parameters.
The internal statistical consistency of the model 21 was evaluated through the analysis of values of q2 and SDEP obtained by more consistent cross-validation procedures using about 10% and 20% of training set compounds (LMO10 and LMO5, respectively). The cross-validation using 10 random groups yielded an average ![]() of 0.72 with SDEP10 of 0.50, while an average
of 0.72 with SDEP10 of 0.50, while an average ![]() of 0.70 with SDEP5 of 0.52 was obtained for the cross-validation using 5 random groups. These results confirm the good stability and robustness of the model.
of 0.70 with SDEP5 of 0.52 was obtained for the cross-validation using 5 random groups. These results confirm the good stability and robustness of the model.
Although q2 values may give a suitable representation of the model internal consistency and predictive power, the most valuable test of a QSAR model is its ability to predict the property value for new compounds, not included in the training set for model generation [Citation24,28–30]. As the structure encoded in the 2D specialized fingerprints is directly related to the biological activity, HQSAR models should be useful to predict the activity of new structurally related molecules from its fingerprint [Citation25,26]. Thus, the predictive power of the best QSAR model derived using the 45 training set inhibitors was assessed by predicting the biological property for 10 test set compounds (inhibitors 46-55, ). The results of the external evaluation are shown in , and the graphic results for the predicted versus experimental activities of both training set and test set are displayed in .
Table IV. Experimental and predicted activities (pIC50) with residual values for the test set inhibitors.
Figure 3. Plot of predicted values of pIC50versus the corresponding experimental values for the training (open squares) and test (solid circles) set inhibitors for the final HQSAR model.
The good agreement between experimental and predicted pIC50 values for the test set cruzain inhibitors indicates the high quality of the HQSAR model (![]() = 0.95). The predicted values fall close to the experimental pIC50 values, deviating by no more than 0.44 log units. From the low residual values, it can be seen that the HQSAR model obtained is substantially reliable and can be employed to predict the biological activity of novel cruzain inhibitors within this structural diversity.
= 0.95). The predicted values fall close to the experimental pIC50 values, deviating by no more than 0.44 log units. From the low residual values, it can be seen that the HQSAR model obtained is substantially reliable and can be employed to predict the biological activity of novel cruzain inhibitors within this structural diversity.
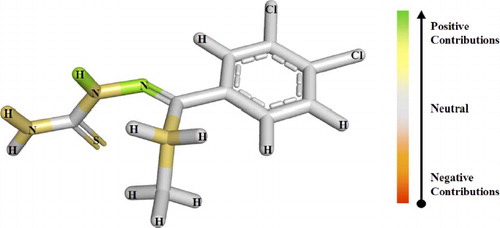
Besides predicting the activities of untested molecules, the HQSAR model plays another important role in providing hints about the influence of different molecular subfragments to biological activity. It includes the identification of substructural patterns related to potency (IC50 values) in the data set of cruzain inhibitors. Therefore, the HQSAR model is graphically represented in the form of very intuitive contribution maps where the colours of the atoms reflect their relative contribution to the overall activity of the molecule. In this context, an accurate interpretation of the contribution maps revealed important molecular fragments related to biological potency, as well as providing further insights into the underlying mechanism of action of this series of cruzain inhibitors. For the analysis of the contribution maps, colours at the red end of the spectrum (e.g., red, red-orange, and orange) reflect poor (or negative) contributions, while colours at the green end of the spectrum (e.g., yellow, green–blue, and green) reflect favorable (positive) contributions. Atoms with intermediate contributions are coloured white.
For example, the contribution of different subfragments for the most potent inhibitor of the series (compound 11, ) is shown in . As can be seen, the contribution map indicates that presence of the thiosemicarbazone moiety is favorable to the inhibitory activity. This is supported by the fact that the replacement of the thiosemicarbazone with a semicarbazone moiety (compounds 39-44) did considerably affect the inhibitory potency, showing that the thiosemicarbazone moiety is essential for this series of enzyme inhibitors. In addition, the contribution map also highlights the importance of the sulfur atom (thiosemicarbazone) for intermolecular interactions with the catalytic cysteine of the T. cruzi cruzain binding pocket. Concomitantly, the model also shows the importance of the N4 and C5 alkyl substituents for activity. This is in agreement with the fact that compounds 9 and 10, with ethyl substituent at C5, have enhanced inhibitory activity when compared to molecules without substituents on C5 (inhibitors 14-18) [Citation16].
Figure 4. HQSAR contribution map for the most potent cruzain inhibitor 11.
Classical QSAR analysis
In order to obtain further insight into the structure-activity relationships for this series of cruzain inhibitors, we resorted to a classical QSAR approach. Recently, the integration between HQSAR and classical QSAR methods has been successfully applied [Citation19,20], illustrating the complementary nature of these approaches as a powerful tool for medicinal chemistry studies and drug design.
Classical 2D QSAR studies require the calculation of molecular descriptors and the construction of mathematical models. In this work, 2D-topological, 2D-BCUTs, 2D-walk and path counts, 2D-autocorrelations, 2D-connectivity indices, 2D-information indices, 2D topological charge indices, and 2D-eigenvalue-based indices, were computed in the DRAGON 5.4 software and then used as independent variables in the QSAR modelling investigations. In order to reduce redundant and useless information, descriptors possessing zero variance, poor correlation to biological activity (r2 < 0.10) as well as those with pairwise correlation superior to 0.97 were discarded. The descriptor space was further reduced through the selection of descriptors closely related to the biological activity. In order to achieve this task, BuildQSAR software was employed to search for the 10 best multiple linear regression (MLR) models of up to 4 variables using GA [Citation31]. This strategy led to the selection of 12 descriptors (gathered from the MLR models) that were pooled together, autoscaled and used in the principal components analysis (PCA) and PLS analysis with the PIROUETTE software.
According to the PCA results, 4 principal components accounted for 91% of total variance, while additional components were considered irrelevant. A graphical analysis of the PCA results indicates that some molecular features of the data set inhibitors could be satisfactorily described by PC2. Less bulky compounds have negative values in PC2, while bulkier compounds have positive values. Weak inhibitors (pIC50 = 5.0) are broadly distributed along PC1 and PC2; however, none of them is located in the lower-right quadrant. In contrast, 75% of the most potent inhibitors (pIC50 > 7.0) are located in this region. These results suggest that the selected descriptors can be used for deriving QSAR models. Thus, PLS QSAR models were created using the LOO cross-validation procedure. As can be seen in , the best statistical model shows good correlation within the training set (q2 = 0.72 and r2 = 0.83). The stability and robustness of the model was further evaluated by the LMO cross-validation procedures. In both cases, no significant differences were obtained (![]() = 0.71, with SDEP10 = 0.52; and
= 0.71, with SDEP10 = 0.52; and ![]() = 0.69, with SDEP5 = 0.54).
= 0.69, with SDEP5 = 0.54).
Figure 5. Plot of predicted values of pIC50versus the corresponding experimental values for the training (open squares) and test (solid circles) set inhibitors for the final classical QSAR model.
The predictive ability of the model was assessed through the prediction of the biological property for 10 test set inhibitors (compounds 46-55, ). The results, of similar quality compared to the HQSAR investigation, are listed in ![]() . Besides demonstrating statistical significance, QSAR models should also provide useful chemical insights for drug design. This goal can be accomplished through a careful interpretation of the importance of the descriptors for the QSAR model. illustrates the influence of the descriptors over the regression vector, which can be regarded as a weighted sum of the loadings included in the model. Accordingly, descriptors with small coefficients (PW3, PiPC09, PiPC10, X5A, EEig03d, EEig02r, BELe4, BELe3, SEIgv, C-039) did not significantly affect the quality of the QSAR model. Conversely, BELm3 and BEHp3 are very important topological descriptors that can be derived from the connectivity matrix, the matrix of eigenvectors, and a diagonal matrix of eigenvalues weighted by an atomic property (atomic masses and atomic polarizabilities, respectively). These descriptors are collectively known as BCUT metric and contain contributions from all atoms, thus reflecting the topology of the whole molecule. The opposite contribution of BELm3 and BEHp3 to the final model indicates that highly polarized undersized molecules have a better interaction profile to the cruzain binding site. For instance, the integrated analyses of classical QSAR and HQSAR models can be regarded as complementary in nature by suggesting that the inhibitory potency of compounds 9 and 10 might be improved in the presence of more polarizable groups of similar molecular mass in positions N4 and C5 adjacent to thiosemicarbazone moiety.
. Besides demonstrating statistical significance, QSAR models should also provide useful chemical insights for drug design. This goal can be accomplished through a careful interpretation of the importance of the descriptors for the QSAR model. illustrates the influence of the descriptors over the regression vector, which can be regarded as a weighted sum of the loadings included in the model. Accordingly, descriptors with small coefficients (PW3, PiPC09, PiPC10, X5A, EEig03d, EEig02r, BELe4, BELe3, SEIgv, C-039) did not significantly affect the quality of the QSAR model. Conversely, BELm3 and BEHp3 are very important topological descriptors that can be derived from the connectivity matrix, the matrix of eigenvectors, and a diagonal matrix of eigenvalues weighted by an atomic property (atomic masses and atomic polarizabilities, respectively). These descriptors are collectively known as BCUT metric and contain contributions from all atoms, thus reflecting the topology of the whole molecule. The opposite contribution of BELm3 and BEHp3 to the final model indicates that highly polarized undersized molecules have a better interaction profile to the cruzain binding site. For instance, the integrated analyses of classical QSAR and HQSAR models can be regarded as complementary in nature by suggesting that the inhibitory potency of compounds 9 and 10 might be improved in the presence of more polarizable groups of similar molecular mass in positions N4 and C5 adjacent to thiosemicarbazone moiety.
Figure 6. Descriptors score to regression vector.
Conclusion
The use of fragment-based molecular holograms and topological descriptors, along with a standard and reproducible high quality biological data, allowed the generation of QSAR models exhibiting both good internal and external consistency, with substantial predictive power for this series of T. cruzi cruzain inhibitors. The information gathered from the HQSAR contribution maps, integrated with a careful analysis of the topological descriptors from the classical QSAR, shed some light on the effects of the substitution pattern related to biological activity within this series of thiosemicarbazone and semicarbazone derivatives. The consistent results confirmed that investigations can be carried out concomitantly to search for synergies between 2D QSAR technologies and drug design. In sum, as the models reported herein have been internally and externally validated employing different 2D QSAR approaches, they appear to be valuable tools for ligand-based enzyme inhibitor design.
Acknowledgements
We gratefully acknowledge financial support from FAPESP (The State of São Paulo Research Foundation), FAPESB (The State of Bahia Research Foundation) and CNPq (The National Council for Scientific and Technological Development), Brazil.
References
- J Mestres. (2005). Representativity of target families in the Protein Data Bank: Impact for family-directed structure-based drug discovery. Drug Discov Today 10:1629–1637.
- JG Robertson. (2005). Mechanistic basis of enzyme-targeted drugs. Biochemistry 44:5561–5571.
- O Lespinet. (2006). Labedan B. Orphan enzymes could be an unexplored reservoir of new drug targets. Drug Discov Today 11:300–305.
- CT Supuran, and A Scozzafava. (2007). Carbonic anhydrases as targets for medicinal chemistry. Bioorg Med Chem 15:4336–4350.
- V Farutin, L Masterson, AD Andricopulo, J Cheng, R Riley, R Hakimi, J Frazer, and EH Cordes. (1999). Structure-activity relationships for a class of inhibitors of purine nucleoside phosphorylase. J Med Chem 42:2422–2431.
- AD Andricopulo, and CA Montanari. (2005). Structure-activity relationships for the design of small-molecule inhibitors. Mini Rev Med Chem 5:585–593.
- C Beyrer, JC Villar, V Suwanvanichkij, S Singh, SD Baral, and EJ Mills. (2007). Neglected diseases, civil conflicts, and the right to health. Lancet 370:619–627.
- MP Barrett, RJ Burchmore, A Stich, JO Lazzari, AC Frasch, JJ Cazzulo, and S Krishna. (2003). The trypanosomiases. Lancet 362:1469–1480.
- S Nwaka, and A Hudson. (2006). Innovative lead discovery strategies for tropical diseases. Nat Rev Drug Discov 5:941–955.
- S Nwaka, and RG Ridley. (2003). Virtual drug discovery and development for neglected diseases through public-private partnerships. Nat Rev Drug Discov 2:919–928.
- JH McKerrow, and JC Engel. (1999). Caffrey CR, Related Articles, Cysteine protease inhibitors as chemotherapy for parasitic infections. Bioorg Med Chem 7:639–644.
- PS Doyle, YM Zhou, JC Engel, and JH McKerrow. (2007). A Cysteine Protease Inhibitor Cures Chagas' Disease in an Immunodeficient Murine Model of Infection. Antimicrob Agents Chemother doi: 10.1128/AAC.00436-07
- H Eckert, and J Bajorath. (2007). Molecular similarity analysis in virtual screening: Foundations, limitations and novel approaches. Drug Discov Today 12:225–233.
- G Klebe. (2006). Virtual ligand screening: Strategies, perspectives and limitations. Drug Discov Today 11:580–594.
- DB Kitchen, H Decornez, JR Furr, and J Bajorath. (2004). Docking and scoring in virtual screening for drug discovery: Methods and applications. Nat Rev Drug Discov 3:935–949.
- X Du, C Guo, E Hansell, PS Doyle, CR Caffrey, TP Holler, JH McKerrow, and FE Cohen. (2002). Synthesis and structure-activity relationship study of potent trypanocidal thio semicarbazone inhibitors of the trypanosomal cysteine protease cruzain. J Med Chem 45:2695–2707.
- KM Honorio, RC Garratt, and AD Andricopulo. (2005). Hologram quantitative structure-activity relationships for a series of farnesoid X receptor activators. Bioorg Med Chem Lett 15:3119–3125.
- KM Honorio, RC Garratt, I Polikarpov, AD Andricopulo, and QSAR Hologram. (2006). studies on farnesoid X receptor activators. Lett Drug Des Discov 3:261–267.
- MS Castilho, RVC Guido, and AD Andricopulo. (2007). 2D Quantitative structure activity relationship studies on a series of cholesteryl ester transfer protein inhibitors. Bioorg Med Chem 15:6242–6252.
- MS Castilho, RVC Guido, and AD Andricopulo. (2007). Classical and hologram QSAR studies on a series of tacrine derivatives as butyryleholinesterase inhibitors. Lett Drug Des Discov 4:106–113.
- LG Ferreira, A Leitao, CA Montanari, and AD Andricopulo. (2007). Hologram quantitative structure-activity relationships for a class of inhibitors of HIV-1 protease. Lett Drug Des Discov 4:356–364.
- DB Oliveira, and AC Gaudio. (2003). BuildQSAR: A new computer program for QSAR analysis. Quant Struct-Activ Relat 19:599–601.
- HQSARTM Manual. SYBYL 6.9.2, Tripos Inc., St. Louis, MO, 2003..
- KM Honorio, RC Garratt, I Polikarpov, AD Andricopulo, and QSAR 3D. (2007). comparative molecular field analysis on Nonsteroidal farsenoid X receptor activators. J Mol Graph Modell 25:921–927.
- MS Castilho, MP Postigo, CB de Paula, CA Montanari, G Oliva, and AD Andricopulo. (2006). Two- and three-dimensional quantitative structure-activity relationships for a series of purine nucleoside phosphorylase inhibitors. Bioorg Med Chem 14:516–527.
- LD Salum, I Polikarpov, and AD Andricopulo. (2007). Structural and chemical basis for enhanced affinity and potency for a large series of estrogen receptor ligands: 2D and 3D QSAR studies. J Mol Graph Modell 25:434–442.
- S Wold, E Johansson, and M Cocchi. PLS — Partial Least Square projections to latent structures. In: H Kubinyi. editor3D QSAR in Drug Design. Leiden: ESCOM; (1993). p 523–550.
- AM Doweyko. (2004). 3D-QSAR illusions. J Comput Aided Mol Des 18:587–596.
- A Golbraikh, M Shen, Z Xiao, YD Xiao, KH Lee, and A Tropsha. (2003). Rational selection of training and test sets for the development of validated QSAR models. J Comput Aided Mol Des 17:241–253.
- A Golbraikh, and A Tropsha. (2002). Beware of q2! J Mol Graph Model 20:269–276.
- H Liu, and P Gramatica. (2007). QSAR study of selective ligands for the thyroid hormone receptor beta. Bioorg Med Chem 15:5251–5261.