
 ?Mathematical formulae have been encoded as MathML and are displayed in this HTML version using MathJax in order to improve their display. Uncheck the box to turn MathJax off. This feature requires Javascript. Click on a formula to zoom.
Abstract
Models of toxicity to tadpoles have been developed as single parameters based on special descriptors which are sums of correlation weights, molecular features, and experimental conditions. This information is presented by quasi-SMILES. Fragments of local symmetry (FLS) are involved in the development of the model and the use of FLS correlation weights improves their predictive potential. In addition, the index of ideality correlation (IIC) and correlation intensity index (CII) are compared. These two potential predictive criteria were tested in models built through Monte Carlo optimization. The CII was more effective than IIC for the models considered here.
Introduction
The toxicity of various compounds to amphibians is of particular interest because their response to pollution is affected by contaminants in the soil and in aquatic compartments. Amphibians are in fact often adopted as biological materials to evaluate acute toxicity since their skin is highly sensitive to polluted water. Furthermore, the toxic effects in the early stages of amphibians, such as tadpoles, may be more affected by aquatic contaminants since tadpoles live in water. Evaluating the toxicity of chemicals through experimental methods is time-consuming and costly. In addition, data on toxicity are needed not only for existing compounds but also for compounds that have not yet been synthesized (Wang, Xing, et al. Citation2019), with the aim of introducing safer and greener substances in the market.
All this makes it very tempting to build models of the toxicity of various compounds toward amphibians through quantitative structure–property/activity relationships (QSPRs/QSARs), that is, by comparing the molecular architecture of possible environmental pollutants (Toropov, Di Nicola, et al. Citation2023; Toropov, Toropova, et al. Citation2023). A convenient feature of QSAR models is that they can be used in batch mode, processing a large number of substances simultaneously.
Compared to our previous work (Toropov, Di Nicola, et al. Citation2023), the following improvements have now been made. First, statistical indices (the index of ideality of correlation and correlation intensity index (CII)) not considered in that work are evaluated (Toropov et al. Citation2022; Toropov, Di Nicola, et al. Citation2023); and second, new SMILES attributes, termed fragments of local symmetry (FLS) are considered (Toropov, Toropova, et al. Citation2023).
It should be noted that the approach is universal since it was used to build models of various endpoints (Lotfi et al. Citation2021; Hamzehali et al. Citation2022; Kumar et al. Citation2023; Kumar and Kumar Citation2023; Lotfi et al. Citation2023; Singh et al. Citation2023; Toropova et al. Citation2023).
Method
Data
We extracted from the literature experimental data on acute lethal toxicity expressed in the negative logarithm of molar concentrations pLC50 (mol/L) after 12, 24, 48, 72, and 96 h exposure of organic compounds to Rana japonica and Rana chensinensis tadpoles (Mekenyan et al. Citation1996; Huang et al. Citation2003; Wang, Yan, et al. Citation2019). Using these data, quasi-SMILES was formed. Here, quasi-SMILES is a combination of ordinary SMILES with codes representing the conditions for determining the endpoint studied. Examples of these conditions are the duration of exposure and the frog species. The quasi-SMILES does not simply codify information related to the chemical structure, but also capture eclectic features.
These quasi-SMILES were randomly split into (i) active training set (≈25%); (ii) passive training set (≈25%); (iii) calibration set (≈25%); and (vi) validation set (≈25%). The reason for using a structured training set (which includes the so-called active and passive training sets together with a calibration set) is outlined in the literature (Toropov, Toropova, et al. Citation2023). Briefly, the calibration set serves to select the parameters of the final model, while the active and passive training sets are used in the early stages of the model development.
Optimal descriptor
The optimal descriptor applied to develop models of the endpoint is:
(1)
(1)
Sk, SSk, as well as the so-called FLS (xyx, xyyx, and xyzyx) are described (Toropov, Toropova, et al. Citation2023). The ‘x’, ‘y’, and ‘z’ are symbols from SMILES fragments, which is the part of quasi-SMILES. The ‘x’, ‘y’, and ‘z’ are arbitrary SMILES attributes. However, the cases ‘x’ = ‘y’ as well as ‘x’ = ‘z’ or ‘y’ = ‘z’ are not considered.
CW(x) is the correlation weight for corresponding fragment of quasi-SMILES. The threshold value is 3 if a SMILES attribute happens less than three times, it is considered rare and removed from the simulations. In this case 15 is the number of epochs of the Monte Carlo optimization to provide numerical data on the CW.
Monte Carlo optimization
The Monte Carlo method is applied to develop the optimal descriptor of quasi-SMILES, which is a sum of so-called correlation weights of attributes of quasi-SMILES attributes. The Monte Carlo method algorithm used to obtain optimal descriptors is a random change in correlation weights of quasi-SMILES attributes selected in a random sequence. If a change in the correlation weight improves the target function, it is fixed. Thus, step by step, the value of the target function is improved, ensuring an increase in the predictive potential of the model.
The CW was optimized using the following target functions:
(2)
(2)
(3)
(3)
(4)
(4)
(5)
(5)
and
are the correlation coefficients between the observed and predicted endpoints for the active and passive training sets. Index of ideality correlation (IIC) is the index of ideality of correlation (Toropova and Toropov Citation2017). CII is the correlation intensity index (Toropov and Toropova Citation2020).
Applicability domain
The applicability domain for the models is assessed from the statistical defects (Toropov, Toropova, et al. Citation2023). A statistical defect does not mean that the structure is definitely an outlier, but it indicates a concern about the representativeness of the elements composing this structure. In other words, the statistical defect is ‘advisory’: a large statistical defect means that a significant part of the structure is not supported by the correlation weights. There are respectively 5, 8, 0, 7, and 3 suspected quasi-SMILES in the validation sets for splits 1, 2, 3, 4, and 5.
Mechanistic interpretation
Having the results of several runs of the Monte Carlo optimization, one can expect that some of the weighted molecular features or experimental conditions will have exclusively positive correlation weights or, conversely, only negative ones. Under such circumstances, one can expect that stable positive weights would indicate factors favoring an increase in the studied endpoint. Accordingly, stable negative weights indicate factors favorable for reducing the value of the endpoint.
The promoters of increasing or decreasing the endpoint are determined based on the observation of multiple runs of the optimization procedure. The SMILES attributes that have positive values in a series of runs can be considered promoters of increasing endpoint values, while, those with negative correlation weights in all runs can be considered promoters of decreasing endpoint values.
Results and discussion
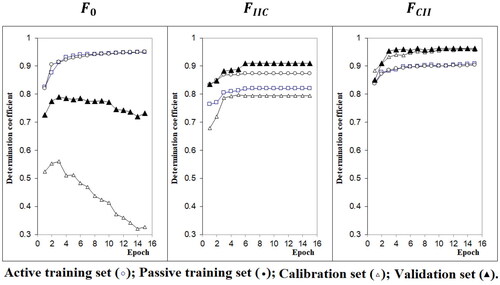
gives a graphic representation of Monte Carlo optimization with different target functions. Optimization with the target function TFCII is preferable because it achieves higher values of the determination coefficients for the different sets, with no drop of the values within the range of epochs considered.
Figure 1. Generalized graphic representation of the evolution of Monte Carlo optimization with different target functions.
shows the statistical characteristics of models for different splits and different target functions. Results are best with the Monte Carlo optimization with target function TFCII. The best results are for split 2, but all the results are very consistent considering, for instance, the R2 of the validation set, which is always 0.96. The root mean square error (RMSE) gives good values too, from 0.13 to 0.22.
Table 1. The statistical quality of models when applying TFIICand TFCII.
The best model is the following:
(6)
(6)
Monte Carlo optimization with target functions TFIIC and TFCII has been considered in several works (Kumar et al. Citation2019; Bagri et al. Citation2020; Javidfar and Ahmadi Citation2020; Lotfi et al. Citation2020; Duhan et al. Citation2021, Citation2022; Singh et al. Citation2022; Tabti et al. Citation2022). This is the first case in which the use of the CII gives noticeably superior statistical characteristics of the model compared to the IIC.
lists promoters of increase/decrease of the endpoint. Chlorine atoms, rings, and time of exposition are clear promoters for increase. Of course, with longer exposure, greater toxicity is to be expected. Chlorine is associated with toxicity, where there is branching in the molecule (indicated by ‘(‘ symbol) and, with greater effect, when there is an aromatic ring (indicated by ‘c’, lower case). The contribution of chlorine to tadpole toxicity has been reported (Roy and Ghosh Citation2006). also indicates the role of rings in enhancing toxicity. This may be related to steric features and higher hydrophobicity.
Table 2. The promoters of increase and decrease for toxicity toward tadpoles.
The effectiveness of the target function should be assessed over several trials. contains the average values of the observed coefficient of determination for the validation set. It can be seen that the target function based on TFCII gives a significantly larger average value of determination coefficient and a significantly lower variance compared to models obtained using other versions of the objective function.
Table 3. Assessment of the predictive potential models observed for different target functions.
It is possible that the CII has proven to be a better basis for the models since it is a measure of the stability of the correlation, whereas the IIC is a measure of the stability of the mean absolute error. However, apparently, this result applies to the considered population of quasi-SMILES. For other situations, an IIC may be a better basis for models than a CII. Likely, simulation of an endpoint with the comparison of both the above criteria is the best.
In addition, approach it is necessary to consider not just one distribution of data in training and validation, but the results for a certain group of different data distributions in training and validation sets.
LogKow, the logarithm of the partitioning of a substance between octanol and water, is a common indicator of hydrophobicity and has often been associated with increased toxicity in tadpoles (Khan and Roy Citation2022). We used additional SMILES descriptors related to the presence of local symmetric components in the molecule. The model identified these descriptors as useful.
The features discussed above are associated with an increase in adverse effects though. There is also a feature associated with a decrease in the effect: nitrogen. This possibly relates to the larger polarity of the molecule, which is more water-soluble, thus absorbed less by the organism. The fact that nitrogen is associated with a decrease in toxicity was already reported by Roy and Ghosh (Citation2006).
compares the statistical quality of different models in the literature. The present model is one with the highest number of substances. This is a requisite for a larger applicability domain. Unfortunately, the number of substances available is limited, and this affects the possibility of applying the model widely to diverse molecules. The statistical parameters of the present model are very good. High values are obtained for both the validation and the training set. R2 is 0.97 for the validation set and 0.92 for the training set, compared to 0.83 in our model published in 2023. The higher value for the training set here indicates a more robust model than the previous one. The value for the training set shown in , 0.92, refers to the substances in the active training, passive training and calibration sets. This was done to be harmonized with the literature, where a larger training set is used, compared to the validation set (44 substances versus 14, ). From a different point of view, considering the real process of model development, the final model is finalized using the parameters selected from the calibration set. Thus, the calibration set represents the final model, and the R2 of this set is 0.95, which is very close to 0.97.
Table 4. Statistical quality of different models of toxicity toward tadpoles.
Supplementary materials section contains the technical details of the model obtained with split #2 using TFCII-optimization.
Conclusions
The essence of this study is to test the effectiveness of using FLS. Using FLS, we have developed an improved model for tadpole toxicity in which correlation weights of FLS increase the predictive potential. Another improvement comes from the Monte Carlo optimization using the CII. The statistical parameters of this model are very good. One limitation, however, is the small dataset. This model will be implemented on the VEGAHUB website (www.vegahub.eu) for wide dissemination.
Supplemental Material
Download MS Excel (78.1 KB)Disclosure statement
No potential conflict of interest was reported by the author(s).
Data availability statement
The data used in this work and developed models are freely available in the Supplementary materials section.
Additional information
Funding
References
- Bagri K, Kumar A, Nimbhal M, Kumar P. 2020. Index of ideality of correlation and correlation contradiction index: a confluent perusal on acetylcholinesterase inhibitors. Mol Simul. 46(10):777–786. doi: 10.1080/08927022.2020.1770753.
- Duhan M, Kumar P, Sindhu J, Singh R, Devi M, Kumar A, Kumar R, Lal S. 2021. Exploring biological efficacy of novel benzothiazole linked 2,5-disubstituted-1,3,4-oxadiazole hybrids as efficient α-amylase inhibitors: synthesis, characterization, inhibition, molecular docking, molecular dynamics and Monte Carlo based QSAR studies. Comput Biol Med. 138:104876. doi: 10.1016/j.compbiomed.2021.104876.
- Duhan M, Sindhu J, Kumar P, Devi M, Singh R, Kumar R, Lal S, Kumar A, Kumar S, Hussain K. 2022. Quantitative structure activity relationship studies of novel hydrazone derivatives as α-amylase inhibitors with index of ideality of correlation. J Biomol Struct Dyn. 40(11):4933–4953. doi: 10.1080/07391102.2020.1863861.
- Hamzehali H, Lotfi S, Ahmadi S, Kumar P. 2022. Quantitative structure–activity relationship modeling for predication of inhibition potencies of imatinib derivatives using SMILES attributes. Sci Rep. 12(1):21708. doi: 10.1038/s41598-022-26279-8.
- Huang H, Wang X, Ou W, Zhao J, Shao Y, Wang L. 2003. Acute toxicity of benzene derivatives to the tadpoles (Rana japonica) and QSAR analyses. Chemosphere. 53(8):963–970. doi: 10.1016/S0045-6535(03)00715-X.
- Javidfar M, Ahmadi S. 2020. QSAR modelling of larvicidal phytocompounds against Aedes aegypti using index of ideality of correlation. SAR QSAR Environ Res. 31(10):717–739. doi: 10.1080/1062936X.2020.1806922.
- Khan K, Roy K. 2022. Chemometric modeling of toxicity of chemicals to tadpoles. In: Roy K, editor. Chemometrics and cheminformatics in aquatic toxicology. Hoboken (NJ): Wiley.
- Kumar P, Kumar A, Sindhu J, Lal S. 2019. QSAR models for nitrogen containing monophosphonate and bisphosphonate derivatives as human farnesyl pyrophosphate synthase inhibitors based on Monte Carlo method. Drug Res. 69(3):159–167. doi: 10.1055/a-0652-5290.
- Kumar P, Kumar A, Sindhu J, Lal S. 2023. Quasi-SMILES as a basis for the development of QSPR models to predict the CO2 capture capacity of deep eutectic solvents using correlation intensity index and consensus modelling. Fuel. 345:128237. doi: 10.1016/j.fuel.2023.128237.
- Kumar P, Kumar A. 2023. CORAL: predictions of quality of rice based on retention index using a combination of correlation intensity index and consensus modelling. In: Toropova, AP, Toropov AA, editors. QSPR/QSAR analysis using SMILES and quasi-SMILES. Challenges and advances in computational chemistry and physics. Vol. 33. Cham: Springer. doi: 10.1007/978-3-031-28401-4_17.
- Lotfi S, Ahmadi S, Azimi A, Kumar P. 2023. Prediction of second-order rate constants of the sulfate radical anion with aromatic contaminants using the Monte Carlo technique. New J Chem. 47(42):19504–19515. doi: 10.1039/D3NJ03696K.
- Lotfi S, Ahmadi S, Kumar P. 2021. A hybrid descriptor based QSPR model to predict the thermal decomposition temperature of imidazolium ionic liquids using Monte Carlo approach. J Mol Liq. 338:116465. doi: 10.1016/j.molliq.2021.116465.
- Lotfi S, Ahmadi S, Zohrabi P. 2020. QSAR modeling of toxicities of ionic liquids toward Staphylococcus aureus using SMILES and graph invariants. Struct Chem. 31(6):2257–2270. doi: 10.1007/s11224-020-01568-y.
- Mekenyan OG, Schultz TW, Veith GD, Kamenska V. 1996. Dynamic’ QSAR for semicarbazide-induced mortality in frog embryos. J Appl Toxicol. 16(4):355–363. doi: 10.1002/(SICI)1099-1263(199607)16:4<355::AID-JAT357>3.0.CO;2-Z.
- Nath A, Roy K. 2022. Chemometric modeling of acute toxicity of diverse aromatic compounds against Rana japonica. Toxicol In Vitro. 83:105427. doi: 10.1016/j.tiv.2022.105427.
- Roy K, Ghosh G. 2006. QSTR with extended topochemical atom (ETA) indices. VI. Acute toxicity of benzene derivatives to tadpoles (Rana japonica). J Mol Model. 12(3):306–316. doi: 10.1007/s00894-005-0033-7.
- Singh R, Kumar P, Devi M, Lal S, Kumar A, Sindhu J, Toropova AP, Toropov AA, Singh D. 2022. Monte Carlo based QSGFEAR: prediction of Gibb’s free energy of activation at different temperatures using SMILES based descriptors. New J Chem. 46(39):19062–19072. doi: 10.1039/D2NJ03515D.
- Singh R, Kumar P, Sindhu J, Kumar A, Lal S. 2023. CORAL: probing the structural requirements for α-amylase inhibition activity of 5-(3-arylallylidene)-2-(arylimino)thiazolidin-4-one derivatives based on QSAR with correlation intensity index, molecular docking, molecular dynamics, and ADMET studies. J Biomol Struct Dyn. 2023:1–18. doi: 10.1080/07391102.2023.2265490.
- Tabti K, Elmchichi L, Sbai A, Maghat H, Bouachrine M, Lakhlifi T. 2022. Molecular modelling of antiproliferative inhibitors based on SMILES descriptors using Monte-Carlo method, docking, MD simulations and ADME/Tox studies. Mol Simul. 48(17):1575–1591. doi: 10.1080/08927022.2022.2110246.
- Toropov AA, Di Nicola MR, Toropova AP, Roncaglioni A, Carnesecchi E, Kramer NI, Williams AJ, Ortiz-Santaliestra ME, Benfenati E, Dorne J-L. 2022. A regression-based QSAR-model to predict acute toxicity of aromatic chemicals in tadpoles of the Japanese brown frog (Rana japonica): calibration, validation, and future developments to support risk assessment of chemicals in amphibians. Sci Total Environ. 830:154795. doi: 10.1016/j.scitotenv.2022.154795.
- Toropov AA, Di Nicola MR, Toropova AP, Roncaglioni A, Dorne JLCM, Benfenati E. 2023. Quasi-SMILES: self-consistent models for toxicity of organic chemicals to tadpoles. Chemosphere. 312(Pt 1):137224. doi: 10.1016/j.chemosphere.2022.137224.
- Toropov AA, Toropova AP, Roncaglioni A, Benfenati E. 2023. In silico prediction of the mutagenicity of nitroaromatic compounds using correlation weights of fragments of local symmetry. Mutat Res Genet Toxicol Environ Mutagen. 891:503684. doi: 10.1016/j.mrgentox.2023.503684.
- Toropov AA, Toropova AP. 2020. Correlation intensity index: building up models for mutagenicity of silver nanoparticles. Sci Total Environ. 737:139720. doi: 10.1016/j.scitotenv.2020.139720.
- Toropova AP, Toropov AA, Kumar P, Kumar A, Achary PGR. 2023. Fragments of local symmetry in a sequence of amino acids: does one can use for QSPR/QSAR of peptides? J Mol Struct. 1293:136300. doi: 10.1016/j.molstruc.2023.136300.
- Toropova AP, Toropov AA. 2017. The index of ideality of correlation: a criterion of predictability of QSAR models for skin permeability? Sci Total Environ. 586:466–472. doi: 10.1016/j.scitotenv.2017.01.198.
- Wang L, Xing P, Wang C, Zhou X, Dai Z, Bai L. 2019. Maximal information coefficient and support vector regression based nonlinear feature selection and QSAR modeling on toxicity of alcohol compounds to tadpoles of Rana temporaria. J Braz Chem Soc. 30(2):279–285. doi: 10.21577/0103-5053.20180176.
- Wang S, Yan LC, Zheng SS, Li TT, Fan LY, Huang T, Li C, Zhao YH. 2019. Toxicity of some prevalent organic chemicals to tadpoles and comparison with toxicity to fish based on mode of toxic action. Ecotoxicol Environ Saf. 167:138–145. doi: 10.1016/j.ecoenv.2018.09.105.