
 ?Mathematical formulae have been encoded as MathML and are displayed in this HTML version using MathJax in order to improve their display. Uncheck the box to turn MathJax off. This feature requires Javascript. Click on a formula to zoom.
Abstract
Toxicology studies in early fish life stages serve an important function in measuring the impact of potentially harmful substances, such as crude oil, on marine life. Morphometric analysis of larvae can reveal the effects of such substances in retarding growth and development. These studies are labor intensive and time consuming, typically resulting in only a small number of samples being considered. An automated system for imaging and measurement of experimental animals, using flow-through imaging and an artificial neural network to allow faster sampling of more individuals, has been described previously and used in toxicity experiments. This study compares the performance of the automated imaging and analysis system with traditional microscopy techniques in measuring biologically relevant endpoints using two oil treatments as positive controls. We demonstrate that while the automated system typically underestimates morphometric measurements relative to analysis of manual microscopy images, it shows similar statistical results to the manual method when comparing treatments across most endpoints. It allows for many more individual specimens to be sampled in a shorter time period, reducing labor requirements and improving statistical power in such studies, and is noninvasive allowing for repeated sampling of the same population.
1. Introduction
Fish larvae develop rapidly during the earliest stages of their life. In Atlantic cod, animals develop from a newly fertilized egg to free-swimming larvae in less than three weeks at a typical water temperature of 9 C. During this period the developing fish is highly sensitive to pollution. Pollutants, such as crude oil components, can have such adverse effects on development as increased mortality, reduced length, reduced yolk consumption (resulting in reduced growth as yolk fuels development), spinal and craniofacial deformities and pericardial edema (Incardona et al. Citation2014, Citation2015; Sørhus et al. Citation2015; Hansen et al. Citation2018; Pasparakis et al. Citation2019).
Determining the effects of toxicants on developing fish is typically done by sampling the test population and imaging these individuals, then measuring endpoints of interest from the images. This requires a trained, experienced human operator to conduct both the microscopy imaging and the manual image analysis. The process is time-consuming and there is potential for inconsistent results due to variation between operators and operator fatigue over prolonged sampling periods. Relatively few fish can be imaged, resulting in low statistical power. Automated methods of imaging and analysis can increase the number of animals it is practical to sample in a given study by reducing the time and labor required, improving the repeatability of measurements and the power and sensitivity of such studies. This is especially useful in studies where sublethal toxic effects may be difficult to detect in a small sample population. Microscopy usually involved terminal sedation of the imaged fish. Detection of pollution-induced deformations over time is therefore impossible on the same fish larvae. Noninvasive, automated imaging methods enable multiple images on a temporal scale on the same fish and will greatly facilitate ecotoxicity research as well as fish developmental biology in general.
Several methods have been described for automating or partially automating the measurement of fish (Teixidó et al. Citation2019; Rasmussen et al. Citation2022), including recent work using an artificial neural network trained on manually annotated microscopy images of fish to automatically segment and measure various body parts (Kvæstad et al. Citation2022). Other systems have also been produced for automated imaging of fish in the laboratory (Iwamoto et al. Citation2001; Lelièvre et al. Citation2012; Colas et al. Citation2018), though with limited analysis.
Previous work by the authors has described an integrated system of automated imaging and analysis for Atlantic cod eggs and larvae (Williamson et al. Citation2022, Citation2024) using a flow-through system for rapid imaging and a neural network trained on such images for morphometric analysis. While the use of a similar neural network for analysis of microscopy images has been shown to produce comparable results to manual measurement (Kvæstad et al. Citation2022), a comparison between microscopy and the flow-through system for automated imaging has not so far been performed.
This study makes use of both manual microscopy and automated imaging in order to better understand the differences in measurement between the two methods. We use two different treatments of dissolved oil compounds as positive controls, compared with clean seawater treatments, with the expectation that oil-exposed fish will display a range of developmental issues and reduction in growth. We demonstrate the practical use of the automated system in measuring the effects of oil compounds on early fish life stages of Atlantic cod (Gadus morhua), and assess to what extent it can be used as a replacement for manual microscopy in such studies.
2. Methods
2.1. Cod embryos
Fertilized eggs (1 day post fertilization (dpf)) were purchased from Havbruksstasjonen (Tromsø, Norway) where a broodstock of Atlantic cod is kept. One male and one female were strip-spawned in the morning, ovarian fluid was rinsed off and milt was added before incubation overnight in a separate incubator. Good fertilization and egg viability (> 90 % fertilization and > 80 % normal cell division) were verified the following day when the fertilized eggs were sent to SINTEF Sealab (Trondheim, Norway). Upon arrival, eggs were acclimated from 4 C (arrival temperature) to 7
C over a period of 6 h, and thereafter kept in a 200 L tank with running sea water (7-8
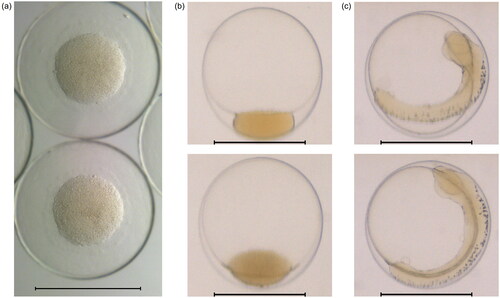
C, 32.5 ppt salinity, pH 7.8). At arrival, the eggs were in late Stage 1 according to literature (Laurence and Rogers Citation1976; Markle and Frost Citation1985) as the eggs had a complete blastodermal cap. At onset of the exposure period, they were in Stage 2. See sample images in .
Figure 1. (a) Microscopy image of eggs on arrival (1 dpf), and flow-through images of eggs at (b) the beginning of the exposure period (3 dpf) and (c) the end of exposure (7 dpf). Scale bars 1 mm. Eggs shown were drawn from the sample not used in the exposure experiments.
2.2. Preparation of exposure solutions
Sea water (pH 7.8, 34 ppt salinity) was collected from 70 m depth in Trondheimsfjorden through the inlet at SINTEF Sealab. The sea water was not further filtered than the sand filter at the inlet before use, and was acclimated to 9 C and added to 2 L borosilicate bottles.
One crude oil and one refined product were used in the experiments. The Statfjord A (SFA, SINTEF ID: 2014-0081, density 0.83434) and an ultra-low sulfur fuel oil (ULSFO, SINTEF ID 2016-0233, density 0.91676) were chosen as representatives for crude and refined oils, respectively. The oils ( µL) were added to a rectangular Teflon adsorbent (
cm) and allowed to dry for 30 min before the oil-containing adsorbent was inserted into the bottles. The bottles were then completely filled, the surface wiped with tissue, and overfilled once more to remove potential oil droplets from the water surface. A total of 24 and 12 bottles were prepared for SFA and ULSFO, respectively. The bottles were closed without head space, so each bottle consisted of approximately 2.3 L sea water and 200 µL oil, giving an oil-to-water loading of 1:11500 based on volume. Negative controls (N = 8) were prepared in identical manner, i.e. they contained the same water and Teflon adsorbents, but no oil. All bottles were incubated in darkness at 9
C with slow stirring 1 h per day for up to 60 days, allowing oil compounds to dissolve from the adsorbent into the water. For SFA, four bottles were sampled at days 4, 14, 21, 28, 40 and 60. For ULSFO, four bottles were sampled at days 4, 28 and 60. At sampling, the Teflon adsorbents were removed, and oxygen and temperature were measured before the bottles were frozen (-20
C).
2.3. Exposure protocol
Before use in toxicity testing, the frozen water samples were defrosted, temperature acclimated back to 9 C and shaken well before water samples (600 mL) were taken and used for conventional gas chromatography
mass spectrometry (GC
MS) for analyses of the following polycyclic aromatic hydrocarbons (PAHs): Benzo(b)thiophene, C0-C4-naphthalenes, biphenyl, acenaphthylene, acenaphthene, dibenzofuran, C0-C3-fluorenes, C0-C4-phenanthrenes/anthracenes, C0-C4-dibenzothiophenes, C0-C3-fluoranthenes/pyrenes, benz(a)anthracene, C0-C4-chrysenes, benzo(b)fluoranthene, benzo(k)fluoranthene, benzo(e)pyrene, benzo(a)pyrene, perylene, indeno(1,2,3-c,d)pyrene, dibenz(a,h)anthracene and benzo(g,h,i)perylene. The concentrations of PAHs were in the range 0.6–46 µg/L. See Table S1 for the concentrations of different PAH groups. The remaining solution (300 mL) was used for exposure experiments. Oxygen was measured in selected bottles to verify sufficient levels for experiments (> 80 % saturation).
As in Hansen et al. (Citation2021), the test procedure used in this study was adapted from OECD Test No. 236: Fish Embryo Acute Toxicity (FET) (OECD Citation2013), designed for use with zebrafish (Danio rerio) in open beakers. While Atlantic cod eggs are of similar size to zebrafish eggs they are less dense and develop both at lower temperatures and over a longer period from fertilization to hatch (80–120 day-degrees, d ) (Hansen et al. Citation2021). Compared to the OECD guideline, we used larger exposure beakers (100 mL), an increased number of individuals (approximately 100 eggs per beaker) and a lower temperature (
C) during exposure.
Cod eggs (3 dpf, approx. 24 d old) were transferred to borosilicate beakers containing filtered (1 µm) sea water (controls; N = 8 replicates) or exposure solutions (100 mL; N = 4 replicates per time point and oil). The eggs were exposed for 96 h, and solutions were renewed after 48 h. After 96 h exposure, all eggs were transferred to new beakers containing filtered sea water for recovery. Mortality (sinking eggs with coagulated embryo) and hatching were monitored daily until 18 dpf (approximately three days post hatch (dph)) when the experiment was terminated. A timeline for the experiment is given in .
Table 1. Timeline of the experiment.
2.4. Microscopy
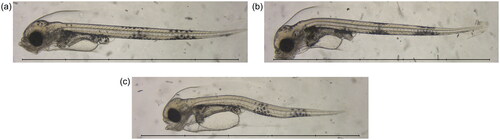
Between 11 and 26 individuals from each treatment group were used for microscopy at 18 dpf. Images were taken through a microscope (Eclipse 80i, Nikon Inc., Japan) equipped with a 2 Nikon PlanApo objective and a CMOS camera (MC170HD, Leica Microsystems, Germany). Example images from the microscopy are shown in . Microscopy images underwent morphometric analyses (standard length, body area, yolk sac area and eye area) following the AutoMOMI method described in Kvæstad et al. (Citation2022), using a neural network previously trained on annotated microscopy images of cod larvae.
Figure 2. Example microscopy images at 17 dpf, showing: (a) a fish from the seawater 4 d control group; (b) a fish from the Statfjord A 40 d treatment group; and (c) a fish from the ULSFO 28 d-2 treatment group. Spinal deformity is visible in the SFA animal, and severe craniofacial and spinal deformities, as well as an enlarged yolk sac and pericardial edema, can be seen in the ULSFO fish. Scale bars 5 mm, 1 mm divisions.
2.5. Automated imaging
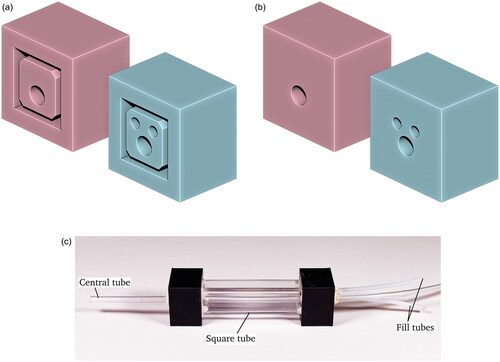
A subset of treatment groups and replicates were selected for automated imaging at 18 dpf. After removal of specimens for manual measurement, the remaining animals in the beaker were imaged using the automated system. This system is described in detail in Williamson et al. (Citation2022) and Williamson et al. (Citation2024). In this experiment, the plastic imaging chamber previously described was replaced with a glass chamber aimed at reducing image distortion and artifacts. The redesigned imaging chamber is shown in . This chamber consists of a 10 mm square cross-section glass tube through which the tubing carrying specimens runs. 3D printed parts (polyactic acid, PLA) at either end enclose the square tubing and maintain the central tube in alignment. The outer chamber is filled with water to reduce image distortion caused by the round tubing. Silicone sealant is used to ensure water tightness at the interfaces between the 3D printed parts and the tubing.
Figure 3. The imaging chamber used in this study. (a,b) show two rendered views of the 3D printed connectors used to mate the imaging chamber to the flow-through tubing, while (c) is a photo of the imaging chamber. Note the Central tube through which the samples are transported, and the two fill tubes on the right side.
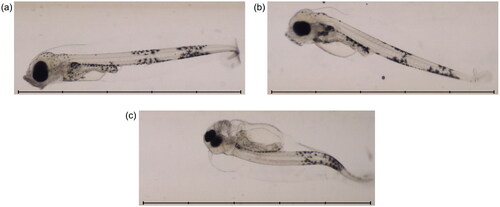
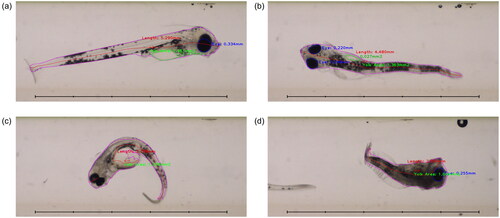
Otherwise the imaging procedure was as described previously, with seawater containing larvae introduced to a funnel at one end of the system, and being drawn through a length of tubing into a collection flask by gravity and a partial vacuum produced by a peristaltic pump. A digital camera equipped with a telecentric lens imaged samples as they passed through the imaging chamber, which was lit by an LED array positioned opposite and facing the camera. Automated imaging took place in a temperature-controlled laboratory at 9 C. Examples of images from the automated imaging system are shown in .
Figure 4. Example images from the automated imaging system at 17 dpf. Images show fish from 3 different treatment groups: (a) seawater 4 d (control); (b) Statfjord A 40 d; (c) ULSFO 28 d-2. The ULSFO animal shows severe developmental issues including spinal and craniofacial deformity and pericardial and yolk sac edemas. Scale bars 5 mm, 1 mm divisions.
Additionally, images were collected once daily from 3–19 dpf using approximately 100 animals from the 200 L holding tank. These images were used to monitor development and for neural network training.
2.6. Automated morphometrics
Image analysis was performed largely as described in Williamson et al. (Citation2022), with initial image segmentation to identify the various parts of the fish performed using a neural network (Mask-RCNN He et al. (Citation2017)) trained on annotated images of larvae, and post-processing with classical computer vision. Training images were drawn from those taken of larvae from the holding tank, images of treatment groups, and images from a previous experiment (Williamson et al. Citation2024). The network was trained for 2115 epochs of 900 iterations on a dataset of 345 training images and 34 validation images, with training monitored using TensorBoard and stopped when overfitting began to occur. An additional pre-processing step was performed on images before presenting them to the neural network, performing background subtraction to remove static elements such as trapped air bubbles or dust.
Following segmentation, endpoint measurements were extracted using utility scripts included in the FishAnnotator software (Williamson Citation2023). These endpoints were: eye area, standard length, structural body area, total body area, yolk area and yolk fraction. It should be noted that yolk fraction and structural body area are measurements derived from total body area and yolk area
: structural body area
is
while yolk fraction
is
. Differences between treatment groups and measurement methods in yolk area and total body area will therefore affect these two measurements too. All other endpoints are measured directly from the segmentations produced by the neural network.
2.7. Statistical analyses
Analysis was performed in Python 3.10 with Pandas, Numpy, OpenCV and Scikit-image for image analysis, as well as Scipy, Scikit-learn, bioinfokit and statsmodels for statistical analysis. The open source FishAnnotator software Williamson (Citation2023) was used to post-process the output of the neural network and Seaborn (Waskom Citation2021) used produce the plots shown. Treatment groups were tested for normality with a Shapiro-Wilks test, then compared with a control using ANOVA followed by Dunnett’s post hoc test. Summaries of these results are shown in Tables S3 and S4. Following the method of Bland and Altman (Citation1986), the mean of measurements for each treatment group and measurement method was calculated and plotted in . The difference in means was calculated, and plotted over the average of the two methods, shown in .
Figure 5. Comparison of mean measured values for automated and manual measurements. Blue circles (![]()
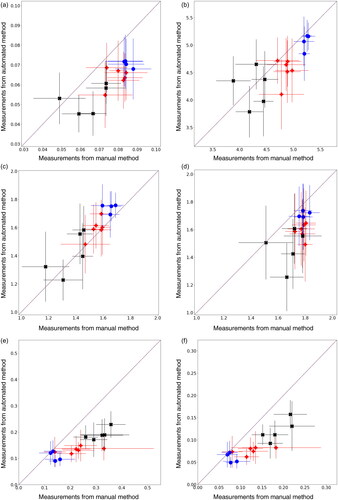
Figure 6. Difference in means of the automated and manual measurements. Blue circles (![]()
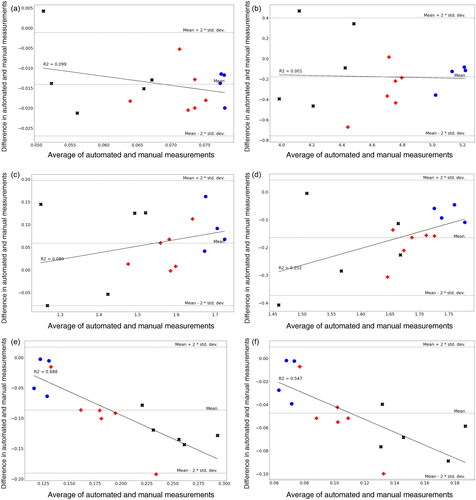
Table 3. The numbers of individual fish used and measurements made by the automated system for each treatment group.
3. Results
3.1. Hatching success and survival
Overall, high hatching success was observed at over 80 % for all treatments (). At the end of the experiments, varying survival was observed. While all seawater treatments had survival rates of 75 % or above, some exposure groups had as low as 25 % survival. Among the oil-exposed groups, there were no clear patterns in hatching and/or survival as a function of oil degradation time.
Table 2. Hatching success, and survival up to 18 dpf, of cod embryos exposed for 4 days (3–7 dpf) to seawater (SW), dissolved fraction of crude statfjord A (SF) and refined ULSFO (UL) oils incubated at 9C for up to 60 days.
3.2. Larvae morphology
A summary of the results of the exposure experiments is shown in Tables S3 and S4 and . The 4 day seawater control was used as a baseline against which to compare other treatments. No significant difference in any of the measured endpoints was seen between the seawater control groups.
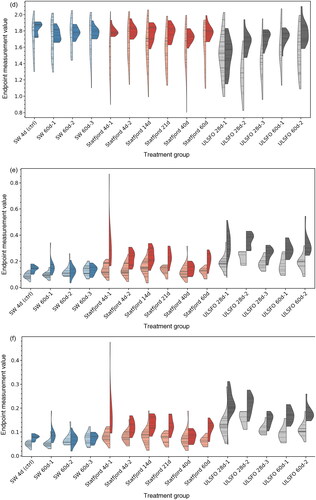
Figure 7. Measured endpoints in larvae treatment groups, showing the distribution of data points as violin plots using a gaussian kernel density estimate (KDE), with the density plotted to the limits of the data range. Lighter, left-hand sides show automated measurements, darker, right-hand sides show manual measurements. Horizontal bars indicate individual measurement values.
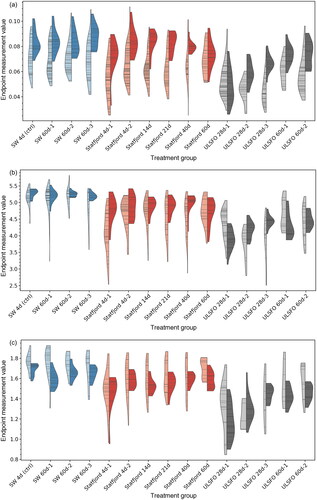
Fish exposed to the Statfjord A crude oil saw reduced total body area at all exposures and using both manual and automated measurement methods, and in some cases significantly increased yolk area. While the manual and automate methods disagreed slightly on the significance of the increase in yolk area, it was most pronounced in the 4 d, 14 d and 21 d treatment groups, with neither method showing a significant change in the 40 d and 60 d groups. Treatments with increased yolk area also saw a significant decrease in structural body area, and a significant increase in yolk fraction.
The manual measurement method did not detect a significant difference in eye area or standard length for SFA treatment groups, although the automated method showed significant decreases in these endpoints for some treatments (eye area: SFA 4 d-1, SFA 14 d and SFA 21 d, standard length: SFA 4 d-1).
The treatment groups using the ULSFO refined oil product also saw significant effects in the majority of cases, generally with a larger effect size. According to the manual method, all treatment groups had significantly reduced total body area and structural body area, as well as significant increases in yolk area and yolk fraction. The automated method largely agreed with these results, with the exception of 60 d treatments showing a non-significant reduction in structural body area. Standard length was significantly reduced in the 28d treatment groups, but not in the 60 d groups (both measurement methods). The manual method showed significant decreases in eye size across the 28 d groups, but no significance in the 60 d groups, while the automated method found significant decreases in both 28 d and 60 d groups.
3.3. Comparison between methods
shows a comparison between the endpoint measurements using images taken by an expert human using microscopy, and the measurements made using the automated system. For each treatment group, the mean measurements are plotted with the x-coordinate given by the manual method and y-coordinate by the automated method. Bars show the standard deviation of the measurements. If the manual and automated measurements were exactly in agreement, points would be lie on the diagonal center line. Points below this line indicate an underestimate by the automated system as compared with the manual method, while points above the line indicate an overestimate. The three different types of treatment are shown by color and shape: blue circles () for seawater (control) groups, red pluses (
) for the Statfjord A groups, and black crosses (
) for ULSFO.
The automated system tends to underestimate relative to manual measurements. This is broadly the case for all treatment groups and and all endpoints with the exception of yolk area, where the automated system somewhat overestimates. The seawater groups tend to lie closest to the central ‘agreement’ line, while ULSFO measurements are typically furthest from the line and are less consistent in whether they are over- or underestimated.
displays the difference between automated and manual measurements by a different method, after Bland and Altman (Citation1986). Here the y-axis shows the difference between the means, while the x-axis is the average (mean) of both automated and manual measurements. Both axes are in the same units as the measurements (mm2 for areas, mm for standard length, and a unitless ratio in the range (0, 1] for yolk fraction). If the two methods were in exact agreement, all points would lie on a line at . Dotted grey lines indicate the mean of all differences, and two standard deviations above and below. This allows us to see whether the size of measurement affects the difference—whether larger measured values are correlated with larger discrepancies. The black line on each plot shows a linear regression, where lines with a steep gradient indicate correlation between measurement size and intermethod measurement discrepancy. Points are coded as previously: blue circles for seawater (control), red pluses for Statfjord-A and black crosses for ULSFO.
While standard length shows a consistent discrepancy regardless of measurement size, it can be seen that eye area, structural body area, yolk area and yolk fraction show some degree of positive correlation between measurement size and discrepancy. Total body area shows a negative correlation—larger measurements are more similar (differences closer to 0) than small ones. As noted above, the derived endpoints (structural body area and yolk fraction) will also be affected by discrepancies in the directly measured endpoints for total body area and yolk area.
A summary of the differences between the manual and automated methods can be seen in Table S5, showing the absolute mean difference between automated and manual methods for each treatment and endpoint, and Table S6, showing the relative differences.
From these figures and tables, it can be seen that in both total and structural body area, the two methods are in close agreement with a mean difference of 5–6 %, although some treatments, mainly ULSFO, show differences up to 10–15 %. Generally the automated method underestimates total body area, while structural body area shows a slight overestimate.
Standard length shows a mean difference of approximately 10 %, with 28 % in the worst case (ULSFO 28 d-2), consistently underestimating compared with the manual method.
Measurements of eye area perform somewhat less well, with a mean discrepancy of 21 % and a worst case (ULSFO 28 d-3) of 38 %. Once again, in most cases the automated method gives lower measurements than the manual method.
Yolk area and yolk fraction give the worst and least consistent performance, showing over 40 % mean discrepancy and a range between 2 % (SW 60 d-2) and 82 % (Statfjord 4 d-1). In all cases the automated method underestimates compared with the manual method.
3.4. Number of automated measurements
gives the number of fish and measurements used by the automated analysis for each treatment group. The number of fish is not the total imaged, but the total from which successful measurements were made. Note that not all fish have all endpoints available, for instance if a body part was not visible in the image or a measurement was found to be in error through automated or manual checks. Each fish can have up to two eye measurements, and no more than one of any other endpoint. Structural body area and yolk fraction can only be calculated if both of the endpoints from which they are derived (total body area and yolk area) were measured.
In the manual imaging, a mean of 16 (range 11–26, see S2 for details) fish were used in each treatment group and all fish had all endpoints available, with the exception of yolk sac measurements for one fish in Statfjord 40 d, and 11 fish where standard length could not be measured.
4. Discussion
4.1. Effects of oil compounds on fish larvae
Components from crude (SFA) and fuel (ULSFO) oils dissolved from the Teflon fabric into sea water over time. The total PAH (TPAH) concentrations the eggs were exposed to were in the range 0.6–46 µg TPAH/L (see Table S1). These TPAH concentration ranges have previously been shown to cause developmental effects in Atlantic cod and the related Atlantic haddock (Melanogrammus aeglefinus) (Hansen et al. (Citation2018, Citation2019a, Citation2019b); Sørhus et al. (Citation2023)). The concentrations and compositions of PAHs varied between the two oils and over time due to dissolution and biodegradation.
The experiment functioned well as positive control for generating larvae with abnormal development to test the described system. Exposure to ULSFO, particularly the ULSFO 28 day, caused more severe morphological effects and deformations than SFA exposure. In this group, the concentrations of heavier PAHs (4–6 ringed) were highest.
4.2. Performance of the automated system
Our results show the potential of automated imaging and analysis in toxicological studies, with some caveats. Compared with manual imaging, the automated system tended to underestimate all directly measured endpoints (eye area, total body area, yolk area and standard length) as well as the derived endpoint yolk fraction, while structural body area was overestimated. These discrepancies were quite consistent within the seawater and SFA groups, but less predictable in ULSFO treatment groups. The ULSFO groups showed the largest deviations from the manual results, and in some cases overestimated rather than underestimated. This is likely to be a result of the severe deformations seen among fish in these treatment groups (see ), since the neural network used for segmentation was trained on images of healthy fish and was less able to accurately identify body parts in deformed animals. In future experiments where deformations are expected, it would be useful to train the neural network on malformed animals as well as healthy specimens.
Figure 8. Flow-through images of fish with neural network segmentation and automated measurements. (a) Shows a fish from the SW-4d control group, displaying good segmentation and measurements. (b) Shows a fish from the SFA-21d group imaged from ‘above’, with poor measurement of the partially obscured yolk sac. (c) Shows a deformed fish from the ULSFO 28d-3 group imaged at an inconvenient angle, where segmentation and measurement has failed badly. (d) Shows a severely deformed (and possibly deceased) fish from the ULSFO 60d-1 group. Scale bars 5 mm, 1 mm divisions.
It is useful to consider the differences between the images used in the two methods. The manual method has images that were taken by hand using a standard light microscopy setup, with immobilized fish carefully positioned to be easy to measure and a neural network trained on microscopy images. The automated method uses images of freely swimming fish at random orientations, flowing at speed through the imaging system, and is trained on images of this type. Apart from differences in image resolution and lens performance, this means that images from the automated method can display some out-of-focus areas, distortion from the tubing containing the fish and from the glass imaging chamber, and difficulties with parts of the fish to be measured being obscured or seen at angles inconvenient to measurement. Fish bent by spinal deformities are also more difficult to accurately measure in the automated system, while in manual microscopy they can be straightened out before imaging.
Despite the differences in measurement, the statistical analysis of results from the automated system largely agreed with those from the manual method—in general the same endpoints were identified as differing in treatment groups from the control group. In cases where the analyses of the two methods differ, it is not clear which is the more correct. While we expect that individual microscopy images will generally result in more accurate measurements thanks to the consistent and clear side-on view of the fish, the larger sample size provided by the automated imaging method may allow the detection of effects not apparent in the manually imaged samples.
While 227 fish were used in manual imaging, around 900 fish were imaged with the automated system, resulting in 539 individuals contributing to the measurements after manual and automated checks. In some treatment groups only a few more fish were measured by the automated method. These include USLFO 28 d-1 and ULSFO 60 d-1, both groups that experienced high mortality, leading to few fish being available to image. While anatomical deformities were not explicitly measured in this study, these were also present in many ULSFO exposed fish, and this compounded the problem of few fish being available by allowing fewer valid measurements to be made.
A great advantage of the automated imaging system is its speed. Where microscopy may require several minutes per fish, an entire beaker of fish can be imaged in 10–15 min using the flow-through system. The microscopy for this study required around 12 h of work from a single human operator, while the automated imaging took around 4.5 h (again with a single operator)—an average of approximately 3 min per individual imaged and 20 s per individual imaged respectively. Increasing the number of fish in a beaker does not appreciably affect the imaging time of the flow-through system, simply resulting in more images being taken in the same timeframe. Larger volumes of water require more time to image, with time increasing roughly linearly with volume. This approach has the potential to greatly reduce the time and cost of human labor in such studies while eliminating the possible effects of operator fatigue during microscopy, and allow for improved statistical power thanks to a larger sample population.
The automated imaging method is also considerably less invasive than manual microscopy. Where typical microscopy methods result in the death of the animals imaged, flow-through imaging does not appear to cause significant harm. This means that the same individuals can be imaged repeatedly without artificially reducing the population size. While in this study experimental animals were imaged on only one day, matching the manual method, in previous work (Williamson et al. Citation2022, Citation2024) they have been imaged daily from shortly post-fertilization until prior to first feeding. This means that multiple life stages can be imaged, potentially allowing stage-specific or non-linear effects over time to be detected.
4.3. Conclusion
The measurements produced by the automated system appear less accurate than those achievable through manual microscopy, particularly when measuring eye and yolk endpoints. Images of larvae are obtained at random orientations and poses, which makes measurement more difficult than in manual methods. The optical properties of the automated system differ from standard microscopy, and this may introduce distortions that bias measurement. The severe morphological deformities apparent in some treatment groups pose a challenge to the automated analysis. Expanding the training set to include deformed animals would likely improve the accuracy of such measurements. The detection of deformities and assessment of their severity is a more complex task, but would be an interesting and useful direction for future work.
The reduced time and labor required for sampling make much larger sample sizes practical, and the noninvasive sampling method allows repeated sampling over time. Bearing in mind the limitations described, this work shows the automated and manual systems to produce broadly similar statistical results in comparing different treatment groups. These results suggest that efforts in neural network training, combined with the automated imaging system, can yield significant advantages for toxicity studies and similar experiments in the future.
Authors’ contributions
DRW: Conceptualization, Methodology, Investigation, Formal analysis, Software, Writing - Original Draft, Writing - Review & Editing; ML: Project administration, Supervision, Writing - Review & Editing; EJD: Methodology, Investigation, Software, Supervision, Writing - Review & Editing; BHH: Conceptualization, Funding acquisition, Investigation, Methodology, Resources, Supervision, Writing - Original Draft, Writing - Review & Editing.
Supplemental Material
Download Latex File (16.4 KB)Disclosure statement
The authors declare that they have no known competing financial interests or personal relationships that could have appeared to influence the work reported in this paper.
Data availability statement
The data that support the findings of this study are available from the corresponding author upon reasonable request. The code used for image annotation and analysis is openly available in the ‘Fish Annotator’ repository at https://github.com/davidrwilliamson/fish-annotator, with an archive of the current version at publication available at https://doi.org/10.5281/zenodo.7934921.
Additional information
Funding
References
- Incardona JP, Gardner LD, Linbo TL, Brown TL, Esbaugh AJ, Mager EM, Stieglitz JD, French BL, Labenia JS, Laetz CA, et al. 2014. Deepwater Horizon crude oil impacts the developing hearts of large predatory pelagic fish. Proc Natl Acad Sci U S A. 111(15):E1510–E1518. doi: 10.1073/pnas.1320950111.
- Incardona JP, Carls MG, Holland L, Linbo TL, Baldwin DH, Myers MS, Peck KA, Tagal M, Rice SD, Scholz NL. 2015. Very low embryonic crude oil exposures cause lasting cardiac defects in salmon and herring. Sci Rep. 5(1):13499. doi: 10.1038/srep13499.
- Sørhus E, Edvardsen RB, Karlsen Ø, Nordtug T, van der Meeren T, Thorsen A, Harman C, Jentoft S, Meier S. 2015. Unexpected interaction with dispersed crude oil droplets drives severe toxicity in Atlantic haddock embryos. PLoS One. 10(4):e0124376. doi: 10.1371/journal.pone.0124376.
- Hansen BH, Farkas J, Nordtug T, Altin D, Brakstad OG. 2018. Does microbial biodegradation of water-soluble components of oil reduce the toxicity to early life stages of fish? Environ Sci Technol. 52(7):4358–4366. doi: 10.1021/acs.est.7b06408.
- Pasparakis C, Esbaugh AJ, Burggren W, Grosell M. 2019. Physiological impacts of Deepwater Horizon oil on fish. Comp Biochem Physiol C Toxicol Pharmacol. 224:108558. (doi: 10.1016/j.cbpc.2019.06.002.
- Teixidó E, Kießling TR, Krupp E, Quevedo C, Muriana A, Scholz S. 2019. Automated morphological feature assessment for zebrafish embryo developmental toxicity screens. Toxicol Sci. 167(2):438–449. doi: 10.1093/toxsci/kfy250.
- Rasmussen JH, Moyano M, Fuiman LA, Oomen RA. 2022. FishSizer: software solution for efficiently measuring larval fish size. Ecol Evol. 12(3):e8672. doi: 10.1002/ece3.8672.
- Kvæstad B, Hansen BH, Davies E. 2022. Automated morphometrics on microscopy images of Atlantic cod larvae using Mask R-CNN and classical machine vision techniques. MethodsX. 9:101598. doi: 10.1016/j.mex.2021.101598.
- Iwamoto S, Checkley DM, Jr., Trivedi MM. 2001. REFLICS: real-time flow imaging and classification system. Mach Vis Appl. 13(1):1–13. doi: 10.1007/PL00013270.
- Lelièvre S, Antajan E, Vaz S. 2012. Comparison of traditional microscopy and digitized image analysis to identify and delineate pelagic fish egg spatial distribution. J Plankton Res. 34(6):470–483. doi: 10.1093/plankt/fbs015.
- Colas F, Tardivel M, Perchoc J, Lunven M, Forest B, Guyader G, Danielou M-M, Le Mestre S, Bourriau P, Antajan E, et al. 2018. The ZooCAM, a new in-flow imaging system for fast onboard counting, sizing and classification of fish eggs and metazooplankton. Prog Oceanogr. 166:54–65. doi: 10.1016/j.pocean.2017.10.014.
- Williamson DR, Nordtug T, Leirvik F, Kvæstad B, Hansen BH, Ludvigsen M, Davies EJ. 2022. A flow-through imaging system for automated measurement of ichthyoplankton. MethodsX. 9:101773. doi: 10.1016/j.mex.2022.101773.
- Williamson DR, Togunov RR, Davies EJ, Ludvigsen M, HansenBH. 2024. Automated monitoring of early life-stage development in Atlantic cod (Gadus morhua) embryos exposed to a reference toxicant. Limnol Ocean Methods. 22(3):170–189. doi: 10.1002/lom3.10599.
- Laurence GC, Rogers CA. 1976. Effects of temperature and salinity on comparative embryo development and mortality of Atlantic cod (Gadus morhua L.) and haddock (Melanogrammus aeglefinus (L.)). J Cons. 36(3):220–228. doi: 10.1093/icesjms/36.3.220.
- Markle DF, Frost L-A. 1985. Comparative morphology, seasonality, and a key to planktonic fish eggs from the Nova Scotian shelf. Can J Zool. 63(2):246–257. doi: 10.1139/z85-038.
- Hansen BH, Farkas J, Piarulli S, Vicario S, Kvæstad B, WilliamsonDR, Sørensen L, Davies EJ, Nordtug T. 2021. Atlantic cod (Gadus morhua) embryos are highly sensitive to short-term 3,4-dichloroaniline exposure. Toxicol Rep. 8:1754–1761. doi: 10.1016/j.toxrep.2021.10.006.
- OECD. 2013. Test No. 236: fish Embryo Acute Toxicity (FET) Test.
- He K, Gkioxari G, Dollár P, Girshick R. 2017. Mask R-CNN. In Proceedings of the IEEE International Conference on Computer Vision, pages, 2961–2969. doi: 10.1109/ICCV.2017.322.
- Williamson DR. 2023. Fish annotator. Zenodo. doi: 10.5281/zenodo.7934921.
- Waskom ML. 2021. seaborn: statistical data visualization. JOSS. 6(60):3021. doi: 10.21105/joss.03021.
- Bland JM, Altman DG. 1986. Statistical methods for assessing agreement between two methods of clinical measurement. Lancet. 327(8476):307–310. doi: 10.1016/S0140-6736(86)90837-8.
- Hansen BH, Sørensen L, Størseth TR, Nepstad R, Altin D, Krause D, Meier S, Nordtug T. 2019a. Embryonic exposure to produced water can cause cardiac toxicity and deformations in Atlantic cod (Gadus morhua) and haddock (Melanogrammus aeglefinus) larvae. Mar Environ Res. 148:81–86. doi: 10.1016/j.marenvres.2019.05.009.
- Hansen BH, Salaberria I, Read KE, Wold PA, Hammer KM, Olsen AJ, Altin D, Øverjordet IB, Nordtug T, Bardal T, et al. 2019b. Developmental effects in fish embryos exposed to oil dispersions—The impact of crude oil micro-droplets. Mar Environ Res. 150:104753. doi: 10.1016/j.marenvres.2019.104753.
- Sørhus E, Sørensen L, Grøsvik BE, Le Goff J, Incardona JP, Linbo TL, Baldwin DH, Karlsen Ø, Nordtug T, Hansen BH, et al. 2023. Crude oil exposure of early life stages of Atlantic haddock suggests threshold levels for developmental toxicity as low as 0.1 µg total polyaromatic hydrocarbon (TPAH)/L. Mar Pollut Bull. 190:114843. doi: 10.1016/j.marpolbul.2023.114843.