
 ?Mathematical formulae have been encoded as MathML and are displayed in this HTML version using MathJax in order to improve their display. Uncheck the box to turn MathJax off. This feature requires Javascript. Click on a formula to zoom.
Abstract
Oncogenic signaling pathways-guided alternative splicing events and their clinical prognostic values were investigated in lung squamous cell carcinoma (LUSC). RNAseq and AS data of LUSC were obtained from TCGA and SpliceSeq database, respectively. Pathway enrichment-guided activity study of alternative splicing (PEGASAS) analysis was performed to evaluate the activity of oncogenic pathways. We identified 4229 AS events in 2311 genes significantly associated with the Hallmark_Myc_Targets_V1 pathway. Twenty-nine prognostic Myc guided-AS events classified LUSC into 3 subtypes, of which Cluster 1 subtype showed the worst prognosis, while cluster 2 subtype showed a favorable prognosis. A prognostic model based on 10 most contributive prognostic AS events identified by LASSO could effectively stratify LUSC patients into high- and low-risk groups. The high-risk group was associated with worse survival and contained more samples in poor prognostic subtype (cluster 1). GSEA revealed that cell adhesion and immune response pathways were significantly enriched in the high-risk group, and AS pathways in the low-risk group. Fifty-nine regulatory SFs were identified to regulate these 10 AS events. Myc-guided AS events could classify LUSC samples into subtypes with significantly different survival. A prognostic model based on 10 Myc-guided AS events could predict the survival of LUSC.
Introduction
There were 2,206,771 new cases and 1,796,144 deaths globally in 2020 for lung cancer, accounting for 11.4% of the global cancer burden and 18.0 of global cancer-related mortality, respectively (Sung et al. Citation2021). Non-small cell lung cancer (NSCLC) accounts for approximately 85% of all lung cancers, and lung squamous cell carcinoma (LUSC) is a major subtype of NSCLC (Sabbula and Anjum Citation2019). It’s the most common type of NSCLC in men, which may be due to its high correlation with smoking. Although around 70% of stage I patients survived more than 5 years, the overall five-year survival rate of LUSC is around 20%, due to the last diagnosis of LUSC at advanced stages (Siegel et al. Citation2019; Sabbula and Anjum Citation2019). Traditional chemotherapy is the primary treatment for advanced LUSC, but the response to treatment in individuals varies greatly. In recent years, predictive molecular biomarkers have been considered a powerful addition to the available treatments for LUSC, which can identify the patients who benefit the most and predict the risk of adverse events (Genova et al. Citation2016; Liao et al. Citation2020). Therefore, it is necessary to identify novel prognostic biomarkers for LUSC.
Alternative splicing (AS) is a conserved biological process that generates multiple RNA variants from a single transcript (Kornblihtt et al. Citation2013). AS causes variable incorporation of coding regions, resulting in the production of functionally different proteins and contributing to proteomic diversity, while AS of noncoding regions can modulate the localization, stability and translation efficiency of mRNAs (Kim et al. Citation2008). Therefore, keeping AS under control is very important, but abnormality of AS is prevalently found in diseases and is associated with disease progression (Garcia-Blanco et al. Citation2004; Scotti and Swanson Citation2016). Dysregulation of AS is also identified in cancers, including LUSC (Garcia-Blanco et al. Citation2004; Bonnal et al. Citation2020; Wang and Aifantis Citation2020). AS is emerging as a new hallmark of cancers (Ladomery Citation2013; Farina et al. Citation2020), and contributes to tumor development, drug resistance, immune evasion and metastasis (Marzese et al. Citation2018; Sciarrillo et al. Citation2020). Lack of the RAS-binding domain of BRAF V600E resulting from alternative splicing in melanoma leads to resistance to RAF inhibitors (Poulikakos et al. Citation2011). Exon 4 deletion variant of epidermal growth factor receptor associates with metastasis of ovarian cancer (Zhang et al. Citation2013), while DeltaRon, a constitutively active isoform of tyrosine kinase RON, promotes invasion and motility of cancer cells (Ghigna et al. Citation2005).
Many studies have reported the association of AS with the prognosis of multiple cancers (Hu et al. Citation2019; Chen et al. Citation2020; Wan et al. Citation2020; Wu et al. Citation2021). Epithelial splicing regulatory proteins 1 and 2 (ESPR1/2) are the master regulators for AS, and studies have shown that ESPR1/2 expression promotes AS of CD44 and associates with poor outcomes in breast and ovarian cancer (Yae et al. Citation2012; Chen et al. Citation2017). Δ40p53 isoform is elevated in tumor tissues and positively correlated with unfavorable prognosis in triple-negative breast cancer (Avery-Kiejda et al. Citation2014). AS in LUSC is also related to cancer prognosis (Liu et al. Citation2020; Yan et al. Citation2021). Yan et al. detected 1996 AS events in LUSC that correlated with overall survival of LUSC (Yan et al. Citation2021), while another group, 1991 prognostic AS events (Liu et al. Citation2020). However, these studies focused mainly on the effect of individual AS events, but did not focus on a set of AS events guided by oncogenic pathways.
Here we aim to investigate the global AS events in LUSC and identify a set of AS events associated with important cancer-related signaling pathways. Its predictive capacity on LUSC prognosis was examined thereafter through the workflow shown in Figure S1. Our study identified oncogenic Myc-related AS events that exhibited a potent prognostic ability for LUSC patients.
Materials and methods
Data collection and processing
The RNAseq data and clinical information of LUSC from The Cancer Genome Atlas (TCGA) database were downloaded. The percent spliced index (PSI) values (range 0-1, an intuitive ratio to quantify different AS events) of AS in TCGA_LUSC samples were downloaded from the SpliceSeq database (Ryan et al. Citation2012). The data were filtered with the following criterion: ≥75% samples have PSI value and the average PSI value ≥ 0.05.
A total of 540 samples (48 healthy samples and 492 tumor samples with tumor stage information) that had RNA-seq data and PSI value were included in our study. The tumor samples contain 401 early-stage samples and 91 advance-stage samples (Supplementary Table 1). Among them, 485 samples with prognostic information were used for the construction of a prognostic model.
Pathway enrichment-guided activity study of alternative splicing (PEGASAS) analysis
H: hallmark gene sets containing 51 tumor-related pathways were downloaded from the MSigDB database (V7.1) (Liberzon et al. Citation2011). The activity score of each pathway was calculated by PEGASAS (Phillips et al. Citation2020) based on the expression profile. Activity comparison between normal samples, early-stage, and advance-stage groups were performed using student’s t-test. The correlation analysis between pathway activity score and PSI value of AS was performed with a cutoff of |correlation coefficient| > 0.2 and p < 0.0002.
KEGG pathway enrichment and gene ontology analysis
The GO biological process (BP) and KEGG pathway enrichment analysis were performed by the online tool DAVID with a cutoff of p < 0.01 and count >2. The redundant GO terms were filtered out by REViGO and displayed in scatterplots.
Screening of prognostic-related AS events
The AS events showed a significant difference between normal, early-stage, and advance-stage samples were screened using t-test, and their prognostic values were evaluated using univariate Cox regression analysis. AS events with p < 0.05 were significantly associated with prognosis.
Unsupervised clustering of AS events
Unsupervised clustering of prognostic-related AS events was performed by heatmap (Version 1.0.8) in R3.6.1 based on centered person correlation to reveal subtypes of tumors. The correlation of each subtype with prognosis was analyzed by Kaplan–Meier (KM) survival curve using survival package (Version 2.41-1) in R3.6.1. The clinical information between different subtypes was compared thereafter.
Construction of the prognostic risk model
Tumor samples were divided into a training set and a validation set randomly and equally. The training set, validation set, and whole set were used for the prognostic model construction and validation. The most contributive prognostic AS events were further screened by the LASSO Cox regression analysis using the glmnet package (Version 4.0-2) in R3.6.1, in which AS events were analyzed with 10-fold cross-validation to obtain an optimized λ value. AS events with a regression coefficient value equal to 0 were the optimized AS events used to construct a prognostic model. The prognostic score (PS) was calculated by the following formula:
CoefAS represents the LASSO prognostic coefficient of AS event. Exp PSI represents the expression level of AS event in the training set.
Evaluation and comparison of the predictive efficacy of the prognostic model
On the basis of the formula, the PS score for all samples in each data set was calculated, followed by subgrouping samples into High-risk (PS > Median(PS)) and Low-risk (PS < Median(PS)) subgroups based on the median value. The KM survival curves were plotted by survival package (Version2.41-1) in R.3.6.1 to evaluate the differences in survival between of High-risk and Low-risk groups.
Construction of regulatory network between splicing factor (SF) and prognostic AS events
Seventy-one SFs (corresponding to 67 genes), validated in previous studies, were downloaded from the SpliceAid2 database (Piva et al. Citation2012). Their expression levels were obtained from the LUSC transcriptomic data. The Spearman correlation coefficient (ρ) between SF expression and prognostic AS events was calculated, followed by Benjamini-Hochberg corrections. The adjusted p < 0.05 and |ρ| > 0.2 were set as cutoff values to screen SF-AS regulatory pairs. The SF-AS regulatory network was constructed by cytoscape (Version 3.4.0) (Shannon et al. Citation2003).
Gene set enrichment analysis (GSEA) analysis of the high-risk and low-risk group
The differential analysis between the high-risk and low-risk group was performed by limma (Version 3.34.7) based on the expression data to calculate logFC value. The GSEA pathway enrichment analysis was performed by the clusterProfiler (Version 3.16.0) based on reference KEGG pathway gene sets from the MSigDB database. All genes were input and ranked by LogFC descending, followed by Benjamini-Hochberg corrections. The adjusted p.adjust < 0.05 was set as a cutoff value to present significantly enriched pathways.
Validation of key genes in an independent cohort
The expression pattern of the genes involved in key prognostic AS events was analyzed between LUSC tumor and normal samples using a T-test based on the TCGA cohort and two other independent datasets. GSE19188 dataset contained 27 LUSC and 65 normal samples, and GSE30219 contained 61 LUSC and 14 normal samples. Both these datasets were downloaded from the Gene Expression Omnibus database.
Results
Identification of Hallmark gene sets associated AS events
The pathway activity scores of 51 hallmark gene sets in normal, early-stage, and advance-stage were calculated by the PEGASAS analysis (Table S2). The comparison of pathway activity identified 2 differential pathways (Hallmark_Apical_Surface and Hallmark_MYC_Targets_V1) that showed a significant difference between these groups (Figure (A,B)). A total of 1868 AS events (Corresponding to 1126 genes) and 4229 AS events (Corresponding to 2311 genes) were significantly associated with the Hallmark_Apical_Surface and Hallmark_MYC_Targets_V1, respectively (Table S3).
Figure 1. Identification of Hallmark gene sets-associated AS events. (A, B) The activities of tumor signaling pathways in normal, early-stage and advance-stage of LUSC were calculated by the PEGASAS analysis. Hallmark_Myc_Targets_V1 (A) and Hallmakr_Apical_Surface (B) were shown. (C, D) GO BP analysis of Hallmark_Myc_Targets_V1 (C) and Hallmakr_Apical_Surface (D)-associated AS events. (E) KEGG pathway enrichment of Hallmakr_Apical_Surface (left) and Hallmark_Myc_Targets_V1 (right)-associated AS events.
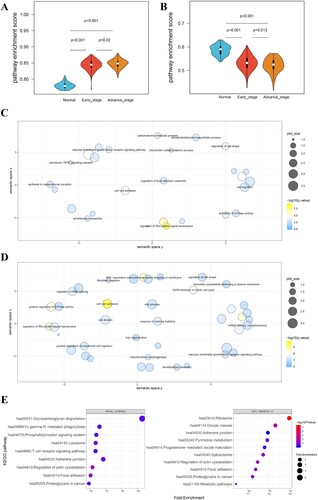
The GO BP and KEGG pathway enrichment analyses were performed on the Hallmark_Apical_Surface and Hallmark_MYC_Targets_V1 associated AS genes. Twenty-six GO BP and nine KEGG pathways were obtained from the Hallmark_Apical_Surface-associated AS genes, while 41 GO BP and 10 KEGG pathways were enriched from the Hallmark_MYC_Targets_V1-associated AS genes (Figure (C–E)). Notably, RNA splicing-related pathways, including GO BP terms regulation of RNA splicing, mRNA splicing via spliceosome and KEGG pathway spliceosome, were observed in the Hallmark_MYC_Targets_V1-associated AS genes, suggesting this hallmark pathway was closely related to RNA splicing.
Screening of prognosis-related AS events and AS-based LUSC subtype classification
A total of 552 AS events guided by the Hallmark_MYC_Targets_V1 showed significant differences among normal, early-stage, and advance-stage samples (Figure (A)). Of which, univariate Cox regression analysis revealed 29 prognosis-related AS events (Table ).
Figure 2. Screening of prognosis-related AS events and AS-based LUSC subtype classification. (A) Heatmap of PSI value of differential AS events between normal, early-stage and advance-stage LUSC. (B) Unsupervised heatmap of PSI value of prognostic AS events. (C) The Kaplan-Meier survival curve of LUSC clusters. (D–G) distribution of patient tumor stage (D), age (E), gender (F) and pathologic_N (G) in LUSC clusters.
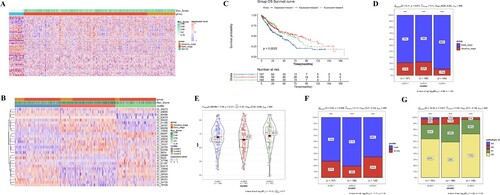
Table 1. Univariate Cox regression analysis of prognosis-related AS events.
Based on the expression of the 29 prognostic AS events, unsupervised clustering-assigned tumor samples into three clusters (Figure (B)). There were 157, 188, and 140 samples in clusters 1, 2, and 3, respectively. The KM survival curve showed a different prognosis of each cluster. Cluster 1 subtype showed the worst prognosis, while cluster 2 subtype showed a relatively good prognosis (Figure (C)). Combined with clinical information, we found significant differences in tumor stage, age, gender, and pathologic-N between clusters (Figure (D–G)). More early-stage samples and pathologic N0-N1 samples were clustered in the Cluster 3 subtype. Therefore, early-stage and low pathologic grades might be drivers for the better survival of the Cluster 3 subtype.
Construction and evaluation of the predictive efficacy of the prognostic model
Among the 29 prognosis-related AS events, LASSO regression analysis identified 10 most contributive prognostic AS events (Figure (A) and Table ), including AT events (ID_81185 and ID_81187) in DNAJC2 gene, AT event (ID_28797) in EFCAB11 gene, AT event (ID_29320) in PPP2R5C gene, AT event (ID_9625) in C4BPB gene, AP event (ID_38130) in VPS9D1 gene, AP event (ID_63415) in PPARG gene, AP event (ID_66486) in CCDC14 gene, AP event (ID_79157) in AQP1 gene and ES event (ID_59273) in EPB41L1 gene. KM survival curves were plotted to evaluate the survival differences for each AS event between the high PSI (PSI value ≥ median) and the low PSI group (PSI value < median), every AS event showed significant differences between the high PSI and low PSI groups (Figure (B–K)). Among them, high levels of several AS events (ID_9625, ID_63415, ID_66486, ID_81187, and ID_29320) were correlated with a poor prognosis of LUSC, while others (ID_28797, ID_38130, ID_59273, ID_79157, ID_81185) were correlated with favorable prognosis.
Figure 3. Construction and evaluation of the predictive efficacy of the prognostic model. (A) λ selection in LASSO model. (B–K) The Kaplan-Meier survival curve of OS-related AS events.
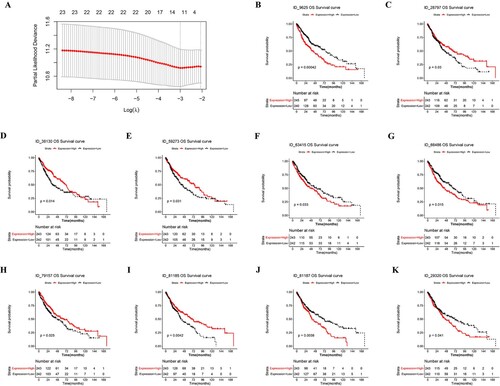
Table 2. Optimized prognostic AS events.
The prognostic model was established based on these 10 AS events, and the PS scores of all samples in the training set, validation set, and whole set were calculated. According to the median PS score, samples were obviously divided into high-risk and low-risk groups. The distribution of PS scores and PSI values in the training set was shown (Figure (A)). The PSI values of AS events (ID_66486, ID_63415, ID_9625, ID_81187, ID_29320) were gradually elevated along with increase of PS score, while others (ID_79157, ID_81185, ID_59273, ID_28797, ID_38130) were decreased. Samples in each set were divided into high-risk group and low-risk group based on the median of PS scores, and KM survival curves were plotted. Patients in the high-risk group showed worse survival than those in the low-risk group (Figure (D)). These observations were further confirmed in the validation set (Figure (B,E)) and whole set (Figure (C,F)), demonstrating our prognostic model can effectively predict the prognosis of LUSC.
Figure 4. Evaluation of the predictive efficacy of the prognostic model. (A–C) PS scores distribution (Up), patient survival information (Middle), and heatmap for PSI of 10 prognostic AS events (Low) in the training set (A), validation set (B), and whole set (C). (D–F) The Kaplan-Meier survival curve of high- and low-risk groups in the training set (D), validation set (E), and whole set (F). (G) distribution of LUSC clusters in high- and low-risk groups.
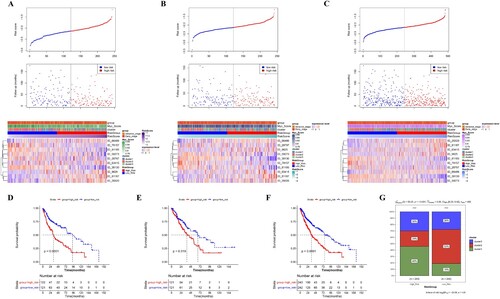
To further interrogate the associations between risk groups and LUSC subtypes, we examined the samples’ distribution of each cluster in high-risk and low-risk groups (Figure (G)). The high-risk group contains more cluster 1 samples (46%), while the low-risk group was dominated by cluster 2 patients (53%). This result was consistent with the survival analysis that cluster 1 subtype had worse survival, while cluster 2 subtype had favorable survival than other subtypes. Altogether, these data demonstrated that the higher proportion of cluster 1 subtype patients might explain the worse survival of the high-risk group.
Expression pattern of genes involved in the prognostic AS events
Nine genes were involved in the 10 most prognostic AS events in the prognostic model, including DNAJC2, EFCAB11, PPP2R5C, C4BPB, VPS9D1, PPARG, CCDC14, AQP1 and EPB41L1. The expression pattern of these 9 genes was analyzed. In the TCGA cohort, all 9 genes were differentially expressed in LUSC tumor samples compared with normal samples (Figure S2(A)). Additionally, their expression was also validated in two independent cohorts. In both datasets, in addition to CCDC14, EPB41L1, PPP2R5C and VPS9D1, the other five genes were all differentially expressed in LUSC tumor samples compared with normal samples, with similar expression pattern in two datasets and TCGA cohorts (Figure S2(B,C)). The results suggested that these prognostic AS events might play important roles in LUSC by affecting the expression pattern of genes.
Construction of regulatory network between SF and prognosis-related AS events
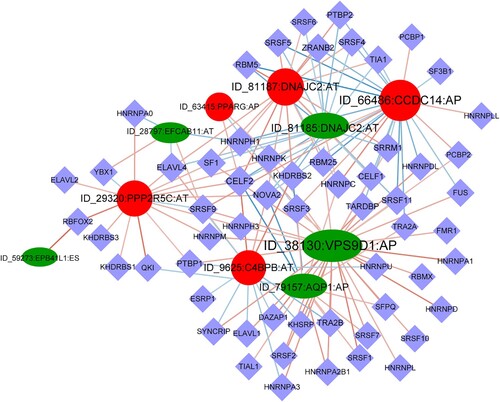
SFs are major contributors of AS and play important roles in oncogenesis. A total of 149 SF-AS interaction pairs between 10 AS events and 59 SFs were identified (Figure ). Seven of them were regulated by many SFs. Notably, SF CELF2 were significantly correlated with the 10 AS events, while HNRNPC, NOVA2, SRSF3 were associated with 9 of 10 AS events. This close correlation between AS events and SFs suggests the involvement of SFs in the regulation of AS in LUSC, and contributes to the regulation of LUSC progression.
Figure 5. Regulatory network of AS and splicing factors. The diamond nodes represent splicing factors (SF); the ellipse nodes represent favorable alternative splicing (AS) events, and the circle nodes represent unfavorable AS events; the lines represent the correlation between AS events and SFs, respectively.
GSEA pathway enrichment analysis
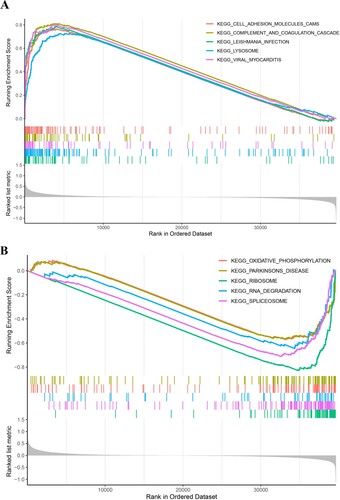
Sixty-seven KEGG pathways showed significant differences between high-risk group and low-risk groups. The top 5 pathways with the largest normalized enrichment score in high-risk group and low-risk groups were plotted (Figure (A,B)). Pathways involved in cell interaction (cell adhesion molecules) and immune response (complement and coagulation cascade, Leishimania infection, Lysosome, and Viral myocarditis) were observed in the high=risk group, while RNA splicing-related pathways (spliceosome and RNA degradation) were found in the low-risk group.
Figure 6. GSEA pathway enrichment analysis. The top 5 differential KEGG pathways enriched in the high-risk group (A) and low-risk group (B).
Discussion
LUSC is a common type of lung cancer with a poor prognosis, and many new cases are diagnosed every year. Evaluation and prediction of the clinical outcome of LUSC are critical for patient care and disease management. Abnormality in AS regulation is prevalent in various diseases and contributes to disease progression. AS is emerging as a new hallmark of cancer and contributes to tumor development, drug resistance, immune evasion and metastasis. Dysregulation of AS is also identified in cancers, including LUSC. Our current study demonstrated that the oncogenic MYC-related AS events exhibited potent prognostic power for the overall survival of LUSC. Furthermore, three subtypes of LUSC were classified based on the expression levels of these AS events. Each LUSC subtype showed a different clinical outcome. Further study is required to interrogate the relationship of Myc with AS in LUSC and understand the roles of these AS events in the pathogenesis of LUSC.
AS is conservative and tightly regulated and it showed considerable flexibility to adapt various surrounding environments. AS is found in multiple diseases and it participates in the pathogenesis of many diseases (Kelemen et al. Citation2013; Scotti and Swanson Citation2016). While consistent results were also observed in our study, we further interrogated the association of these AS with cancer-related hallmark gene sets, and our data showed that these differential AS events in LUSC were significantly associated with Hallmark_Apical_Surface and Hallmark_Myc_Targets_V1 pathways. Myc signaling is under tight control in normal cells but abnormally activated in tumors. Myc signaling is implicated in the initiation and maintenance of various cancers. Studies have shown that Myc contributes to the malignancy of LUSC (Chanvorachote et al. Citation2020). Myc can be regulated by many upstream signaling including JAK/STAT pathway, Wnt/β catenin signaling, Notch signaling, and Ras/PI3 K/AKT/GSK-3 pathway to promote cancer cell proliferation, survival, metastasis and drug resistance through direct or indirect modulation of target gene expression (Chanvorachote et al. Citation2020). Intriguingly, our results demonstrated that pathways involved in alternative splicing regulation were enriched in Hallmark_Myc_Targets_V1 pathway-associated AS genes. This agrees with previous study that demonstrated that oncogenic Myc signaling regulates alternative splicing in different cancers (Koh et al. Citation2015; Phillips et al. Citation2020). These results suggest that AS is an important target of Myc signaling in LUSC and insinuates the contribution of AS in the carcinogenesis of LUSC under the control of oncogenic Myc signaling. Furthermore, Myc-guided AS events stratified LUSC patients into 3 clusters with different prognoses. Among them, cluster 1 contained more advanced patients and showed a poorer prognosis than other clusters. These results further strengthened the importance of Myc-associated AS events in the malignancy of LUSC and highlighted their prognostic values.
Among those MYC-guided prognostic AS events, we obtained 10 most valuable AS events after LASSO regression analysis, involving 9 genes, including DNAJC2, EFCAB11, PPP2R5C, C4BPB, VPS9D1, PPARG, CCDC14, AQP1 and EPB41L1. PP2A B subunit isoform B56-gamma (PPP2R5C) is a regulatory subunit of protein phosphatase 2A (PP2A) and a tumor suppressor by activating p53 or suppressing ERK signaling (Letourneux et al. Citation2006; Li et al. Citation2007; Shouse et al. Citation2008). AS of PPP2R5C was reported in gastrointestinal adenocarcinomas and ovarian cancers (Lin et al. Citation2018; Zhu et al. Citation2018), but its functional consequences remain unknown. cancer cells may employ the AS machinery to inactivate the tumor suppressor activity of PPP2R5C. Peroxisome proliferator-activated receptor gamma (PPARG) is a transcription factor that regulates fatty acid β-oxidation and plays an important role in cancer development (Tachibana et al. Citation2008), AS of PPARG is also identified in tumors with unknown effects (Sebestyen et al. Citation2015). AS of other tumor-relevant genes (VPS9D1, EPB41L1, AQP1) also showed prognostic ability in various cancers (Wang et al. Citation2017; Song et al. Citation2019; Liang et al. Citation2020; Du et al. Citation2021). Besides, our study identified several novel AS events in cancers. AS of EF-hand calcium-binding domain 11 (EFCAB11) was reported in macrophages upon Mycobacterium tuberculosis infection but not in tumors (Kalam et al. Citation2017). AS of Coiled-coil domain-containing protein 14 (CCDC14) is not reported yet. DnaJ heat shock protein family member C2 (DNAJC2, also known as ZRF1) is a chromatin regulator and participates in epigenetic modulation of gene transcription in cancers (Aloia et al. Citation2015), but AS of DNJC2 is not found in other cancers or diseases. Complement component 4 binding protein beta (C4BPB) regulates the activation of the complement cascade and circulating C4BPB may serve as indicators for cancer prognosis and metastasis (Battistelli et al. Citation2008; Liu et al. Citation2012). AS of C4BPB is not reported before. These AS events in cancer-associated genes insinuate their functions in carcinogenesis, and the novel AS events may also contribute to tumor progression rather than act as prognosis biomarkers.
The 10 AS events-based prognostic model stratified LUSC patients into high- and low-risk groups, and patients in the high-risk group showed significantly poorer prognosis than those in the low-risk group. Intriguingly, the distribution of LUSC clusters in the high-risk and low-risk groups varied greatly. Samples in Cluster 2 subtype (favorable survival) were dominant in the low-risk group, while samples in Cluster 1 subtype (worse survival) were highly enriched in the high-risk group, which was consistent with the prognosis of LUSC clusters. These data demonstrated that our prognosis model could effectively predict the risk of LUSC and may be helpful for the clinical management of LUSC. A previous study also investigated AS in LUSC and identified a survival-associated AS signature (Liu et al. Citation2020). While consistently discovering the prognostic value of AS events for LUSC, our study interrogated oncogenic Myc pathway-guided AS events rather than global AS in LUSC. Furthermore, the MYC-guided AS events classified 3 different subtypes of LUSC, which revealed the internal diversity of LUSC and deepened our understanding and further management of LUSC. Given the regulatory roles of oncogenic MYC signaling in AS, the MYC-associated AS events may not only act as prognosis markers but also contribute to the malignancy of LUSC. Further study is warranted to explore the oncogenic roles of MYC-associated AS events.
Our current study identified a set of oncogenic Myc signaling-guided AS events in LUSC and classified 3 subtypes of LUSC with different clinical outcomes based on these AS events. We established a powerful Myc-guided prognostic AS-based prognosis model stratifying LUSC patients with different risks. Our findings deepened our understanding of the prognostic power of Myc-associated AS events and suggested their essential roles in the pathogenesis of LUSC. Further studies are required to elucidate the underlying mechanism(s) of Myc-related AS in the progression of LUSC.
Supplemental Material
Download Zip (1,019.8 KB)Acknowledgements
YL contributed to the conception and design of the research and drafted the manuscript ; KW contributed to the acquisition of data: FL and WL contributed to the analysis and interpretation of data ; YS contributed to statistical analysis; ; JX revised the manuscript for important intellectual content. All authors read and approved the final manuscript.
Disclosure statement
No potential conflict of interest was reported by the author(s).
Data availability statement
The (log2(fpkm+1) RNAseq data and phenotype data of Lung Squamous Cell Carcinoma (LUSC) used in this study is available publicly from The Cancer Genome Atlas (TCGA) database at https://xenabrowser.net/. The percent spliced index (PSI) values of alternative splicing events of TCGA-LUSC samples were available from the SpliceSeq database http://projects.insilico.us.com/TCGASpliceSeq/. GSE19188 and GSE30219 datasets were available from the Gene Expression Omnibus database at https://www.ncbi.nlm.nih.gov/geo/query/acc.cgi?acc.
Additional information
Funding
References
- Aloia L, Demajo S, Di Croce L. 2015. ZRF1: a novel epigenetic regulator of stem cell identity and cancer. Cell Cycle. 14:510–515.
- Avery-Kiejda KA, Morten B, Wong-Brown MW, Mathe A, Scott RJ. 2014. The relative mRNA expression of p53 isoforms in breast cancer is associated with clinical features and outcome. Carcinogenesis. 35:586–596.
- Battistelli S, Stefanoni M, Lorenzi B, Dell’avanzato R, Varrone F, Pascucci A, Petrioli R, Vittoria V. 2008. Coagulation factor levels in non-metastatic colorectal cancer patients. Int J Biol Markers. 23:36–41.
- Bonnal SC, Lopez-Oreja I, Valcarcel J. 2020. Roles and mechanisms of alternative splicing in cancer – implications for care. Nat Rev Clin Oncol. 17:457–474.
- Chanvorachote P, Sriratanasak N, Nonpanya N. 2020. C-myc contributes to malignancy of lung cancer: a potential anticancer drug target. Anticancer Res. 40:609–618.
- Chen L, Yao Y, Sun L, Zhou J, Miao M, Luo S, Deng G, Li J, Wang J, Tang J. 2017. Snail driving alternative splicing of CD44 by ESRP1 enhances invasion and migration in epithelial ovarian cancer. Cell Physiol Biochem. 43:2489–2504.
- Chen P, He J, Ye H, Jiang S, Li Y, Li X, Wan J. 2020. Comprehensive analysis of prognostic alternative splicing signatures in endometrial cancer. Front Genet. 11:456.
- Du JX, Liu YL, Zhu GQ, Luo YH, Chen C, Cai CZ, Zhang SJ, Wang B, Cai JL, Zhou J, et al. 2021. Profiles of alternative splicing landscape in breast cancer and their clinical significance: an integrative analysis based on large-sequencing data. Ann Transl Med. 9:58.
- Farina AR, Cappabianca L, Sebastiano M, Zelli V, Guadagni S, Mackay AR. 2020. Hypoxia-induced alternative splicing: the 11th hallmark of cancer. J Exp Clin Cancer Res. 39:110.
- Garcia-Blanco MA, Baraniak AP, Lasda EL. 2004. Alternative splicing in disease and therapy. Nat Biotechnol. 22:535–546.
- Genova C, Rijavec E, Grossi F. 2016. Recent advances in squamous non-small cell lung cancer: evidence beyond predictive biomarkers. Expert Rev Anticancer Ther. 16:1–4.
- Ghigna C, Giordano S, Shen H, Benvenuto F, Castiglioni F, Comoglio PM, Green MR, Riva S, Biamonti G. 2005. Cell motility is controlled by SF2/ASF through alternative splicing of the Ron protooncogene. Mol Cell. 20:881–890.
- Hu YX, Zheng MJ, Zhang WC, Li X, Gou R, Nie X, Liu Q, Hao YY, Liu JJ, Lin B. 2019. Systematic profiling of alternative splicing signature reveals prognostic predictor for cervical cancer. J Transl Med. 17:379.
- Kalam H, Fontana MF, Kumar D, Salgame P. 2017. Alternate splicing of transcripts shape macrophage response to mycobacterium tuberculosis infection. PLoS Pathog. 13:e1006236.
- Kelemen O, Convertini P, Zhang Z, Wen Y, Shen M, Falaleeva M, Stamm S. 2013. Function of alternative splicing. Gene. 514:1–30.
- Kim E, Goren A, Ast G. 2008. Alternative splicing: current perspectives. Bioessays. 30:38–47.
- Koh CM, Bezzi M, Low DH, Ang WX, Teo SX, Gay FP, Al-Haddawi M, Tan SY, Osato M, Sabo A, et al. 2015. MYC regulates the core pre-mRNA splicing machinery as an essential step in lymphomagenesis. Nature. 523:96–100.
- Kornblihtt AR, Schor IE, Allo M, Dujardin G, Petrillo E, Munoz MJ. 2013. Alternative splicing: a pivotal step between eukaryotic transcription and translation. Nat Rev Mol Cell Biol. 14:153–165.
- Ladomery M. 2013. Aberrant alternative splicing is another hallmark of cancer. Int J Cell Biol. 2013:1–6.
- Letourneux C, Rocher G, Porteu F. 2006. B56-containing PP2A dephosphorylate ERK and their activity is controlled by the early gene IEX-1 and ERK. EMBO J. 25:727–738.
- Li HH, Cai X, Shouse GP, Piluso LG, Liu X. 2007. A specific PP2A regulatory subunit, B56gamma, mediates DNA damage-induced dephosphorylation of p53 at Thr55. EMBO J. 26:402–411.
- Liang T, Sang S, Shao Q, Chen C, Deng Z, Wang T, Kang Q. 2020. Abnormal expression and prognostic significance of EPB41L1 in kidney renal clear cell carcinoma based on data mining. Cancer Cell Int. 20:356.
- Liao Y, Xiao H, Cheng M, Fan X. 2020. Bioinformatics analysis reveals biomarkers with cancer stem cell characteristics in lung squamous cell carcinoma. Front Genet. 11:427.
- Liberzon A, Subramanian A, Pinchback R, Thorvaldsdottir H, Tamayo P, Mesirov JP. 2011. Molecular signatures database (MSigDB) 3.0. Bioinformatics. 27:1739–1740.
- Lin P, He RQ, Ma FC, Liang L, He Y, Yang H, Dang YW, Chen G. 2018. Systematic analysis of survival-associated alternative splicing signatures in gastrointestinal pan-adenocarcinomas. EBioMedicine. 34:46–60.
- Liu Y, Jia W, Li J, Zhu H, Yu J. 2020. Identification of survival-associated alternative splicing signatures in lung squamous cell carcinoma. Front Oncol. 10:587343.
- Liu YS, Luo XY, Li QR, Li H, Li C, Ni H, Li RX, Wang R, Hu HC, Pan YJ, et al. 2012. Shotgun and targeted proteomics reveal that pre-surgery serum levels of LRG1, SAA, and C4BP may refine prognosis of resected squamous cell lung cancer. J Mol Cell Biol. 4:344–347.
- Marzese DM, Manughian-Peter AO, Orozco JIJ, Hoon DSB. 2018. Alternative splicing and cancer metastasis: prognostic and therapeutic applications. Clin Exp Metastasis. 35:393–402.
- Phillips JW, Pan Y, Tsai BL, Xie Z, Demirdjian L, Xiao W, Yang HT, Zhang Y, Lin CH, Cheng D, et al. 2020. Pathway-guided analysis identifies Myc-dependent alternative pre-mRNA splicing in aggressive prostate cancers. Proc Natl Acad Sci USA. 117:5269–5279.
- Piva F, Giulietti M, Burini AB, Principato G. 2012. Spliceaid 2: a database of human splicing factors expression data and RNA target motifs. Hum Mutat. 33:81–85.
- Poulikakos PI, Persaud Y, Janakiraman M, Kong X, Ng C, Moriceau G, Shi H, Atefi M, Titz B, Gabay MT, et al. 2011. RAF inhibitor resistance is mediated by dimerization of aberrantly spliced BRAF(V600E). Nature. 480:387–390.
- Relli V, Trerotola M, Guerra E, Alberti S. 2019. Abandoning the notion of non-small cell lung cancer. Trends Mol Med. 25(7):585–594.
- Ryan MC, Cleland J, Kim R, Wong WC, Weinstein JN. 2012. Spliceseq: a resource for analysis and visualization of RNA-Seq data on alternative splicing and its functional impacts. Bioinformatics. 28:2385–2387.
- Sciarrillo R, Wojtuszkiewicz A, Assaraf YG, Jansen G, Kaspers GJL, Giovannetti E, Cloos J. 2020. The role of alternative splicing in cancer: from oncogenesis to drug resistance. Drug Resist Updat. 53:100728.
- Scotti MM, Swanson MS. 2016. RNA mis-splicing in disease. Nat Rev Genet. 17:19–32.
- Sebestyen E, Zawisza M, Eyras E. 2015. Detection of recurrent alternative splicing switches in tumor samples reveals novel signatures of cancer. Nucleic Acids Res. 43:1345–1356.
- Shannon P, Markiel A, Ozier O, Baliga NS, Wang JT, Ramage D, Amin N, Schwikowski B, Ideker T. 2003. Cytoscape: a software environment for integrated models of biomolecular interaction networks. Genome Res. 13:2498–2504.
- Shouse GP, Cai X, Liu X. 2008. Serine 15 phosphorylation of p53 directs its interaction with B56gamma and the tumor suppressor activity of B56gamma-specific protein phosphatase 2A. Mol Cell Biol. 28:448–456.
- Siegel RL, Miller KD, Jemal A. 2019. Cancer statistics, 2019. Cancer J Clin. 69:7–34.
- Song J, Liu YD, Su J, Yuan D, Sun F, Zhu J. 2019. Systematic analysis of alternative splicing signature unveils prognostic predictor for kidney renal clear cell carcinoma. J Cell Physiol. 234:22753–22764.
- Sung H, Ferlay J, Siegel RL, Laversanne M, Soerjomataram I, Jemal A, Bray F. 2021. Global cancer statistics 2020: GLOBOCAN estimates of incidence and mortality worldwide for 36 cancers in 185 countries. Cancer J Clin. 71:209–249.
- Tachibana K, Yamasaki D, Ishimoto K, Doi T. 2008. The role of PPARs in cancer. PPAR Res. 2008:102737.
- Wan Q, Sang X, Jin L, Wang Z. 2020. Alternative splicing events as indicators for the prognosis of uveal melanoma. Genes (Basel). 11(2):227.
- Wang E, Aifantis I. 2020. RNA splicing and cancer. Trends Cancer. 6:631–644.
- Wang Y, Fan Y, Zheng C, Zhang X. 2017. Knockdown of AQP1 inhibits growth and invasion of human ovarian cancer cells. Mol Med Rep. 16:5499–5504.
- Wu ZH, Tang Y, Zhou Y. 2021. Alternative splicing events implicated in carcinogenesis and prognosis of thyroid gland cancer. Sci Rep. 11:4841.
- Yae T, Tsuchihashi K, Ishimoto T, Motohara T, Yoshikawa M, Yoshida GJ, Wada T, Masuko T, Mogushi K, Tanaka H, et al. 2012. Alternative splicing of CD44 mRNA by ESRP1 enhances lung colonization of metastatic cancer cell. Nat Commun. 3:883.
- Yan JQ, Liu M, Ma YL, Le KD, Dong B, Li GH. 2021. Development of alternative splicing signature in lung squamous cell carcinoma. Med Oncol. 38:49.
- Zhang P, Zhang P, Zhou M, Jiang H, Zhang H, Shi B, Pan X, Gao H, Sun H, Li Z. 2013. Exon 4 deletion variant of epidermal growth factor receptor enhances invasiveness and cisplatin resistance in epithelial ovarian cancer. Carcinogenesis. 34:2639–2646.
- Zhu J, Chen Z, Yong L. 2018. Systematic profiling of alternative splicing signature reveals prognostic predictor for ovarian cancer. Gynecol Oncol. 148:368–374.