Abstract
Background. Cancer patients showing highly elevated interstitial fluid pressure (IFP) in the primary tumor may benefit from particularly aggressive treatment. There is some evidence that gadolinium diethylene-triamine penta-acetic acid (Gd-DTPA)-based dynamic contrast-enhanced magnetic resonance imaging (DCE-MRI) may be a useful non-invasive method for providing information on the IFP of tumors. The purpose of this preclinical study was to investigate whether any association between DCE-MRI-derived parametric images and tumor IFP can be strengthened by using MR contrast agents with higher molecular weights than that of Gd-DTPA. Material and methods. A-07 human melanoma xenografts were used as preclinical models of human cancer. Three contrast agents were compared: Gd-DTPA (0.55 kDa), P846 (3.5 kDa), and gadomelitol (6.5 kDa). A total of 46 tumors were subjected to DCE-MRI and subsequent measurement of IFP. Parametric images of Ktrans (the volume transfer constant of the contrast agent) and ve (the fractional distribution volume of the contrast agent) were produced by pharmacokinetic analysis of the DCE-MRI series. Results. Significant inverse correlations were found between median Ktrans and IFP for Gd-DTPA (p = 0.0076; R2 = 0.46; n = 14) and P846 (p = 0.0042; R2 = 0.45; n = 16), whereas there was no correlation between median Ktrans and IFP for gadomelitol (p > 0.05; n = 16). Significant correlation between median ve and IFP was not found for any of the contrast agents (p > 0.05 for Gd-DTPA, P846, and gadomelitol). Conclusion. Ktrans images, but not ve images, derived by pharmacokinetic analysis of DCE-MRI data for low-molecular-weight contrast agents may provide information on the IFP of tumors. Any association between Ktrans and IFP cannot be expected to be improved by using contrast agents with higher molecular weights than those of Gd-DTPA and P846.
Elevated interstitial fluid pressure (IFP) is a characteristic feature of most malignant tumors [Citation1,Citation2]. Experimental studies have shown that highly elevated IFP in tumors may cause resistance to radiation therapy [Citation3,Citation4] and promote metastatic dissemination [Citation5]. Studies of patients with advanced cervical carcinoma have shown that high IFP in the primary tumor is linked to pelvic recurrence after radiation therapy, high incidence of distant metastases, and poor overall and disease-free survival rates [Citation6–8]. Furthermore, elevated IFP in tumors may lead to poor uptake of macromolecular therapeutic agents and, hence, resistance to some forms of chemotherapy, immunotherapy, and gene therapy [Citation9].
Comprehensive studies of the mechanisms leading to elevated IFP in tumors have been carried out [Citation1,Citation2,Citation9]. These studies have shown that high IFP in malignant tissues is a consequence of severe microvascular, lymphatic, and interstitial abnormalities. Briefly, tumors develop interstitial hypertension because they show increased transcapillary fluid flow and lack functioning lymphatic vessels [Citation9]. Differences in IFP among tumors result primarily from differences in resistance to blood flow caused by differences in the architecture of the microvascular network and from differences in transcapillary fluid flow caused by differences in the permeability of the vessel walls [Citation10].
Cancer patients showing highly elevated IFP in the primary tumor may benefit from particularly aggressive treatment [Citation2]. A non-invasive imaging method for identifying these patients is therefore urgently needed. It has been suggested that dynamic contrast-enhanced magnetic resonance imaging (DCE-MRI) may provide information on the IFP of tumors [Citation1]. Significant correlations between DCE-MRI parameters and tumor IFP have been found in a study of patients with cervical carcinoma [Citation11]. However, the correlations were too weak to be clinically useful, possibly because the DCE-MRI was not optimized with the purpose of assessing the IFP.
DCE-MRI is an attractive strategy for developing a non-invasive assay of the IFP of tumors because the uptake of MR contrast agents in malignant tissues is influenced significantly by the tumor blood perfusion and the permeability of the tumor vessel walls (i.e. the microvascular parameters that are decisive for the magnitude of the IFP). The relative importance of these microvascular parameters for the uptake of an MR contrast agent is determined primarily by the molecular weight of the contrast agent. The uptake of low-molecular-weight contrast agents is determined primarily by the blood perfusion, and with increasing molecular weight, the uptake becomes increasingly more dependent on the vessel wall permeability and less dependent on the blood perfusion [Citation12]. Because IFP differs among tumors as a consequence of differences in resistance to blood flow and differences in resistance to transcapillary fluid flow, the potential of DCE-MRI as a method for assessing the IFP of tumors may depend significantly on the size of the contrast agent.
The possibility that DCE-MRI may be a useful imaging strategy for characterizing the physiological microenvironment of tumors is currently being evaluated in several laboratories including our laboratory [Citation13–18]. In our studies, parametric images of Ktrans (the volume transfer constant of the contrast agent) and ve (the fractional distribution volume of the contrast agent) are produced by subjecting DCE-MRI series of xenografted human tumors to pharmacokinetic analysis using the modified Kety model developed by Tofts et al. [Citation19]. The studies carried out thus far have shown that our experimental procedure produces highly reproducible parametric images [Citation16] and that the parametric images may provide valid information on the physiological tumor microenvironment [Citation17,Citation18]. Thus, statistically significant but weak correlations have been found between Ktrans and IFP in melanoma xenografts by using a low-molecular-weight contrast agent [Citation18]. The purpose of the present work was to investigate whether stronger correlations can be found by using contrast agents with higher molecular weights. The investigation was carried out with A-07 melanoma xenografts, and three contrast agents with molecular weights of 0.55 kDa, 3.5 kDa, and 6.5 kDa were compared.
Materials and methods
Tumors
A-07 human melanoma xenografts growing in female BALB/c nu/nu mice weighing 23–27 g were used as tumor models [Citation20]. Tumors were initiated from cells cultured in RPMI-1640 medium supplemented with 13% bovine calf serum, 250 mg/l penicillin, and 50 mg/l streptomycin. Approximately 3.5 × 10⁵ cells in 10 μl of Hanks’ balanced salt solution were inoculated intradermally in the mouse leg. Forty-six mice bearing tumors with volumes of 100–600 mm3 were included in the study. DCE-MRI and IFP measurements were performed with mice anesthetized with fentanyl citrate, fluanisone, and midazolam in doses of 0.63 mg/kg, 20 mg/kg, and 10 mg/kg, respectively. Animal care and experimental procedures were carried out in accordance with the Interdisciplinary Principles and Guidelines for the Use of Animals in Research, Marketing, and Education (New York Academy of Sciences, New York, NY).
Contrast agents
Three contrast agents were used: gadolinium diethylene-triamine penta-acetic acid (Gd-DTPA, Magnevist®; Schering, Berlin, Germany), P846 (Guerbet, Roissy, France), and gadomelitol (P792, Vistarem®; Guerbet, Roissy, France). These contrast agents have molecular weights of 0.55 kDa (Gd-DTPA), 3.5 kDa (P846), and 6.5 kDa (gadomelitol). P846 and gadomelitol are experimental Gd-based contrast agents with T1 relaxivities at 1.5 T (37°C) of 32 s−1mM− 1 and 27 s− 1mM− 1, respectively. Their molecular structures have been published [Citation21]. The contrast agents were diluted in 0.9% saline to a final concentration of 60 mM (Gd-DTPA) or 7.0 mM (P846 and gadomelitol) and were administered in the tail vein of the mice in a bolus dose of 5.0 ml/kg body weight. The administration was carried out after the mice had been positioned in the MR scanner by using a 24G neoflon connected to a syringe through a 30 cm long polyethylene tubing.
Arterial input functions
The arterial input functions of the contrast agents were determined by analyzing blood samples in vitro [Citation16]. Briefly, 60 μl samples were collected from venous blood with heparin-treated glass capillaries and diluted to appropriate volumes in 0.9% saline. The concentration of the contrast agents in the samples was determined by MRI [Citation22]. The MRI was carried out shortly after the blood sampling to prevent signal contamination by free hemoglobin.
DCE-MRI
DCE-MRI was carried out as described earlier by using a 1.5-T whole-body scanner (Signa; General Electric, Milwaukee, WI) and a slotted tube resonator transceiver coil constructed for mice [Citation17]. Briefly, T1-weighted (TR = 200 ms, TE = 3.2 ms, and αT1 = 80°) and proton density (TR = 900 ms, TE = 3.2 ms, and αPD = 20°) images were recorded at a spatial resolution of 0.23 × 0.47 × 2.0 mm3 by using an image matrix of 256 × 64, a field of view of 6 × 3 cm2, and one excitation. The coil was insulated with styrofoam to prevent excessive heat loss from the mice. The body core temperature of the mice was kept at 37–38°C during imaging by using a thermostatically regulated heating pad. Two calibration tubes, one with 0.5 mM (Gd-DTPA) or 0.06 mM (P846 and gadomelitol) of contrast agent in 0.9% saline and the other with 0.9% saline only, were placed adjacent to the mice in the coil. The tumors were imaged axially in a single section through the center. Two proton density images and three T1-weighted images were acquired before the contrast agent was administered, and T1-weighted images were recorded at a time resolution of 14 seconds for ∼13 minutes after the administration of the contrast agent. Contrast agent concentrations were calculated from signal intensities by using the method of Hittmair et al. [Citation22]. The DCE-MRI series were analyzed on a voxel-by-voxel basis by using the iso-directional transport model of Tofts et al. [Citation19]. According to this model,
where Ct(T) is the concentration of contrast agent in the tissue at time T, Ca(T) is the arterial input function, Hct is the hematocrit, Ktrans is the volume transfer constant of the contrast agent, and ve is the fractional distribution volume of the contrast agent in the tissue [Citation19]. Parametric images were determined from the best curve fits to plots of Ct versus T.
Interstitial fluid pressure
IFP was measured in the center of the tumors by using a Millar SPC 320 catheter equipped with a Mikro-Tip tranceducer with a diameter of 0.66 mm (Millar Instruments, Houston, TX) [Citation23]. The catheter was connected to a computer via a Millar TC-510 control unit and a model 13-66150-50 preamplifier (Gould Instruments, Cleveland, OH). Data acquisition was carried out by using LabVIEW software (National Instruments, Austin, TX).
Statistical analysis
Correlations between two parameters were searched for by using the Pearson product moment correlation test. Probability values (p) and correlation coefficients (R2) were calculated by using SigmaStat statistical software (SPSS Science, Chicago, IL, USA). A significance criterion of p < 0.05 was used.
Results
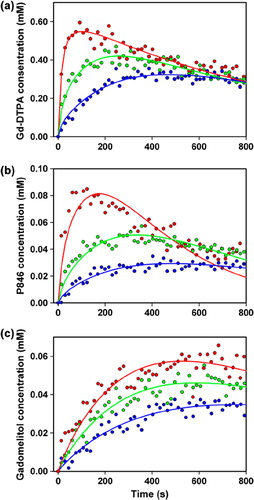
shows the blood concentration of Gd-DTPA, P846, and gadomelitol in BALB/c nu/nu mice as a function of time after the administration of a bolus dose of 5.0 ml/kg body weight of a 60 mM Gd-DTPA solution () or a 7.0 mM solution of P846 () or gadomelitol (). The arterial input functions were found by fitting a double exponential function to the data:
Figure 1. The blood concentration of Gd-DTPA (a), P846 (b), and gadomelitol (c) in BALB/c nu/nu mice as a function of time after intravenous administration of a bolus dose of 5.0 ml/kg body weight of a 60 mM Gd-DTPA solution or a 7.0 mM solution of P846 or gadomelitol. The points represent blood samples from 10 (a), 13 (b), and 20 (c) mice. One to five blood samples were obtained from each mouse in (a), whereas a single blood sample was obtained from each mouse in (b) and (c). The curves show the best fit of a double exponential function to the blood sample data.
The numerical values of the constants were determined to be: A = 2.55 mM, B = 0.080 s− 1, C = 1.20 mM, and D = 0.0010 s− 1 (Gd-DTPA); A = 0.266 mM, B = 0.065 s− 1, C = 0.178 mM, and D = 0.0032 s− 1 (P846); and A = 0.086 mM, B = 0.043 s− 1, C = 0.363 mM, and D = 0.0025 s− 1 (gadomelitol).
A total of 46 A-07 tumors were subjected to DCE-MRI and measurement of IFP. Gd-DTPA, P846, and gadomelitol were used as contrast agent in 14, 16, and 16 tumors, respectively. IFP was measured immediately after the DCE-MRI was completed. The tumors differed in IFP from 1.8 to 22.2 mmHg, and there was no correlation between IFP and tumor volume (data not shown).
DCE-MRI data of six representative tumors are presented in , which shows the Ktrans image, Ktrans frequency distribution, ve image, and ve frequency distribution of a tumor with low IFP and a tumor with high IFP imaged with Gd-DTPA (), P846 (), or gadomelitol (). The intratumor heterogeneity in Ktrans and ve was substantial for all contrast agents. By examining a large number of individual voxels, it was verified that the pharmacokinetic model gave good fits to the experimental data in the majority of the voxels. The only exception was voxels showing high contrast enhancement after administration of P846. In these voxels, the fits were poor for times beyond the curve peak, possibly because the washout of P846 was hampered. Representative data are presented in , which shows plots of contrast agent concentration versus time and the corresponding curve fits for individual voxels differing substantially in contrast enhancement after administration of Gd-DTPA (), P846 (), or gadomelitol ().
Figure 2. The Ktrans image, Ktrans frequency distribution, ve image, and ve frequency distribution of an A-07 tumor with low IFP (left) and an A-07 tumor with high IFP (right) imaged with Gd-DTPA (a), P846 (b), or gadomelitol (c).
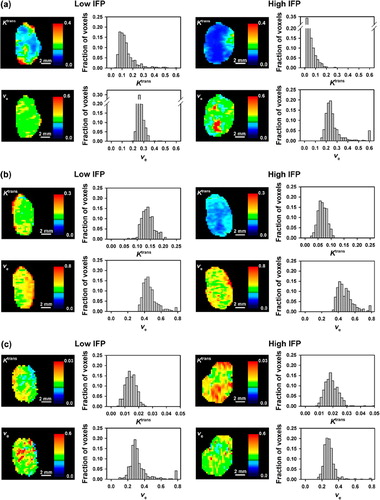
Figure 3. Contrast agent concentration versus time for individual voxels in A-07 tumors imaged with Gd-DTPA (a), P846 (b), or gadomelitol (c). The points refer to measured values, and the curves represent the best fits obtained with the Tofts iso-directional pharmacokinetic model. Data for voxels with high, intermediate, and low contrast enhancement are shown in red, green, and blue, respectively.
Median Ktrans of the individual tumors ranged from 0.034 min− 1 to 0.210 min− 1 (Gd-DTPA), from 0.038 min− 1 to 0.185 min− 1 (P846), and from 0.012 min− 1 to 0.019 min− 1 (gadomelitol), and median ve of the individual tumors ranged from 0.18 to 0.27 (Gd-DTPA), from 0.37 to 0.68 (P846), and from 0.13 to 0.26 (gadomelitol). Median Ktrans decreased with increasing IFP, both for Gd-DTPA (p = 0.0076; R2 = 0.46; ) and P846 (p = 0.0042; R2 = 0.45; ), whereas there was no correlation between median Ktrans and IFP for gadomelitol (p > 0.05; ). Significant correlation between median ve and IFP was not found for any of the contrast agents (p > 0.05; ).
Figure 4. Median Ktrans (left) and median ve (right) versus IFP for A-07 tumors imaged with Gd-DTPA (a), P846 (b), or gadomelitol (c). The points represent individual tumors, and the solid curves were fitted to the data by linear regression analysis. The dashed curves represent the 95% confidence intervals.
Because the curve fits to the data acquired with P846 were poor towards the end of the sampling period for voxels showing high signal enhancements, the P846 data were also analyzed by shortening the total sampling time (i.e. by excluding data recorded beyond given threshold times). Significant correlations between median Ktrans and IFP were found independent of the sampling period. This is illustrated in , which shows plots of median Ktrans versus IFP for sampling times of ∼4 minutes (p = 0.0025; R2 = 0.49; ), ∼7 minutes (p = 0.0024; R2 = 0.49; ), and ∼10 minutes (p = 0.0022; R2 = 0.50; ). Although the numerical values of median Ktrans increased slightly with decreasing sampling period, the correlations with IFP were similar to that shown in for a sampling period of ∼13 minutes. Significant correlations between ve and IFP were not found for the shortened sampling times either (data not shown).
Figure 5. Median Ktrans versus IFP for A-07 tumors imaged with P846 for ∼4 min (a), ∼7 min (b), or ∼10 min (c). The points represent individual tumors, and the solid curves were fitted to the data by linear regression analysis. The dashed curves represent the 95% confidence intervals.
Discussion
Clinical investigations have suggested that DCE-MRI may be a useful non-invasive imaging method for assessing the IFP of tumors [Citation11]. The influence of the molecular weight of the MR contrast agent on any relationship between DCE-MRI data and IFP was studied in the present work by using A-07 human melanoma xenografts as experimental tumor models. Orthotopic tumors with volumes of 100–600 mm3 were subjected to DCE-MRI and measurement of IFP, and parametric images derived by pharmacokinetic analysis of the DCE-MRI data were related to the IFP of the tumors. This volume range was chosen to ensure that the individual tumors differed substantially in IFP. Furthermore, orthotopic A-07 tumors within this volume range do not show regions with necrotic tissue [Citation20]. It is advantageous to use tumors without necrosis in DCE-MRI studies because pharmacokinetic models of the uptake and washout of contrast agents are not valid in necrotic tumor regions [Citation12]. A-07 tumors should therefore be adequate models for studying the questions addressed in the work reported here.
The three contrast agents were evaluated in different cohorts of tumor-bearing mice. Sequential administration of all three agents to all animals would have allowed a more direct comparison of Gd-DTPA, P846, and gadomelitol. However, our experimental strategy was chosen to avoid erronous signal enhancement after the second and third contrast administration caused by the preceding administration, as described by Garcia-Martin et al. [Citation24]. Moreover, consecutive administration of three contrast agents at relevant time intervals requires additional doses of anesthesia and a relatively large total intravenous injection volume, requirements which may cause significant hemodynamic effects in mice. The latter problem may be reduced or eliminated by studying tumors in larger animals, as demonstrated by Michoux et al. [Citation25] in a study of hepatocellular carcinomas in rats and by Henderson et al. [Citation13] in a study of spontaneous canine tumors.
The DCE-MRI data were analyzed by using the modified Kety model of Tofts et al. [Citation19]. This iso-directional pharmacokinetic model gave good fits to the DCE-MRI data acquired with Gd-DTPA and gadomelitol as contrast agents. Good curve fits were also obtained for the data acquired with P846 for voxels showing low signal enhancements. On the other hand, the P846 data for voxels with large signal enhancements were not equally well fitted by the model, particularly the data acquired towards the end of the sampling period. Calculated values for both Ktrans and ve may be influenced significantly by the quality of the curve fit. Ktrans is determined primarily by the initial part of contrast agent concentration versus time curves, whereas ve is particularly sensitive to the shape of the curves at time points beyond the curve peak [Citation12,Citation26]. Thus, the Ktrans values for P846 changed only slightly when the data recorded beyond given threshold times were excluded from the pharmacokinetic analysis, and significant correlations were found between median Ktrans and IFP independent of whether the total sampling period was ∼4 minutes, ∼7 minutes, ∼10 minutes, or ∼13 minutes. This observation is consistent with the suggestion that useful Ktrans values can be obtained for tumors by using sampling times down to ∼4 minutes, whereas reliable ve values require good curve fits for longer observation periods [Citation27].
Ktrans values for low-molecular-weight contrast agents produced by the Tofts pharmacokinetic model are determined primarily by the blood perfusion of the imaged tissue, provided that the tissue has highly permeable vessels and the amount of intravascular contrast agent is negligible [Citation19,Citation28]. These conditions are fulfilled for A-07 tumors because these tumors have a low blood volume fraction of ∼3%, and the walls of the tumor vessels have been shown to be highly permeable to low-molecular-weight blood flow tracers [Citation29]. Moreover, comparative experimental studies have verified that Ktrans for Gd-DTPA is a representative parameter for blood perfusion in A-07 tumors [Citation17].
With increasing molecular weight of the contrast agent, Ktrans becomes increasingly more influenced by the vessel wall permeability of the imaged tissue [Citation19]. In our study, the Ktrans values for gadomelitol were lower than those for Gd-DTPA and P846 by a factor of ∼10, implying that the uptake of gadomelitol was hampered by the vessel walls and, hence, that Ktrans for gadomelitol is influenced significantly by the vessel wall permeability in A-07 tumors.
IFP differs among tumors primarily because of differences in resistance to blood flow and resistance to transcapillary fluid flow [Citation10]. Significant inverse correlations were found between Ktrans and IFP for Gd-DTPA and P846, whereas no correlation was found between Ktrans and IFP for gadomelitol, suggesting that the differences in IFP among A-07 tumors were primarily a consequence of differences in resistance to blood perfusion rather than differences in resistance to transcapillary fluid flow.
The ve values of tumors are determined primarily by the fractional distribution volume of the contrast agent [Citation12,Citation19]. There is some evidence that the IFP of tumors may be influenced significantly by the hydraulic conductivity in the interstitial space [Citation1,Citation2]. The distribution volume of molecules and the interstitial hydraulic conductivity in tumor tissues are parameters that are influenced significantly by the tumor cell density and thus are expected to be interrelated. Significant correlations between ve and IFP were not found for any of the contrast agents included in the present study, suggesting that the intertumor heterogeneity in IFP in A-07 tumors was not influenced significantly by any intertumor heterogeneity in interstitial hydraulic conductivity or cell density.
The present study confirmed our previous observation that Ktrans images, but not ve images, may have the potential to provide information on the IFP of tumors [Citation18]. It suggests further that low-molecular-weight contrast agents like Gd-DTPA and P846 are preferable to contrast agents with higher molecular weights like gadomelitol. However, xenografted tumors of only one line were included in the present study, and the tumors of this line have low resistance to transcapillary fluid flow. Consequently, it cannot be excluded that studies of tumors with low vessel wall permeability may give rise to conclusions differing from those reported here.
However, the observations reported here are consistent with those reported by Haider et al. [Citation11]. They studied patients with cervical cancer and observed that Ktrans for Gd-DTPA was inversely correlated to IFP, whereas they found no correlation between ve for Gd-DTPA and IFP. Interestingly, the blood vessels of cervical carcinomas are embedded in connective tissue and are expected to be less permeable to fluid and macromolecules than are the vessels of A-07 tumors [Citation30].
In summary, studies of A-07 tumors suggest that Ktrans for low-molecular-weight contrast agents like Gd-DTPA (molecular weight of 0.55 kDa) and P846 (molecular weight of 3.5 kDa) may be associated with tumor IFP. Any association between Ktrans and IFP cannot be expected to be strengthened by the use of contrast agents with higher molecular weights. However, further studies involving tumors with biological characteristics differing substantially from those of A-07 tumors are warranted before a final conclusion should be drawn.
Acknowledgements
Financial support was received from the Norwegian Cancer Society and the South-Eastern Norway Regional Health Authority.
Declaration of interest: The authors report no conflicts of interest. The authors alone are responsible for the content and writing of the paper.
References
- Lunt SJ, Fyles A, Hill RP, Milosevic M. Interstitial fluid pressure in tumors: Therapeutic barrier and biomarker of angiogenesis. Future Oncol 2008;4:793–802.
- Heldin CH, Rubin K, Pietras K, Östman A. High interstitial fluid pressure―an obstacle in cancer therapy. Nat Rev Cancer 2004;4:806–13.
- Rofstad EK, Gaustad JV, Brurberg KG, Mathiesen B, Galappathi K, Simonsen TG. Radiocurability is associated with interstitial fluid pressure in human tumor xenografts. Neoplasia 2009;11:1243–51.
- Rofstad EK, Ruud EBM, Mathiesen B, Galappathi K. Associations between radiocurability and interstitial fluid pressure in human tumor xenografts without hypoxic tissue. Clin Cancer Res 2010;16:936–45.
- Rofstad EK, Tunheim SH, Mathiesen B, Graff BA, Halsør EF, Nilsen K, . Pulmonary and lymph node metastasis is associated with primary tumor interstitial fluid pressure in human melanoma xenografts. Cancer Res 2002;62:661–4.
- Milosevic M, Fyles A, Hedley D, Pintilie M, Levin W, Manchul L, . Interstitial fluid pressure predicts survival in patients with cervix cancer independent of clinical prognostic factors and tumor oxygen measurements. Cancer Res 2001;61:6400–5.
- Fyles A, Milosevic M, Pintilie M, Syed A, Levin W, Manchul L, . Long-term performance of interstitial fluid pressure and hypoxia as prognostic factors in cervix cancer. Radiother Oncol 2006;80:132–7.
- Yeo SG, Kim JS, Cho MJ, Kim KH, Kim JS. Interstitial fluid pressure as a prognostic factor in cervical cancer following radiation therapy. Clin Cancer Res 2009;15:6201–7.
- Jain RK. Delivery of molecular medicine to solid tumors. Science 1996;271:1079–80.
- Milosevic M, Fyles A, Hill RP. The relationship between elevated interstitial fluid pressure and blood flow in tumors: A bioengineering analysis. Int J Radiat Oncol Biol Phys 1999;43:1111–23.
- Haider MA, Sitartchouk I, Roberts TPL, Fyles A, Hashmi AT, Milosevic M. Correlations between dynamic contrast-enhanced magnetic resonance imaging-derived measures of tumor microvasculature and interstitial fluid pressure in patients with cervical cancer. J Magn Reson Imaging 2007;25:153–9.
- Yankeelov TE, Gore JC. Dynamic contrast enhanced magnetic resonance imaging in oncology: Theory, data acquisition, analysis, and examples. Curr Med Imaging Rev 2009;3:91–107.
- Henderson E, Sykes J, Drost D, Weinmann HJ, Rutt BK, Lee TY. Simultaneous MRI measurement of blood flow, blood volume, and capillary permeability in mammary tumors using two different contrast agents. J Magn Reson Imaging 2000;12:991–1003.
- de Lussanet QG, Langereis S, Beets-Tan RGH, van Genderen MHP, Griffioen AW, van Engelshoven JMA, . Dynamic contrast-enhanced MR imaging kinetic parameters and molecular weight of dendritic contrast agents in tumor angiogenesis in mice. Radiology 2005;235: 65–72.
- Donaldson SB, Betts G, Bonington SC, Homer JJ, Slevin NJ, Kershaw LE, . Perfusion estimated with rapid dynamic contrast-enhanced magnetic resonance imaging correlates inversely with vascular endothelial growth factor expression and pimonidazole staining in head-and-neck cancer: A pilot study. Int J Radiat Oncol Biol Phys 2011;81:1176–83.
- Benjaminsen IC, Graff BA, Brurberg KG, Rofstad EK. Assessment of tumor blood perfusion by high-resolution DCE-MRI: A preclinical study of human melanoma xenografts. Magn Reson Med 2004;52:269–76.
- Egeland TAM, Simonsen TG, Gaustad JV, Gulliksrud K, Ellingsen C, Rofstad EK. Dynamic contrast-enhanced magnetic resonance imaging of tumors: Preclinical validation of parametric images. Radiat Res 2009;172:339–47.
- Gulliksrud K, Brurberg KG, Rofstad EK. Dynamic contrast-enhanced magnetic resonance imaging of tumor interstitial fluid pressure. Radiother Oncol 2009;91:107–13.
- Tofts PS, Brix G, Buckley DL, Evelhoch JL, Henderson E, Knopp MV, . Estimating kinetic parameters from dynamic contrast-enhanced T1-weighted MRI of a diffusable tracer: Standardized quantities and symbols. J Magn Reson Imaging 1999;10:223–32.
- Rofstad EK. Orthotopic human melanoma xenograft model systems for studies of tumour angiogenesis, pathophysiology, treatment sensitivity and metastatic pattern. Br J Cancer 1994;70:804–12.
- Delrue LJ, Casneuf V, Van Damme N, Blanckaert P, Peeters M, Ceelen WP, . Assessment of neovascular permeability in a pancreatic tumor model using dynamic contrast-enhanced (DCE) MRI with contrast agents of different molecular weights. Magn Reson Mater Phys 2011;24:225–32.
- Hittmair K, Gomiscek G, Langenberger K, Recht M, Imhof H, Kramer J. Method for the quantitative assessment of contrast agent uptake in dynamic contrast-enhanced MRI. Magn Reson Med 1994;31:567–71.
- Ozerdem U, Hargens AR. A simple method for measuring interstitial fluid pressure in cancer tissues. Microvasc Res 2005;70:116–20.
- Garcia-Martin ML, Martinez GV, Raghunand N, Sherry AD, Zhang S, Gillies RJ. High resolution pHe imaging of rat glioma using pH-dependent relaxivity. Magn Reson Med 2006;55:309–15.
- Michoux N, Huwart L, Abarca-Quinones J, Dorvillius M, Annet L, Peeters F, . Transvascular and interstitial transport in rat hepatocellular carcinomas: Dynamic contrast-enhanced MRI assessment with low- and high-molecular weight agents. J Magn Reson Imaging 2008;28:906–14.
- Cao Y, Li D, Shen Z, Normolle D. Sensitivity of quantitative metrics derived from DCE MRI and a pharmacokinetic model to image quality and acquisition parameters. Acad Radiol 2010;17:468–78.
- Ewing JR, Brown SL, Lu M, Panda S, Ding G, Knight RA, . Model selection in magnetic resonance imaging measurements of vascular permeability: Gadomer in a 9L model of rat cerebral tumor. J Cereb Blood Flow Metab 2006;26:310–20.
- Sourbron SP, Buckley DL. On the scope and interpretation of the Tofts models for DCE-MRI. Magn Reson Med 2011;66:735–45.
- Graff BA, Benjaminsen IC, Brurberg KG, Ruud EBM, Rofstad EK. Comparison of tumor blood perfusion assessed by dynamic contrast-enhanced MRI with tumor blood supply assessed by invasive imaging. J Magn Reson Imaging 2005;21:272–81.
- Ellingsen C, Øvrebø KM, Galappathi K, Mathiesen B, Rofstad EK. The pO2 fluctuation pattern and cycling hypoxia in human cervical carcinoma and melanoma xenografts. Int J Radiat Oncol Biol Phys 2012;83:1317–23.