Abstract
Oblique-viewing endoscopes (oblique scopes) are widely used in computer assisted surgeries. The viewing direction of an oblique scope can be changed by rotating the scope cylinder; this extends the field of view, but also makes the geometric calibration process more difficult. Although few calibration methods have yet been developed, calibration is critical for the application of augmented-reality technologies such as stereo vision to procedures involving oblique scopes. Moreover, to our knowledge, no photometric calibration method has yet been introduced for endoscopes, even though such calibration is important for illumination-based visualization techniques such as shape-from-shading. In this paper, we present a complete calibration process for oblique-viewing endoscopes, estimating both geometric and photometric properties. Experimental results demonstrate that our methods are practical and accurate.
Introduction
One of the main goals of computer assisted orthopedic surgery is to enable true minimally invasive surgery (MIS). As a key MIS tool, the endoscope is attracting increasing attention for its potential role in computer assisted surgery, especially in conjunction with a surgical navigation system. By tracking the endoscope in space using a position localizer, its role can be significantly augmented. For example, it can be used to create MIS augmented-reality systems, to merge virtual and real endoscopic images Citation[1], to overlay real endoscopic images with 3D surfaces derived from CT images Citation[2], or to recover the 3D shape from a single endoscopic image Citation[3], Citation[4] or multiple images Citation[5–7].
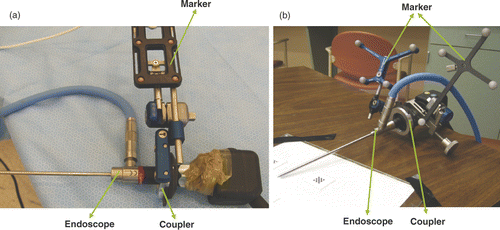
Geometric calibration of the camera, an important step in endoscope-related applications and mostly based on Tsai's model Citation[8], has been addressed in several publications Citation[2], Citation[9–11]. However, with the exception of that by Yamaguchi et al. Citation[11], most of these reports concern the forward-viewing endoscope, in which the viewing direction is aligned with the axis of the scope. The range of movement of such a tool is constrained by the small incision, so the field of view is very small. To provide a sideways view, the oblique scope has been designed with a tilted viewing direction, and a wider viewing field can be obtained by rotating the scope cylinder. illustrates an oblique-viewing endoscope. Rotation occurs between the scope cylinder and the camera head. Yamaguchi et al. first modeled and calibrated the oblique scope Citation[11], Citation[12]. They formulated the rotation parameter of the scope cylinder as another external parameter in Tsai's camera model, and used two extra transformations to compensate for the rotation θ of the lens system and stillness of the camera head. While their camera model successfully compensates for the rotation effect, the method requires five additional parameters and the model is complicated. In this paper we propose an alternative approach to simplify the calibration in which an optical marker is attached to the scope cylinder, instead of to the camera head, with a newly designed coupler (as shown in ). As a result, our camera model is simpler and we only need to estimate one additional parameter.
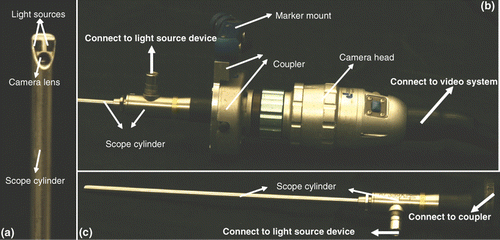
Figure 1. Stryker 344-71 arthroscope Vista (70 degree, 4 mm). An oblique endoscope consists of a scope cylinder with a lens and point light sources at the tip (which is tilted at an angle from the scope cylinder axis), a camera head that captures video images, and a light source device that supports the illumination. The scope cylinder is connected to the camera head via a coupler. This connection is flexible to enable rotation of the scope cylinder and camera head separately or together.
Photometric calibration of the camera, another important process in illumination-related applications, is performed to find the relationship between the image irradiance and image intensity for the camera. This relationship is called the camera response function. Traditional photometric calibration recovers the camera response function by changing the camera's exposure time. Compared with regular cameras, it is hard to control the exposure time for an endoscope, and the light spatial distribution can be anisotropic. We have therefore developed a method to calibrate all of these unknown parameters simultaneously.
Geometric calibration
The common orthopedic endoscope has a single camera and one or more point light sources at the tip of the scope. For this work, we used two oblique endoscopes as examples (shown in and ).
Model for oblique-viewing endoscope
The camera model of Yamaguchi et al. is based on that of Tsai Citation[8], Citation[9]:where Pw is a 3D point in the world coordinate system, pi is the corresponding 2D image pixel, mTw is a rigid transformation from the world coordinates to the optical marker coordinates, and cTm(θ) is a rigid transformation from the marker (camera head) to the camera coordinates. cTm(θ) is dependent on the rotation angle θ. By considering the marker coordinates (camera head) as a reference, only the lens system rotates while the camera head, i.e., the image plane, remains fixed irrespective of the rotation. Yamaguchi et al. Citation[11], Citation[12] describe such a transformation due to the rotation by decomposing the single physical rotation into two mathematical rotations: TR(θ; ls) is a rotation of both the scope cylinder and the camera head (image plane) around the axis of the cylinder ls; TR(−θ; lh(θ)) is an inverse rotation of the image plane around the z-axis of the lens system lh. Both ls and lh have two unknown parameters. Although this model works well, it is very complicated.
shows the geometric model modified from that of Yamaguchi et al. by attaching an optical marker to the scope cylinder instead of to the camera head.where Pw is a 3D point in the world coordinates,
is the corresponding 2D image pixel without rotation, pi is the image pixel with rotation θ, mTw is a rigid transformation from the world coordinates to the optical marker coordinates, cTm is a rigid transformation from the marker (scope cylinder) to the camera coordinates and independent of θ, cc is the principal point which is an intrinsic parameter, and R(θ) represents a rotation of the image plane around cc by θ. Thus, the camera intrinsic matrix A and external matrix cTm can be calibrated by using Zhang's method Citation[9] and mTw can be obtained directly from the tracking system. In our model we only need to estimate the rotation angle.
Figure 2. The geometric model of an endoscope based on a tracking system. A new coupler (see ) has been designed to enable mounting of an optical marker on the scope cylinder, ensuring that the transformation from the scope (marker) coordinates O2 to the lens system (camera) coordinates O3 is fixed. The optical tracker defines the world coordinates O1. Two optical markers are attached to the coupler and camera head separately to compute the rotation θ between them.
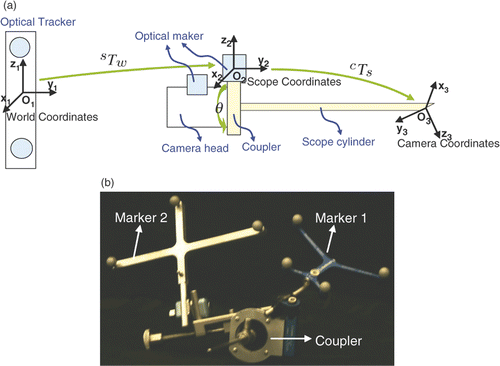
The rotation angle can be estimated by using a rotary encoder, as done by Yamaguchi et al. Citation[12]. When this is absent, the rotation angle can be estimated by using two optical markers; one attached to the scope cylinder and the other mounted on the rod (the camera head).
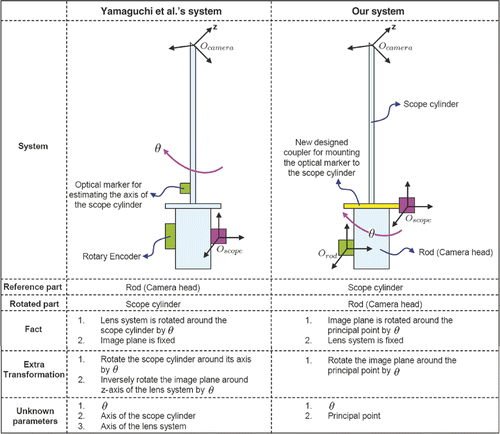
A comparison between our model and that of Yamaguchi et al. is presented in . Yamaguchi et al. used the camera head as a reference coordinate in their hand-eye calibration system. As surgeons rotate the scope cylinder with respect to the camera head in order to obtain a sideways view, it is natural to consider the camera head as a reference. However, this makes the camera model very complex. To approach this from the opposite direction, no matter how the surgeons rotate the scope cylinder, if the reference coordinate is on the cylinder itself, the lens system is fixed with respect to the cylinder but the camera head rotates around θ. Thus, the external parameters are no longer affected by the rotation. Since the image plane is in the camera head, the rotation only affects the image plane. Our method is therefore developed based on the above observations. The model of Yamaguchi et al. requires five more parameters, whereas we only need one. Likewise, their method uses two optical markers and one rotary encoder, whereas our method only requires two optical markers.
Figure 3. A comparison between the system of Yamaguchi et al. and our own system. In the former, the camera head is tracked such that the transformation from the marker to the lens system is not fixed but depends on the rotation angle θ. Using the marker coordinates as a reference, the lens system is rotated around the scope cylinder through θ, but the image plane (that is in the camera head) remains the same. Yamaguchi et al. use two additional transformations to describe the effect of rotation, so their model becomes complicated. Moreover, they must calibrate the axis of both the scope cylinder and the lens system by using another optical marker attached to the scope cylinder. Based on our observation, it is possible to simplify the model if we fix the transformation between the marker and the lens system. We designed a coupler that enables the optical marker to be mounted on the scope cylinder. We then set the marker coordinates as a reference; the lens system remains fixed. The rotation only affects the image plane since the camera head is rotated around the cylinder (reference), and the image plane only rotates around the principal point. Since the principal point is an intrinsic parameter, we need only estimate the rotation angle. As a result, we have a very simple model (see details in the text).
Estimation of rotation angle using two optical markers
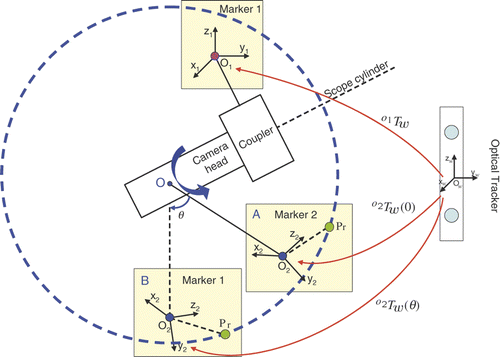
Let the marker attached to the scope cylinder be Marker 1 and that attached to the rod (camera head) be Marker 2 (). As shown in , when we rotate the camera head around the scope cylinder by θ, point Pr in Marker 2's coordinates O2 will move along a circle with respect to a point O on the axis of the scope cylinder, in Marker 1's coordinates O1. Thus, we can estimate the center O of the circle first and compute θ aswhere A is the position of O2 when θ = 0 and B is the position of O2 given a rotation θ. The center of the circle can be represented in terms of the transformation from the world coordinates Ow to Marker 1's coordinates O1 and Marker 2's coordinates O2, and at least 3 different positions of Marker 2 (O2) (with different values of θ) are necessary.
Figure 4. Relationship between the rotation angle θ and two marker coordinates. O1 is attached to the scope cylinder and O2 is attached to the camera head. A indicates the position of O2 when θ = 0 and B indicates the position of O2 given a rotation θ. Given any point Pr in O2, its trace following the rotation of the camera head is a circle in Marker 1's coordinates O1. It moves from position to
in Marker 1's coordinates O1. This circle is also on the plane perpendicular to the axis of the scope cylinder. O is the center of the circle.
Estimation of the center of circle in 3D
We rotate the camera head around the cylinder to acquire 3 different positions of Marker 2. Let the transformation matrix from the world coordinates Ow to both Marker 1's coordinates O1 and Marker 2's coordinates O2 for position i be (,
) (i = 1, 2, 3). Given any point
in O2, we first compute the position
in O1 corresponding to different rotations as follows:
Therefore, O is the center of the circumcircle of the triangle (
,
and
).
If ,
, the normal of the triangle is
. The perpendicular bisector
of
and
of
can be computed as follows:
where λ1 and λ2 are parameters of the line
and
. The intersection of these two lines is the center of the circle. From Equation 5 we can derive the center of the circle as follows:
It can easily be proven that O does not depend on the selection of . Since at least 3 different positions are necessary, we rotate the camera head around the scope cylinder by N different angles. We then apply a RANSAC algorithm to estimate
using random positions, and select the
which corresponds to the smallest variance as the center of the circle. The pseudo code of RANSAC is listed in . It can be also proven that θ does not depend on the selection of Pr either. A similar RANSAC algorithm as shown in is then used to compute θ. shows the estimated rotation angle using the RANSAC algorithm for two different endoscopes. The red curves represent the output angles from different RANSAC iterations, and the black curve is the average angle. As can be seen, the variance of the estimation is very small (less than 0.2 degrees).
Figure 5. Estimated rotation angles for the two endoscopes. In each trial we rotated the camera head with respect to the scope cylinder and captured an image. We captured a few images for the initial position, then acquired two images for each rotation angle. The red curves are the estimated rotation angles from different RANSAC iterations; the black curve is the average rotation angle.
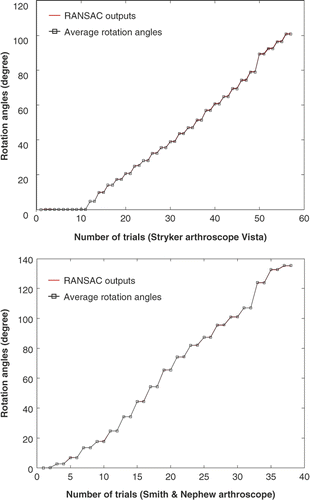
Table I. Pseudo code of RANSAC for estimating the center of the circle
Table II. Pseudo code of RANSAC for estimating the rotation angle
Experimental results
We tested our algorithm using two different systems. The first test was conducted in our laboratory, using a Stryker 344-71 arthroscope Vista (70 degree, 4 mm) oblique-viewing endoscope, a DYONICS DyoCamTM 750 video camera, a DYONICS DyoBrite 3000 light source, and a Polaris optical tracker (Northern Digital Inc., Waterloo, Ontario, Canada). Next, we tested the algorithm in conjunction with our standard operating room equipment: a Smith & Nephew SN-OH 272589 video arthroscope (autoclavable; 30 degree, 4 mm), a DYONICS video camera and light source, and an OPTOTRAK optical tracker (Northern Digital Inc.). shows the different endoscopes and optical trackers used.
Figure 6. The endoscopes used in the experiments. (a) Smith & Nephew video arthroscope–autoclavable SN-OH 272589 (30 degree, 4 mm). (b) Stryker 344-71 arthroscope Vista (70 degree, 4 mm).
The endoscope was first fixed in place and the calibration pattern was rotated on the table to enable the capture of images. A set of images were captured without any rotation between the scope cylinder and camera head. These were used to estimate both the intrinsic matrix A (including focal length and radial distortion coefficients) and the extrinsic matrix cTm using Zhang's method Citation[9] (implemented using OpenCV functions). Another set of images were captured when there was rotation between the camera head and the scope cylinder, and the center of the circle could be computed using Equation 6. Next, we fixed the calibration pattern, with two optical markers attached to the scope cylinder and the camera head, and captured a set of images by applying general motions of the endoscope (moving the whole scope body or rotating the camera head with respect to the scope cylinder [better described as rotating the scope cylinder with respect to the camera head]). This set of images was used to estimate the rotation angles. The initial position of the camera head was considered as the reference position A seen in . illustrates the back projection of the 3D corners of the calibration pattern with (blue) and without (red) any rotation compensation. The green points are the ground truth. For each rotation angle of the endoscope, we computed the average back-projection error for this angle as follows:where Pi is a 3D point in the world coordinates, pi is the corresponding 2D image pixel, p(Pi, θ) is the back-projected 2D image pixel of Pi, and M is the number of corners on the calibration pattern. We used different grid patterns (3 × 4 as shown in , 4 × 5 and 5 × 6; the size of each check is 2 mm × 2 mm). In order to obtain enough light on the grid pattern, the endoscope must be placed very close to the target (usually at a distance of 5–15 mm). The smaller grid could not capture the radial distortion, but the bigger grid exceeded the field of view. The 5×6 grid gave the best results.
Figure 7. (a) The back projection with and without rotation compensation. The green points are the ground truth–2D corner pixels on the image of the calibration pattern. The red points are the back projection of the 3D world positions of the corners using the first equation of Equation 2, which has no rotation compensation. The blue points are the back projection using both equations of Equation 2. Since the rotation is included in the camera model, the back-projected pixels are much closer to the ground truth than the red points. (b) An image used in the paper by Yamaguchi et al. Citation[11], Citation[12]. This image has higher resolution, better lighting and less distortion than our own.
![Figure 7. (a) The back projection with and without rotation compensation. The green points are the ground truth–2D corner pixels on the image of the calibration pattern. The red points are the back projection of the 3D world positions of the corners using the first equation of Equation 2, which has no rotation compensation. The blue points are the back projection using both equations of Equation 2. Since the rotation is included in the camera model, the back-projected pixels are much closer to the ground truth than the red points. (b) An image used in the paper by Yamaguchi et al. Citation[11], Citation[12]. This image has higher resolution, better lighting and less distortion than our own.](/cms/asset/fbf83dc1-7414-48a0-b411-4bc5faf1ad8d/icsu_a_472397_f0007_b.gif)
Finally, we conducted many trials by moving and rotating the endoscope randomly and estimating θ simultaneously. The average back-projection error with respect to the different rotation angles is shown in . is the result obtained using the Stryker 344-71 arthroscope Vista (70 degree, 4 mm) and the Polaris optical tracker. is the result obtained using the Smith & Nephew SN-OH 272589 video arthroscope (30 degree, 4 mm) and OPTOTRAK optical tracker. The red curve represents the back-projection error without taking into account the rotation angle, and the blue curve shows the error considering the rotation angle. The results indicate that including the rotation angle in the camera model significantly improves the accuracy of the calibration.
Figure 8. Back-projection errors with respect to the rotation angles for the two systems. (a) Stryker 344-71 arthroscope Vista and Polaris optical tracker in our laboratory. (b) Smith & Nephew video arthroscope and OPTOTRAK optical tracker in the operating room. The three images above the graphs correspond to different rotation angles (specified above each image). The red curves represent the errors without rotation compensation; the blue curves are errors with rotation compensation.
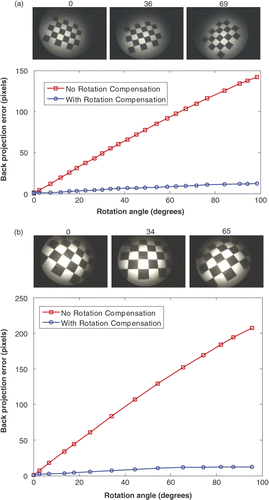
shows that different endoscopes have different accuracy. The reason for this is that endoscopes have different magnifications and optical trackers have differing accuracies (according to the manufacturer, the RMS error is 0.1 mm for OPTOTRAK and 0.3 mm for Polaris). Yamaguchi et al. Citation[11], Citation[12] used an OTV-S5C laparoscope (Olympus Optical Co. Ltd., Tokyo, Japan) and Polaris optical tracker. They achieved a high accuracy of less than 5 mm back-projection error when the rotation angle was within 140 degrees. Our results show that we can achieve the same level of accuracy when the rotation angle is within 75 degrees. Beyond this range, due to the greater magnification, larger radial distortion and poorer lighting (a comparison between images used in our experiment and those of Yamaguchi et al. is shown in ), the back-projection error is increased to 13 mm when the rotation angle is 100 degrees. Given endoscopes of the same quality, we should be able to achieve the same level of accuracy.
Photometric calibration
To our knowledge, photometric calibration for the endoscope has not been investigated in the literature. In this paper we propose a method for computing the camera response function, light source intensity and light spatial distribution function simultaneously, inspired by the work of Litvinov and Schechner Citation[13].
Reflectance model under near-field lighting and projective projection
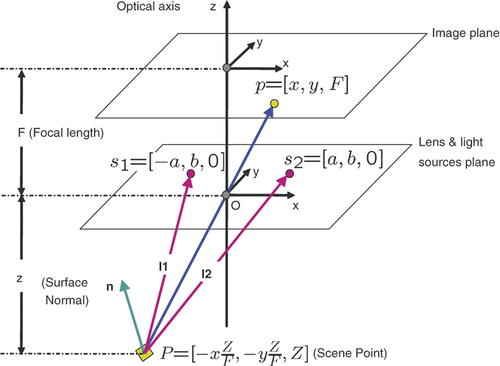
Assuming the bone surface is Lambertian, the scene radiance can be computed according to Lambertian cosine law as follows:where G0 is the intensity of two light sources s1 and s2, ρ is the surface albedo, n is the surface normal, l1 and l2 are two light rays arriving at the surface, and r1 and r2 are the distances from each light source to the surface. (x, y, z) indicates the 3D location of the scene point P (see ).
Figure 9. The perspective projection model for an endoscope imaging system with two near point light sources: O is the camera projection center; s1 and s2 indicate two light sources. We assume the plane consisting of O, s1 and s2 is parallel to the image plane. The coordinate system is centered at O and Z is parallel to the optical axis and pointing toward the image plane. X and Y are parallel to the image plane, F is the focal length, and a and b are two parameters related to the position of the light sources. Given a scene point P, the corresponding image pixel is p. Assuming a Lambertian surface, the surface illumination thus depends on the surface albedo, light source intensity and fall-off, and the angle between the normal and light rays.
On the other hand, the image irradiance E can be estimated from the image intensity v given the camera response function H(·):where M(x, y) is the spatial distribution of the source intensity that is assumed to be equal for both light sources. Assuming there is no loss of energy when light rays propagate from the scene to the camera lens, the radiance remains the same and thus R = E. Combining Equations 8 and 9, we have
For calibration, we use a Macbeth color chart with known albedo for each patch. We capture a set of images by varying light-source intensity for each patch. We apply log to both sides of Equation 10 to obtain a linear system of equations:where i indicates the different albedos and j indexes the light intensity.
, pi = log(ρi), gj = log(E0j) and
. The unknowns (h(·), gj,
) can be obtained by solving this linear system of equations. The term M(x, y) is then estimated from
by measuring the distance to the chart from the scope tip. An image of a square patch with uniform albedo is captured and distortion is then removed. We measure the distance between the scope tip and four corners, and then compute the term
for each image pixel. Finally, M(x, y) is estimated by removing the above term from
.
Solution to h(·)
Given the same light intensity gj and pixel value v(x, y) but two different albedos ρi1 and ρi2, we have
Subtracting the first line from the second line of Equation 12, we obtain
We can use different pixels in the same image (albedo) or different images (albedos) to make as many equations like Equation 13 as required, as long as we fix the light intensity for each pair of albedos. Since changes from 0 to 255(image intensity), we only need 256 such equations and stack them as follows:
where 1* and −1* correspond to the columns
and
, respectively, and 1# and −1# correspond to the columns
and
, respectively. Therefore h(v) is solved from Equation 14 and H(v) = exp(h(v)).
Solution to gj
Given the same albedo pi and pixel value v(x, y) but two different light intensities gj1 and gj2, we have
We then subtract the first line from the second line of Equation 15:
We use the minimum light intensity g1 as a reference; for other light intensities gj, j = 2, …, Nlight, we have
Given the estimated h(v(x, y) and by changing the albedos and pixels, we compute the average value for each gj as follows and .
Solution to 
Again, Given the same albedo pi and light intensity gj but two different pixels, (xp, yp) and xq, yq, we have
We subtract the first line from the second line of Equation 19:
For each gj and ρi, instead of using different pairs of pixels, we choose only Npixels = 720 × 480 pairs and stack the equations thus:
It is not practical to solve Equation 21 using singular value decomposition (SVD) directly since matrix A requires a huge memory. However, we noticed that the matrix A in Equation 21 is a special Npixels by Npixels matrix such that we could get the inverse directly by using Gauss-Jordan Elimination:
Thus we successfully compute each element of independently and again,
.
Experimental results
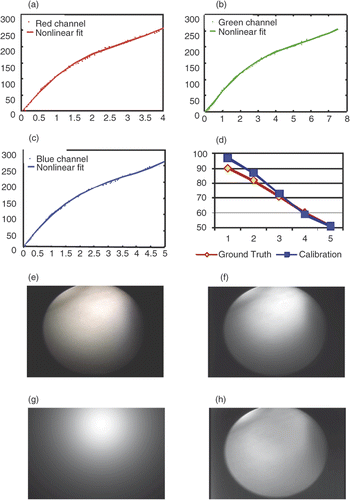
A series of color chart images are used for photometric calibration. We use 6 different levels of image intensity. show the camera response function with red/green/blue channels. shows the recovered light intensity in different levels and compared to the ground truth. Smaller values on the x-axis correspond to higher intensity. We see a bit variance when light intensity is high that may be caused by the saturation. shows the original image and 10f shows . shows the cosine term
, and 10h shows the spatial distribution function m(x, y).
Figure 10. Results of photometric calibration. (a) Camera response function in the red channel. The red dots represent the data points and the magenta line represents the nonlinear fit. (b) Camera response function in the green channel. The green dots represent the data points and the magenta line represents the nonlinear fit. (c) Camera response function in the blue channel. The blue dots represent the data points and the magenta line represents the nonlinear fit. (d) Calibrated light intensity at different levels (blue) and the ground truth (green). We use level 6 as a reference and plot levels 1-5 with a small level corresponding to high light intensity. A bit variation in range for the high intensities may be caused by saturation. (e) Original image on color chart. (f) . (g) The cosine term
. (h) The spatial distribution function m(x, y).
Discussion and conclusions
In this paper we have described the development of a full calibration process for both geometric and photometric properties of endoscopes. Our geometric calibration method simplifies previous work by using a coupler attached to the scope cylinder. It is easy to implement and practical to apply with standard operating room equipment such as the surgical navigation system. The only drawback of this method is the necessity for two markers to be visible to the optical trackers at all times.
To our knowledge, photometric calibration has not yet been applied to endoscopes by other groups. Most previous work in this field did not rely on the physical model of the endoscope light sources, or restricted the changing of light sources during the operation. Recently, shape-from-shading has been applied to endoscopic images based on a simplified light-source model without calibrating the model parameters. However, to reconstruct an accurate shape from endoscopic images, knowledge of the light sources is necessary and important.
Both geometrical and photometrical parameters are very useful for 3D visualization and reconstruction of anatomical structures such as bones. We have already applied the calibrated endoscopes to artificial reconstruction of the spine from individual endoscopic images based on a calibrated photometric model Citation[14]. With the calibrated geometric parameters of the endoscope, we were able to transfer all individual reconstructed shapes to the world coordinates and thus find the global occluding boundaries, which helped to later re-grow the shape-from-shading. The results demonstrate that calibrated endoscopes can yield very good reconstruction results, which is promising for real surgical applications.
References
- Clarkson MJ, Rueckert D, King AP, Edwards PJ, Hill DLG, Hawkes DJ, Registration of video images to tomographic images by optimising mutual information using texture mapping. In: Taylor C, Colchester A, editors. Proceedings of the Second International Conference on Medical Image Computing and Computer-Assisted Intervention (MICCAI '99), Cambridge, England, September 1999. Lecture Notes in Computer Science 1679. Berlin: Springer; 1999. pp 579–588
- Dey D, Gobbi DG, Slomka PJ, Surry KJ, Peters TM. Automatic fusion of freehand endoscopic brain images to three-dimensional surfaces: Creating stereoscopic panoramas. IEEE Trans Med Imaging 2002; 21(1)23–30
- Deguchi K, Okatani T. Shape reconstruction from an endoscope image by shape-from-shading technique for a point light source at the projection center. Proceedings of IEEE Computer Society Workshop on Mathematical Methods in Biomedical Image Analysis (MMBIA 1996). San Francisco, CA June, 1996; 290–298
- Forster CHQ, Tozzi CL. Towards 3D reconstruction of endoscope images using shape from shading. Proceedings of XIII Brazilian Symposium on Computer Graphics and Image Processing (SIBGRAPI 2000). GramadosBrazil October, 2000; 90–96
- Mourgues F, Coste-Manière E, Flexible calibration of actuated stereoscopic endoscope for overlay in robot assisted surgery. In: Dohi T, Kikinis R, editors. Proceedings of 5th International Conference on Medical Image Computing and Computer-Assisted Intervention (MICCAI 2002), Tokyo, Japan, September 2002. Part I. Lecture Notes in Computer Science 2488. Berlin: Springer; 2002. pp. 25–34
- Stoyanov D, Darzi A, Yang GZ. A practical approach towards accurate dense 3D depth recovery for robotic laparoscopic surgery. Comput Aided Surg 2005; 10(4)199–208
- Wengert C, Reeff M, Cattin PC, Székely G. Fully automatic endoscope calibration for intraoperative use. Proceedings of Bildverarbeitung für die Medizin 2006, Algorithmen, Systeme, Anwendungen, March 2006, H Handels, J Ehrhardt, A Horsch, H-P Meinzer, T Tolxdorff. Springer, Hamburg, Germany. Berlin 2006; 419–423
- Tsai RY. A versatile camera calibration technique for high-accuracy 3D machine vision metrology using off-the-shelf TV cameras and lenses. IEEE J Robotics Automation 1987; RA-3: 323–344
- Zhang Z. A flexible new technique for camera calibration. Microsoft Research MSR-TR-98-71, 1998.
- Shahidi R, Bax MR, Maurer CR, Johnson JA, Wilkinson EP, Wang B, West JB, Citardi MJ, Manwaring KH, Khadem R. Implementation, calibration and accuracy testing of an image-enhanced endoscopy system. IEEE Trans Medical Imaging 2002; 21(12)1524–1535
- Yamaguchi T, Nakamoto M, Sato Y, Nakajima Y, Konish K, Hashizume M, Nishii T, Sugano N, Yoshikawa N, Yonenobu K, Tamura S, Camera model and calibration procedure for oblique-viewing endoscope. In: Ellis RE, Peters TM, editors. Proceedings of 6th International Conference on Medical Image Computing and Computer-Assisted Intervention (MICCAI 2003), Montreal, Canada, November 2003. Part II. Lecture Notes in Computer Science 2879. Berlin: Springer; 2003. pp. 373–381
- Yamaguchi T, Nakamoto M, Sato Y, Konishi K, Hashizume M, Sugano N, Yoshikawa H, Tamura S. Development of a camera model and calibration procedure for oblique-viewing endoscopes. Comput Aided Surg 2004; 9(5)203–214
- Litvinov A, Schechner YY, Addressing radiometric nonidealities: A unified framework. In: Proceedings of IEEE Computer Society International Conference on Computer Vision and Pattern Recognition (CVPR 2005), San Diego, CA, June 2005. Vol. 2. pp. 52–59
- Wu C, Narasimhan S, Jaramaz B. A multi-image Shape-from-Shading framework for near-lighting perspective endoscopes. Int J Comput Vision 2009; 86: 211–228