
Abstract
A quantitative structure–activity relationship (QSAR) study of sulfonamide inhibitors targeting the β-carbonic anhydrase (CA, EC 4.2.1.1) from the fungus Malassezia globosa is reported. A large set of PRECLAV descriptors has been used to obtain four parametric models. This study presents QSAR data on a pool of 28 compounds. The quality of prediction is high enough (SE = 0.3446, r2 = 0.8687, F = 39.6921, Q = 0.7446). A heuristic algorithm selected the best multiple linear regression (MLR) equation which showed the correlation between the observed values and the calculated values of activity. The proposed prediction set included new, not yet synthesized, 23 molecules having various structures. Many compounds in the prediction set seem to possess higher computed activity compared to the presently available M. globosa β-CA inhibitors.
Introduction
Dandruff is a disease that has been around for centuries despite of several treatment options which are generally not very effectiveCitation1. Irritation by the scalp-dwelling fungus Malassezia globosa is the main cause of dandruff. A number of medicated shampoo and other dandruff treatments are available in the market for the cure of dandruff. Hewitson et al. showed that dandruff involves an enhanced shedding of dead skin cells from the scalp and identified an enzyme in M. globosa which is essential for the fungus’s growth. The molecular cloning, characterization and in vitro/in vivo inhibition studies of a β-carbonic anhydrase (CA, EC 4.2.1.1) from M. globosa, denominated MG-CA was reported by Hewitson et al., who also proposed inhibitors of this enzyme as an alternative for developing better antidandruff medicines and thus, a novel antidandruff targetCitation2.
The goals of this quantitative structure–activity relationship (QSAR) study are the identification of relevant descriptors, statistically significant models and molecular features (significant molecular fragments included) having largest influence on biochemical activity and the estimation of activity for some not yet synthesized molecules in prediction set. Thus, attempts have been made to design and develop potent MG-CA inhibitor for the treatment of dandruff.
Methods and materials
Calibration set
A group of molecules containing a known structure and a known value for the inhibitory activity are taken in the calibration set to develop a QSAR model. Recently, Supuran and co-workersCitation2 have reported the inhibition study against newly β-carbonic anhydrase (M. globosa fungal) MG-CA with a novel series of aromatic/heterocyclic sulfonamide derivatives. The inhibition data of investigated aromatic/heterocyclic sulfonamide compounds (1–28) are presented in and their structures are shown in . The experimental in vitro inhibition data of recombinant purified MG-CA (KI in nM) are converted in “A” by means of equation A = log(c/KI), where c is taken as to 630 000 in order to obtain a large values of “A”. The inhibitory activity value “A” of the molecules under the study which spanned a range from 1 to 4 is more suggestive.
Figure 1. Structural detail of MG-CA inhibitors (sulfonamides) used in calibration set.
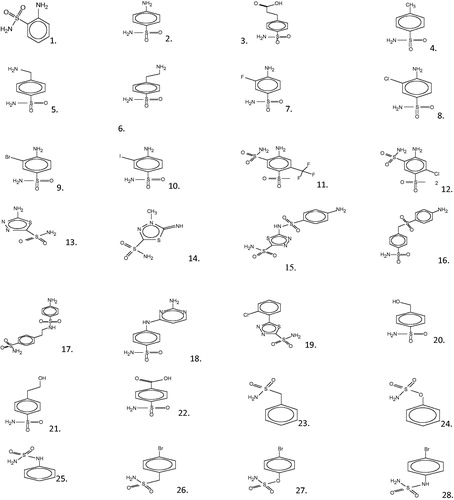
Table 1. The experimental in vitro inhibition data of MG-CA (KI in nM), observed activity A (A = log (630 000/KI), estimated activities, residual, standardized residual, |RStudent| and hat diagonal of the calibration set molecules 1–28 with predicted value (A), hat diagonal and their corresponding KI in nM of the not yet synthesized ones 29–51.
Prediction set (design of new compounds)
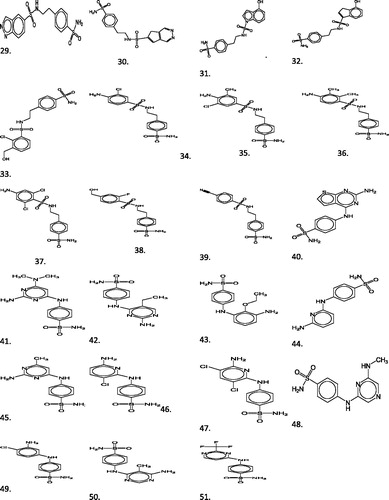
The discovery of novel bioactive molecule is the primary goal of computational drug discovery. compounds 17 and 18 of calibration set were better potent MG-CA inhibitors. The prediction set contains 23 not yet synthesized novel aromatic sulfonamide derivatives of the analog of potent MG-CA inhibitors compounds 17 and 18 shown in ; generated by BROODCitation3 software having unknown observed values of activity presented in (compounds 29–51). Brood uses the shape and attachment geometry of the query fragment to identify a family of similar fragments. The structures of the prediction set molecules (compounds 29–51) were selected mainly due to their possibility to be synthesized in laboratory conditions and taking into account the commercial availability of the raw materials.
Figure 2. Structural detail of MG-CA inhibitors (sulfonamides) used in prediction set (not yet synthesized).
Geometry optimization and calculation of descriptors
The minimum energy geometry for each of the molecule in the calibration and prediction sets was obtained by the conformational search ability of the Omega v.2.4.3Citation4–6 program. The isomeric SMILES notation was used as program input in order to avoid any influences on conformational model generation by presenting 3D seed structures. The omega employs a rule-based algorithm in the combination with variants of the MMMF 94. The force field used was the 94 s variant of the MMMF_NoEstatCitation4–6 that includes all Merck molecular force field terms except Coulomb interactions. A more rigorous geometry optimization was subsequently performed by the semi-empirical PM6 methodCitation7 included in the quantum-mechanics program MOPACCitation8. The energy minimized structure was used to calculate different molecular properties, including virtual fragmentation descriptors and whole molecule quantum chemical (global) descriptors. For each molecule over a thousand descriptors were calculated using programs such as MOPACCitation8, and PRECLAVCitation9,Citation10.
Chemometric tools
Descriptor calculation and quality of the model
Several criteria were used to reduce the descriptors, while optimizing the information content of the descriptors set. First, descriptors for which no value was available for all the compounds were disregarded. Second, descriptors of which the value is constant (or near-constant) inside each group of descriptors were excluded.
Identification of the “significant” descriptors uses specific criteriaCitation11. The “significant” descriptors are those which are sufficiently correlated with the dependent property. The variables having high enough diversity of values are considered significant only if their quality q is high enough.
(1)
where q = (1 − min r2)/(1 − r2). Here min r2 = 0.01 and r2 is the square of the Pearson linear correlation between the values of the analyzed descriptor and the values of the dependent property.
The experimental in vitro inhibition data of MG-CA in nM (after converted in “A”) were used as dependent variables in building a QSAR model. The parameters to be calculated were various descriptors that are indicative of molecular structure and used as independent variables. The PRECLAV algorithmCitation9,Citation10 was used for obtaining the parameters and for the statistical analysis as reported earlierCitation11–19. Stepwise multiple linear regression (MLR) technique was used for the QSAR model development using the entire dataset. Using only the “significant” descriptorsCitation9,Citation10 PRECLAV computes thousands of QSAR equations, i.e. multilinear formulas of the dependent property. The program combines successively sets with 2, 3, … k significant descriptors (1 < k < 11). A set of descriptors contains only descriptors that are sufficiently low intercorrelated and fulfill criteria (2).
(2)
where
is the square of Pearson linear correlation between the values of two descriptors present in the same set. N is the number of molecules in the calibration set (here N = 28).
Each set of descriptors has been used to calculate a multilinear QSAR equation of type (3).
(3)
where A is represents a dependent property (here the inhibitory activity defined above), C0 is the free term (intercept), Ck are the coefficients (weighting factors) of the descriptors, Dk are some significant descriptors and k is the number of descriptors in the set.
The relative utility (U) of a certain descriptor on dependent property values was computed by the specific procedureCitation9. The descriptor, which presents a high value for U within the range [0, 1000], may be considered very useful in estimating the activity, because they correlate very well with activity and do not correlate with other predictors. Each “useful” descriptor offers ample information about the variation in activity from molecule to molecule. The relative utility (U) was computed using Equation (Equation4(4) ).
(4)
where R2 is the square of the Pearson correlation between the observed and calculated values of activity (values calculated using an equation with k predictors); r2 is the square of the Pearson correlation between the observed and calculated values of activity (values calculated using an equation with k − 1 predictors, i.e. the equation that does not contain the analyzed predictor).
After computing the Acalc values of the inhibitory activity for the prediction set molecules, PRECLAV arranged these molecules according to the estimated values. It computes average value for the estimated values and standard deviation (σ) of the estimated values. The program considers “high values” as the values fulfilling the criterion (5) and “low values” as the values fulfilling the criterion (6). Here, the molecules having “high” computed value of inhibitory activity have been taken as “recommended for synthesis”Citation9,Citation12.
(5)
(6)
The “quality” of each QSPR was computed using usual statistical formulas that are a measure of agreement of observed/computed values of activity: standard error of estimation (SE), Pearson square correlation (r2), Fisher function (F) and cross-validated Pearson square correlation (). The concordance between the observed/computed values has been calculated using the quality function Q (9) which possesses values in the interval {−1, 1}.
(7)
where r2 is Pearson square linear correlation between computed/observed values and N is the number of molecules in the calibration set (here N = 28). By increasing the number of descriptors k, the quality Q of the equations increases, reaches the maximum and then decreases. For predictions, the equation of the highest Q was used. The descriptors present in this equation being called “predictors”.
PRECLAV divides the analyzed molecules into virtual fragments using an algorithm reported earlierCitation20,Citation21. The virtual fragments identified by PRECLAV do not always coincide with the classical functional groups. The presence of a significant fragment in the molecule greatly influences the inhibitory activity of the molecule either in a positive or negative way.
Validation of the developed model
The best way to evaluate the quality of regression model is to leave one out (LOO) and leave-N-out (LNO) cross-validation. The cross-validation used to measure a model’s predictive ability and draw attention to the possibility, a model has been over-fitted. The LNO method of cross-validation is especially useful if the training set used to create the model is small or if there is no test set. For good predictability value should not exceed 0.3. A QSAR model can be considered robust when the average values of
are relatively high and close to
Citation22. Roy et al. have developed a recent term
metricsCitation23–25 (average
and delta
) to check the predictive capacities of a QSAR model. The
metrics are calculated to ascertain the proximity in the values of the predicted and observed response data and validation of the model. The possibility of chance correlation was tested using y-randomization test where only the observed activity was scrambled 10 timesCitation22. The average squared correlation coefficient (
) calculated from the model developed using the permuted data matrices should be much lower than that of the original model r2, so as to reflect the existence of a true correlation for the developed models. The additional calculation of the
Citation26 parameter (threshold value = 0.5) checks for sufficient difference between the values of r2 and
.
Once internally validated, the data set (calibration set) was split into reduced calibration set (training set) and validation set (test set) using hierarchical clustering techniqueCitation27 and proceeded to a QSAR study. The quality of the prediction for the external validation was considered as a measure of the quality of the computation method. The external predictive potential of the developed models was judged based on the value of predictive r2 ()Citation28. Besides the traditional metrics, the fitness between the observed and estimated activity values of the test set compounds was also assessed from average
(test) and delta
(test) parameters. QSAR models bearing acceptable values for all the traditional parameters can be finally assessed based on the
metrics. Those with average
values above the threshold of 0.5 and with a delta
value less than 0.2 are considered to be predictive and reliable ones.
Applicability of domain and detection of outliers
A QSAR model can be used for screening new compounds if its domain of application is definedCitation28,Citation29. The need to characterize the model applicability domain is also reflected in the OECD guidelines for QSAR model validationCitation30,Citation31. QSAR model should only be used for making predictions of compounds fall within the specified domain may be considered reliable. Extent of extrapolationCitation32,Citation33 is one simple approach to define the applicability of the domain. It is based on the calculation of the hat diagonal (leverage) hi for each chemical, where the QSAR model is used to predict its activity:
(8)
In Equation (Equation8(8) ), xi is the descriptor-row vector of the query molecule and X is the k × n matrix containing the k descriptor values for each one of the n training molecules. A hat diagonal (leverage) value >3(k + 1)/n leverage warning limitCitation31 is considered large.
Outliers are compounds that are poorly fit by the regression model. Outlying compounds should not be removed unless a good reason for their removal can be given. The variance of the observed residuals is not constant. This makes comparisons among the residuals difficult. One solution is to standardize the residualsCitation34,Citation35 by dividing by their standard deviations. This gives a set of standardized residuals. The cross-validated LOO standardized residuals is a |RStudent| that has the impact on a single observation.
To visualize the applicability of domain (AD) of a developed QSAR model, William plot was used. In the William plot, |RStudent| versus leverage values (hi) are plotted. This plot could be used for an immediate and simple graphical detection of both the response outliers and structurally influential compounds in a model. It must be noted that compounds with high value of leverage and good fitting in the developed model can stabilize the model. However, compounds with bad fitting in the developed model may be outliers. Thus, the combination of leverage and the |RStudent| could be used for assigning the AD.
Results and discussion
The statistical computations were conducted using the specific formulas and procedures of PRECLAVCitation9 program algorithm. Using only the “significant” descriptors PRECLAV computes 10 000 QSPR type (3) multilinear equations. The quality of the obtained equations is reflected by the value of the Q function and also by values of some usual statistical functions. The metrics,
and
based randomization tests are calculated using DTC lab software toolCitation36. During the PRECLAV MLR analysis, we observed that the equation with highest value of the Q function is four-parametric model and that this model also has the highest predictive power and are as follows:
Dependent property: β-Carbonic anhydrase inhibitors from the fungus M. globosa
Molecules number in calibration set: 28
Molecules number in prediction set: 23
Intercept = 1.5242
Statistical outliers: 0
C1 = 7.9968, D1 = asr (average net charge of C atoms) (U = 789)
C2 = 9.9859, D2 = xbo (molecular orbital maximum bonding contribution) (U = 1000)
C3 = 0.0004, D3 = igu (gravitation index (all atoms) (U = 800))
C4 = −25.5167, D4 = olm (average bond order all bonds) (U = 961)
Whereas the quality of correlation is described by the statistical indices:
SEE = 0.3446, r2 = 0.8687, F = 39.6921, Q = 0.7446;
= 0.79823
Average
The high usability of the xbo (U = 1000) descriptor mostly influence the MG-CA inhibitory activity because the utility value of this descriptor is high as compared to the other three descriptors in the QSAR model. A positive coefficient for xbo descriptor refers to an increment in the activity profile of the molecules with an increase in the value of this descriptor as seen in the case of compounds 6, 16, 17, 18, 21 and 22. Similarly, the low range values for the xbo descriptor accounts for the reduced activity profile of compounds13 and 14. The negative coefficient of olm descriptor signifies their influence conducive to the antidandruff activity profile of the molecules. The positive coefficient of these descriptors asr and igu descriptors signifies their influence on the antidandruff activity.
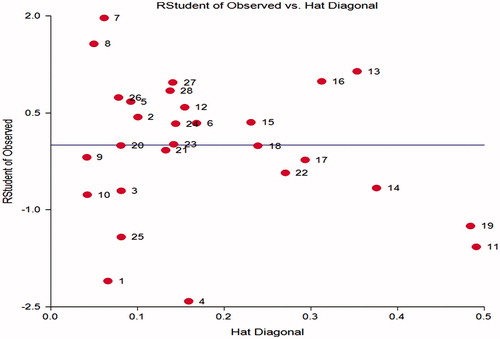
The minimum correlation descriptor/activity is computed for D4 (r2 = 0.0528). The minimum intercorrelation between descriptors D3 and D4 (r2 = 0.0002) and the maximum intercorrelation between descriptors is computed for D2/D4 pair (r2 = 0.1525). Thus, the co-linearity between the predictors is not found. |RStudent| is one of the best single diagnostics for capturing large residuals. shows that none of the compounds has higher |RStudent| than threshold limit |RStudent| < 2 except compound 1 and 4 but hat diagonal is within the limit so it is not considered as outlier. This diagnostic confirms that there are no outliers in the calibration set.
Using the equation, the maximum activity computed for calibration set molecules is 4.073; the average activity computed for calibration set molecules is 3.04 ± 0.886 and the average activity computed for prediction set molecules is 4.604 ± 0.592.
The values of all the statistical parameters being within the acceptable limit reflect the internal predictive potential of the developed model. The satisfactory values of average (>0.5) and delta
(<0.2) calculated based on the whole dataset may efficiently reflect the predictive potential of a model. The value
calculated based on the randomization tests was much higher than the threshold value of 0.5 and thus ensured that the model was not just the mere outcome of chance. LNO cross-validation employs smaller calibration sets than the LOO cross-validation, and it can be repeated several times, because of the large number of combinations that rise when more than one compound is left out from the calibration set, once at a time. The robustness of the model was examined through LNO cross validation, with N = 1–5. It is expected that the average value of each
would be close to
with standard deviations close to zeroCitation37. The model obtained in this study has an average
= 0.79823, only 0.0031 units lower than
. The standard deviation for each “N” performed value is small, with the maximum of 0.18014 for
.
In this study, molecules of analyzed database include 25 virtual fragments but only 5 virtual fragments are considered significant. The percentages, in weight, of molecular fragments are well correlated (directly or inversely) with the values of inhibitory activity. The signifiant molécule fragments are:
CH3, r = −0.4698 (methyl group)
CHN, r = −0.4472 (amine group)
CN2, r = −0.447 (carbon and nitrogen in thidazole system)
S atom, r = −0.4472 (sulfur atom)
C2H2N3S, r = −0.4407 (amino thiadizole)
The methyl fragment is present in two compounds (compounds 4 and 14), while the other significant fragments are present in only two molecules (compounds 14 and 13). The presence of the methyl groups, amine group, carbon and nitrogen in heterocyclic compound, sulfur atom and thiadizole system seems to be unfavorable to activity and also the database shows that the aforementioned compounds (4, 13 and 14) have a low activity.
The validation set was extracted from the homogenized calibration set. For the present work, the selection of the validation set is based on the hierarchical clustering techniqueCitation27. The cluster analysisCitation38 is a method of arranging objects into groups. In the present work, the molecules with ranks 01, 05, 09, 13, 24, 18 and 28 constituted the validation set (test set) and the remaining molecules form the reduced calibration set (training set). The validation set of 07 molecules (25% of database) captures all the features and span the activity range of the entire data set. We can assume that the reduced calibration set obtained in this way is a representative sample for the calibration set. In the presence of the validation set, we obtained the four-parametric QSAR model for the training set with same predictors. xbo, olm, asr and igu used in the above QSAR study and obtained result [SE = 0.1226, r2 = 0.8556, F = 23.692, = 0.7483,
= 0.89067, average
= 0.65428, delta
= 0.091, average
= 0.81074, delta
= 0.09269 and
= 0.80807]. The predictive quality of the models was assessed based on the value of
and
metric and based on these parameters. The predictive r2 (
> 0.5), average
(>0.5) and delta
(<0.2) parameter indicates significant ability of the developed model to predict the MG-CA inhibitory activity of new compounds. The value
calculated based on the randomization tests was much higher than the threshold value of 0.5 and thus ensured that the model was not just the mere outcome of chance.
We can state that the estimated value for the molecules in the validation set is close to the experimental ones and have ordered the molecules in a sequence similar enough to the real one MG-CA inhibitory activity value. In order to confirm our findings we have compared the estimated values of the activities with the experimental (observed) ones (). This has further been demonstrated in and and for training set and test set; a linear relationship between observed and estimated activities in a scatter plot indicates that linearity assumption is appropriate.
Figure 3. Graphs of observed versus estimated activity in the calibration set and validation set.
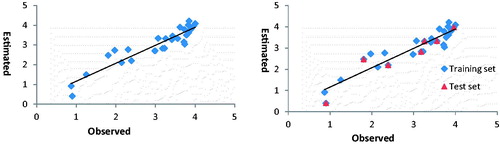
Table 2. Observed, estimated and residual values of MG-CA inhibitory activity (A) for the molecules used in the reduced calibration set (training set).
Table 3. Observed, estimated and residual values MG-CA inhibitory activity (A) of compound used in the validation set (test set).
According to criterion (5), this equation identified molecules in prediction set having high values of MG-CA inhibitory activity “suggested for synthesis”. In , the predicted values of not yet synthesized compounds 29–51 were identified by the program as high have been marked in bold letters, while the values identified as low have been underlined.
Applicability domain
As discussed earlier, we used |RStudent| of observed inhibitory activity calculated by the obtained models and hat diagonal (leverage) for assigning AD. Values for leverage have been calculated for both calibration set and prediction set compounds shown in . AD for the developed model of calibration set is shown in William plot (). Influential compounds are points with leverage value higher than the warning leverage limit. It can be seen in the William plot; all molecules in calibration set lie in the application domain of the developed model. None of the molecules has leverage value higher than warning leverage limit 0.5357. Leverage value of prediction set compounds 29–51 in exhibits that all are within defined warning limit fixed by the calibration set except molecule 36. Therefore, the computed activity of the prediction set compounds may be acceptable by using developed model of calibration set.
Figure 4. |RStudent| of observed versus hat diagonal of calibration set compound.
Conclusions
In calibration set, the bond order and molecular orbital bonding have greater influence on activity value. The presence of the methyl, sulfur atom and amino thiadizole groups is not favorable to activity. Molecular orbital maximum bonding contribution plays dominant role for the activity. Many molecules in proposed prediction set have much higher computed activity than observed value. Thus, attempts have been made to design and develop new drugs against MG-CA inhibitory activity on a rational basis so as to decreases the trial and error factor and predict the biological activity before synthesis.
Supplementary material available online
Supplementary Table 2
Supplemental Material.pdf
Download PDF (31.2 KB)Acknowledgements
This article is dedicated to the memory of the late Prof. Padmakar V. Khadikar (1936–2012).
Declaration of interest
The author (S.S.) expresses her thanks to the University Grants Commission, New Delhi, India for providing financial support under UGC Research Award No.F.30-29/2011(SA-II). The authors declare that there is no conflict of the interest.
References
- Shuster S. The aetiology if dandruff and mode of action of therapeutic agents. Br J Dermatol 1984;111:235–42
- Hewitson KS, Vullo D, Scozzafava A, et al. Molecular cloning, characterization, and inhibition studies of a β-carbonic anhydrase from Malassezia globosa, a potential antidandruff target. J Med Chem 2012;55:3513–20
- BROOD (version 2.0.0). OpenEye Science Software. Santa Fe (NM); 2010
- OMEGA (version 2.4.3). OpenEye Science Software. Santa Fe (NM); 2010
- Tresadern G, Bemporad D, Howe TA. Comparison of ligand based virtual screening methods and application to corticotropin releasing factor 1 receptor. J Mol Graph Model 2009; 27:860–70
- Halgre TA. MMFF VI. MMFF94s option for energy minimization studies. J Comput Chem 1999;20:720–9
- Stewart JJP. Optimization of parameters for semi empirical methods. V. Modification of NDDO approximations and application to 70 elements. J Mol Model 2007;l13:1173–213
- Stewart JJP. MOPAC2012 version 12.239W, Stewart Computational Chemistry, Colorado Springs, CO. Available from: http://OpenMOPAC.net [last accessed 26 Aug 2012]
- PRECLAV v. 1203. (Documentation included) is available from Center of Organic Chemistry – Bucharest; 2012
- Tarko L. QSPR/QSAR computations by PRECLAV software. Rev Chim (Bucuresti) 2005;56:639–48
- Tarko L, Stecoza CE, Ilie C, Chifiriuc MC. QSAR Studies on antibacterial activity of some substituted dihydrodibenzothiepins. Rev Chim (Bucuresti) 2009;60:476–9
- Tarko L. QSAR studies regarding the inhibition of the carbonic anhydrase by the sulfonamides containing a picolinoyl Group. Rev Chim (Bucuresti) 2007;58:191–4
- Singh S, Supuran CT. Chemometric modeling of breast cancer associated carbonic anhydrase IX inhibitors belonging to the ureido-substituted benzene sulfonamide class. J Enzyme Inhib Med Chem 2014;29:877–83
- Singh S. In silico molecular modeling of carbonic anhydrase inhibitors: inhibition of Plasmodium falciparum carbonic anhydrase with aromatic/heterocyclic sulfonamides. Bioorg Med Chem Lett 2015;25:133–41
- Singh S. A QSAR study on novel series of carbonic anhydrase inhibitors hCA IX – tumor-associated (Hypoxia). Med Chem 2012;8:656–72
- Singh S. Comparative QSAR studies on the novel series of thiazolones and tetrazole derivatives as HCV NS5B polymerase allosteric inhibitors. Lett Drug Des Discov 2009;6:286–97
- Singh S, Singh S, Shukla P. Modeling of novel HIV-1 protease inhibitors incorporating N-aryl-oxazolidinone-5-carboxamides as P2 ligands using quantum chemical and topological finger print descriptors. Med Chem Res 2011;20:1556–65
- Singh S, Supuran CT. Chemometric QSAR modeling and in silico design of carbonic anhydrase inhibition of a coral secretory isoform by sulfonamide. Bioorg Med Chem 2013;21:1495–502
- Singh S, Supuran CT. 3D-QSAR CoMFA studies on sulfonamide inhibitors of the Rv3588c b-carbonic anhydrase from Mycobacterium tuberculosis and design of not yet synthesized new molecules. J Enzyme Inhib Med Chem 2014; 29:449–55
- Tarko L. Fragmentarea virtual a moleculelor si evaluarea similaritatilor. Rev Chim (Bucuresti) 2004;55:539–46
- Tarko L. A procedure for virtual fragmentation of molecules into functional groups. ARKIVOC 2004;xiv:74–82
- Eriksson L, Jaworska J, Worth AP, et al. Methods for reliability and uncertainty assessment and for applicability evaluations of classification and regression-based QSARs. Environ Health Perspect 2003;111:1361–75
- Roy K, Mitra I, Kar S, et al. Comparative studies on some metrics for external validation of QSPR models. J Chem Inf Model 2012;52:396–408
- Ojha PK, Mitra I, Das RN, Roy K. Further exploring rm2 metrics for validation of QSPR models dataset. Chemom Intell Lab Syst 2011;107:194–205
- Roy K, Chakraborty P, Mitra I, et al. Some case studies on application of “r(m)2” metrics for judging quality of quantitative structure–activity relationship predictions: emphasis on scaling of response data. J Comput Chem 2013;34:1071–82
- Roy K. On some aspects of validation of predictive quantitative structure–activity relationship models. Expert Opin Drug Discov 2007;2:1567–77
- Draper NR, Smith H. Applied regression analysis. New York: Wiley; 1981
- Golbraikh A, Tropsha A. Beware of q2!. J Mol Graph Model 2002;20:269–76
- Osten DW. Selection of optimal regression models via cross-validation. J Chemom 1998;2:39–48
- Organization for Economic Co-operation and Development Guidance Document on the Validation of (Quantitative) Structure–Activity Relationship QSAR Models. OECD Document ENV/JM/MONO 2; 2007
- Worth AP, Aldenberg T, Benjamin I, Cronin MTD. Quantitative structure activity relationships – the report and recommendations of ECVAM workshop 52. ATLA 2005;33:155–73
- Tropsha A, Gramatica P, Gombar VK. The importance of being earnest: validation is the absolute essential for successful application and interpretation of QSPR models. Comb Sci 2003;22:69–77
- Weaver S, Gleeson MP. The importance of the domain of applicability in QSAR modeling. J Mol Graph Model 2008;26:1315–26
- NCSS (Statistical Software Delux package). Kaysville, UT; 2004. Available from: http://www.ncss.com
- Cook DR. Residuals and influence in regression. New York: Chapman and Hall; 1982
- Drug Theoretics and Cheminformatics Laboratory, Jadavpur University, Kolkata. Available from: http://dtclab.webs.com/software-tools
- Van de Waterbeemd H (ed). Statistical validation of QSAR results. In: Chemometric methods in molecular design. Weinheim: Wiley-VCH; 1998:309–18
- Everitt B, Landau S, Leese M. Cluster analysis. London: Arnold Press; 2001