
 ?Mathematical formulae have been encoded as MathML and are displayed in this HTML version using MathJax in order to improve their display. Uncheck the box to turn MathJax off. This feature requires Javascript. Click on a formula to zoom.
ABSTRACT
In this article, we assess the 31 articles published in Basic and Applied Social Psychology (BASP) in 2016, which is one full year after the BASP editors banned the use of inferential statistics. We discuss how the authors collected their data, how they reported and summarized their data, and how they used their data to reach conclusions. We found multiple instances of authors overstating conclusions beyond what the data would support if statistical significance had been considered. Readers would be largely unable to recognize this because the necessary information to do so was not readily available.
1 Introduction
In February of 2015, the editors of Basic and Applied Social Psychology (BASP) banned the use of the “null hypothesis significance testing procedure” (NHSTP) and confidence intervals. Trafimow and Marks (Citation2015, p. 1) said, “prior to publication, authors will have to remove all vestiges of NHSTP (p-values, t-values, F-values, statements about ‘significant’ differences or lack thereof, and so on)” from articles published in BASP. In the 2015 editorial, in response to the question of whether any inferential statistical procedures were required for publication in BASP, the editors said,
No, because the state of the art remains uncertain. However, BASP will require strong descriptive statistics, including effect sizes. We also encourage the presentation of frequency or distributional data when this is feasible. Finally, we encourage the use of larger sample sizes than is typical in much psychology research, because as the sample size increases, descriptive statistics become increasingly stable and sampling error is less of a problem.
While BASP stopped just short of banning all inferential methods, frequentist methods were clearly verboten and the editors “reserve the right to make case-by-case judgments” for Bayesian methods (Trafimow and Marks Citation2015). The ban is an extension of the position first laid out by Trafimow when he became editor of BASP where, in his inaugural editorial, Trafimow (Citation2014, p. 1) said, “BASP will no longer require inferential statistics procedures on an a priori basis.” Subsequent to the ban, Trafimow is quoted as saying, “I’d rather not have any inferential statistics at all than have some that we know aren’t valid” (Woolston Citation2015).
The BASP editors had thus chosen to only allow the use of descriptive statistics to communicate research results and, at a minimum, signaled an interest in publishing research based only on the use of descriptive statistics. After announcing the ban, BASP published an article by Valentine, Aloe, and Lau (Citation2015) that provided “concrete guidance to researchers on ways they can explore and communicate results of their studies.” This guidance consisted of the following three basic principles of data analysis: (1) use of graphical displays for data and descriptive statistics, (2) reporting measures of variation along with measures of central tendency, and (3) the use and thoughtful interpretation of effect sizes.
In our article, we consider the 31 BASP papers published in 2016; that is, one full year after the ban on hypothesis testing and confidence intervals. We do not review the 2015 papers because many seemed to contain pre-ban statistical practices, perhaps because they had been accepted for publication prior to the ban being put in place. In Section 2, we provide some additional background on the ban, including a summary of its origins. In Section 3, we describe what types of statistical practices BASP now permits. In Section 4, after reviewing the 2016 BASP papers, we present some of our findings. In Section 5, we discuss and reflect on the impact of the ban. Finally, in Section 6, we present our conclusions.
2 Criticisms of Statistical Significance Testing
Part of the BASP editors’ motivation for banning statistical inference from BASP was a perceived over-reliance by psychology researchers on the use of p-values for judging the importance of results, where research results are often obscured by a stylistic convention in which authors pepper their expository text with a variety of statistics and p-values. For example, a typical psychology article often reads like the following passage from Skinner, Stevenson, and Camillus (Citation2015, p. 61):
In Step 1, women (
) perceived the defendant to be significantly more inattentive than men (
). Yet H3 was not supported: There was no significant main effect of defendant gender on perceived inattention (
). With regards to the sexism measures, benevolent sexism was unrelated to perceived inattention (
), but hostile sexism was a significant predictor of inattention (
). Specifically, as hostile sexism increased, participants perceived the defendant to be less attentive. Finally, as with the attribution of responsibility analysis, in Step 2 of the model (
) a Defendant Gender × Hostile Sexism interaction emerged (
).
In addition, Trafimow and Marks (Citation2015) explicitly stated that their ban is based on the following issues:
Hypothesis testing does not provide the probability a particular hypothesis is true given the observed data.
Confidence intervals do not provide the probability the parameter is within a particular (fixed) interval.
Bayesian methods, which are capable of providing these types of inference, often use priors that “depend on some sort of Laplacian assumption,” meaning uniform priors.
Focusing in on the role of p-values in hypothesis testing, Trafimow and Marks (Citation2016, p. 1) wrote,
The probability of the finding (or one more extreme) given the null hypothesis (p) is not the same as the probability of the null hypothesis given the finding, nor does p provide a strong basis for drawing conclusions about the probability of the null hypothesis given the finding. Without a strong basis for drawing a conclusion about the probability of the null hypothesis given the finding, there is little justification for rejecting the null hypothesis simply because p <.05. This rejection—the heart of the null hypothesis significance testing procedure—commits the inverse inference fallacy.
2.1 The Inverse Inference Fallacy
Cohen (1994) described the Inverse Inference Fallacy as the “misapplication of deductive syllogistic reasoning.” That is, Cohen suggested hypothesis testing is interpreted as a generalization of the following deductive reasoning,
If A is true then B cannot occur;
However, B has occurred;
Therefore, A is false;
that is transformed into the following probabilistic reasoning,
If A is true then B probably cannot occur;
However, B has occurred;
Therefore, A is probably false;
where he then equates A with the null hypothesis and B with some form or function of the observed data. He goes on to say that the following equivalent “formulation appears at least implicitly in article after article in psychological journals and explicitly in some statistics textbooks,”
If H0 is true, then this result (statistical significance) would probably not occur;
This result has occurred;
Then H0 is probably not true and therefore formally invalid.
Cohen (Citation1994, p. 998) called this “the illusion of attaining improbability.”
2.2 The Laplacian Assumption
The issue that BASP editors take with Bayesian methods is part of the long standing discussion over how to choose prior probabilities. In particular, the Laplacian assumption to which their 2015 editorial refers is the use of priors in the absence of any information about the probabilities of the hypotheses. There are two arguments presented. The first is that an assumed prior is based on unknown information: “Bayesian procedures
depend on some sort of Laplacian assumption to generate numbers where none exist
” (Trafimow and Marks Citation2015, p. 1). The second is that uniform priors, often used to represent a state of ignorance about a parameter, may violate the “principle of indifference,” by which they mean that a transformation of the parameter into an equivalent problem may no longer yield a uniform prior (Trafimow Citation2005). For a discussion of a Bayesian approach for use by psychologists, we recommend Wagenmakers (Citation2007).
2.3 Other Criticisms Appearing in BASP
The BASP editors devoted an issue of the journal to mediation analysis, which seeks to identify unobservable “mediator variables” that influence the observable relationships between independent variables and a dependent variables. In that issue, Kline (Citation2015, p. 207) listed the following five “basic criticisms of significance testing” as applied in mediation analyses in a section of his article entitled “Folly of Statistical Significance as a Decision Criteria”:
“Outcomes of significance tests—p values—are wrong in most studies.”
“Researchers do not understand p-values.”
“Significance tests do not tell researchers what they want to know.”
“Most applications of significance testing are incorrect.”
“Respecification in SEM [structural equation modeling] based solely on significance testing merely capitalizes on chance.”
The reasons for most of these criticisms will not come as a surprise to most statisticians. For example, according to Kline (Citation2015) p-values are wrong and the applications of significance testing are incorrect in most psychology studies because “[t]rue random sampling is very rare, especially in human studies where most samples are ad hoc (convenience),” because parametric tests are conducted on data that do not meet the assumptions of the tests, and because the wrong hypotheses are tested. He takes particular issue with “nil hypothesis testing” (as do Trafimow and Marks, Citation2015) because it is “scientifically far-fetched.”
The criticism that (psychology) researchers do not understand p-values is also well known and was part of the justification for BASPs ban as discussed by Trafimow and Marks (Citation2015, Citation2016). In his article, Kline (Citation2015) never further expounds on the criticism that significance tests do not tell (psychology) researchers what they want to know, but presumably the rationale is similar to that discussed in Section 2; that is, by employing hypothesis testing researchers are simply testing whether mediation exists rather than determining whether or not the mediation effect is “large and precise enough to be appreciable in a particular context.” Finally, the criticism that fitting a structural equation model using significance testing “merely capitalizes on chance” is mainly focused on the issue of overfitting models to data. Of course, the overfitting of models to data is not a new issue, nor is it unique to the field of psychology.
Hypothesis testing and p-value criticisms aside, most statisticians would likely agree with the main points made by Kline (Citation2015, p. 202):
(1) the typical mediation study relies on an inadequate design; (2) the researcher uses a flawed analysis strategy; and (3) there is scant attention to assumptions that are required when estimating mediation. These problems stem from overgeneralizing the classical product method for estimating mediation and overreliance on statistical significance testing as a decision criterion in mediation analysis.
3 What Does BASP Allow?
Subsequent to the ban, BASP published an article by Valentine, Aloe, and Lau (Citation2015) entitled “Life after NHST: How to Describe Your Data Without ‘p-ing’ Everywhere” which we view as indicative of BASP editorial intentions. Valentine, Aloe, and Lau (Citation2015, p. 260) said they “provide concrete guidance to researchers on ways they can explore and communicate the results of their studies” where, as mentioned in Section 1, they promote the use of descriptive statistics and the following three basic principles of data analysis:
Use statistics to summarize and plots to display data,
Report measures of variation along with measures of central tendency, and
Present and appropriately interpret effect sizes.
These principles are consistent with what is considered to be good statistical practice, although Valentine, Aloe, and Lau (Citation2015) give rather cursory and overly general recommendations with no references to the broader statistical literature other than Tukey (Citation1977). For example, the only graphical displays illustrated are bar charts, stem-and-leaf plots, and boxplots. For summary statistics, they recommend reporting the sample size, mean, median, SD, range, and coefficient of variation, which is fine as far as it goes, but limited.
A focus of Valentine, Aloe, and Lau (Citation2015) is on the calculation and interpretation of effect sizes in the two-sample situation. They recommended measures for continuous data such as Cohen’s d defined as(1)
(1) where
and
are the means of samples from populations 1 and 2, respectively, and sp
is the usual pooled estimate of the standard deviation (SD). They also recommended the unstandardized difference in sample means, r and r2, U3,1 “descriptive U3,” and a measure called the common language effect size (or CLES).
In summary, BASP allows basic descriptive statistics with an emphasis on observed effect sizes. Trafimow and Marks (Citation2015) said as much in their quote given at the beginning of Section 1. Of course, a key issue is that these effect size measures are point estimates with no quantification of uncertainty, so BASP readers have no information about whether an observed effect size is consistent with random variation under the assumption of no effect being present.
4 2016 BASP Research
The question we are interested in addressing is how the BASP editors’ belief that “banning the NHSTP will have the effect of increasing the quality of submitted manuscripts by liberating authors from the stultified structure of NHSTP thinking thereby eliminating an important obstacle to creative thinking” (Trafimow and Marks Citation2015, p. 2) influenced the use of data and statistics in the 31 BASP papers published in 2016. These papers consisted of:
One editorial (Trafimow and Marks Citation2016);
Three literature reviews (Kressel and Kressel Citation2016; Schuhr Citation2016; Stepanova et al. Citation2016);
Ten discussion papers (Chatterjee Citation2016; Filho and Rettig Citation2016; Kuldas and Bulut Citation2016; Marsman, Ly, and Wagenmakers Citation2016; Pashler et al. Citation2016a, Citation2016b; Rose Citation2016; Sinha Citation2016; Witte and Zenker Citation2016a, Citation2016b); and,
Seventeen research papers that used statistical methods, to a greater or lesser degree, and which are the main focus of this section.
Before proceeding, it is worth mentioning that we found some vestiges of statistical significance in this volume of BASP. The entire argument of Pashler et al. (Citation2016b) was based on showing that some oddities in data were very unlikely under an assumption of randomness. This was demonstrated using p-values obtained using bootstrapping. Sinha (Citation2016) and Hill (2016) reported p-values. Gatobu, Arocha, and Hoffman-Goetz (Citation2016, p. 5) described observation-oriented modeling as an alternative to the usual methods of statistical inference. They used a “c-value” which is just a bootstrapped p-value.
4.1 Assessing Cohen’s d Values Reported in BASP
To begin, we considered the results of 15 experiments in seven papers in which authors used Cohen’s d to assess scientific impact: Covarrubias, Herrmann, and Fryberg (Citation2016, studies 1 & 2), Noordewier and van Dijk (Citation2016, study 3), Hughes, Creech, and Strosser (Citation2016, studies 2, 3, 4, & 6), Herrmann et al. (Citation2016, studies 1 & 2), Teng, Poon, and Yang (Citation2016, experiments 1 & 2), Rasmussen et al. (Citation2016, studies 2 & 3), and Chen, Ding, and Li (Citation2016, studies 1 & 3).
As shown in EquationEquation (1)(1)
(1) , Cohen’s d is the difference between the means of two samples measured in terms of their estimated assumed common SD. In the psychology literature, it has become accepted that
indicates there is a “small” practical effect;
indicates a “medium” practical effect; and
indicates a “large” practical effect (Cohen Citation1988, pp. 24–27).
Given the value of Cohen’s d and the two sample sizes, it is straightforward to calculate the associated two-sample t-test p-value since the test statistic is justwhere n1 and n2 are the sample sizes. For
that follows a t-distribution with ν degrees of freedom, the p-value for the two-sided test is
. We denote the total sample size by n; that is,
. Now, before proceeding, we wish to emphasize here that we are not advocating for p-values in this analysis but rather are using them as a convenient way (given the limited information we have available from the BASP papers) to calculate some measure of statistical significance for the reported Cohen’s d values.
is a plot of Cohen’s d values from the seven papers versus their p-values, where most of the p-values are approximate because for 59 of the 64 reported values only the total sample size n was given and so we had to assume n1 and n2 were equal. Of the 64 published d values, 32 (50%) were not statistically significant, if statistical significance is defined as having a p-value less than or equal to 0.05. As the figure shows, for this particular set of results, nearly all of the d values larger than Cohen’s minimum medium effect size were statistically significant and all of those below Cohen’s small effect size limit were not. Those are the more straightforward cases.
Fig. 1 Cohen’s d values plotted against the approximate p-values from 15 experiments in seven BASP papers that used Cohen’s d to assess scientific impact. Four points with extremely large d values ranging from 2.85 to 3.71 are not shown.
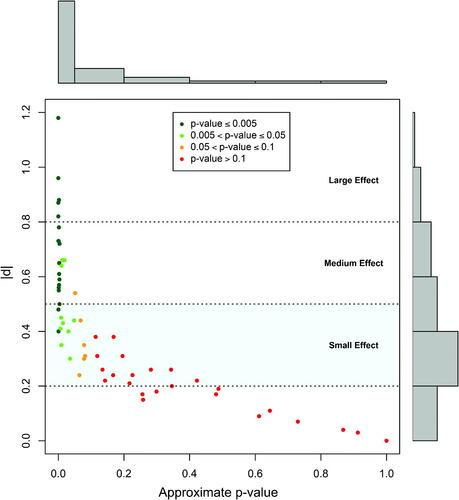
However, for those d values that correspond to small effect sizes shown in the light blue shaded area in the plot (29 of 64 or 45.3% of the d values), there is no way to decide whether a particular observed d value is consistent with random fluctuations in the data under the assumption of equal population means without some measure of statistical significance. Furthermore, for those Cohen’s d values that fell in the small effect size range, more than two-thirds (20 out of 29 or 68.9%) are not statistically significant if one uses the admittedly arbitrary cutoff of p < 0.05. We can debate whether the p-value is the best way to separate signal from noise, including the question of whether to use a simple dichotomization rule to decide, but in the absence of any information other than observed effect size, it surely seems that subsequent researchers will be at a disadvantage trying to interpret the results.
This issue is further compounded by authors who sometimes seem to over-interpret the observed effect sizes relative to someone who uses the arbitrary p < 0.05 cutoff. For example, for a d value of 0.44 Teng, Poon, and Yang (Citation2016, p. 273) conclude that “those in the high group identification condition rated the protest as less righteous than participants in the low group identification condition
,” yet the associated p-value is 0.065. In another example, Herrmann et al. (Citation2016, p. 262) conclude that “A d of.24 indicates that participants in the intervention group on average earned approximately one fourth of a SD higher grade than participants in the control group, which is considered a small effect size.” This sentence is, of course, correct because it only refers to the two samples, but the associated p-value of 0.064 would make someone using the p < 0.05 threshold careful in inferring anything more from the observed difference. Yet, Herrmann et al. (Citation2016, p. 263) later go on to conclude that “These findings provide further support for the notion that brief psychological interventions can yield significant effects in educational contexts.”
Now, to be fair, most of the initial descriptions of the observed Cohen’s d effect sizes seem consistent with a p-value dichotomization at 0.05, but that could be due to authors who first conducted a standard statistical analysis and then removed it from their papers prior to publication. If that is the case, then BASPs ban on inference makes less sense as all it does is deprive readers of potentially useful information. However, as in the Herrmann et al. (Citation2016, p. 263) example, not infrequently the specific results are appropriately presented, but then in the title, abstract, or elsewhere in the article, conclusions are drawn that seem stronger than what the actual results appear to support. For example, studies 1 and 2 of Covarrubias, Herrmann, and Fryberg (Citation2016) reported 19 Cohen’s d values, where each observed effect size was described in terms of the study participants without reference to a larger population, which is perfectly fine in that context. However, in spite of the fact that some of the results in study 1 were inconsistent, and one of the significant d values contradicted the original hypothesis until a post hoc reassignment of some of the results achieved a significant result in the desired direction, the final paragraph of the article is a broad generalization, concluding:
The positive influence of affirmations that incorporate families for Latino students signifies the importance of integrating these close others into the school environment. For example, teachers can empower Latino students by including important others, such as family members, in their school experiences. Given the positive effects on performance in our studies, teachers could utilize number or word problems that are culturally relevant (e.g., ratio of ingredients for your family’s favorite meal, distance to travel to see your relatives). By framing affirmations to match students’ ideas about what is a ‘right’ self, teachers can create cultural matches that foster a learning environment that is welcoming, familiar, and safe for students who have been historically underserved in education (Covarrubias, Herrmann, and Fryberg Citation2016, pp. 54–55).
In the authors’ defense, they do describe their post hoc analysis. However, this does suggest that some sort of caveat is warranted in reporting the results, where it seems that in the absence of a measure of statistical significance the authors focused only on the effect size measures and this led to a potential overstatement of Study 1 results.
4.2 Assessing Some Reported Regression Coefficients
Within the 31 papers, two papers contained regression results that also included the standard errors (SEs) of the estimated regression coefficients: Teng, Poon, and Yang (Citation2016) and Haas (2016). Using this information, we were able to calculate approximate 95% percent confidence intervals and thus assess some inferential aspects of the reported results.
We begin with Teng, Poon, and Yang (Citation2016) who conducted two studies intended to evaluate how reading about social protests affects an individual’s perception of social justice as a function of whether he or she identifies with the protestors. The data were collected via surveys of students in a Chinese university, with 128 students in the first experiment and 142 in the second.
For the 20 estimated regression coefficients reported in the article, displays 95% confidence intervals color coded as to whether the interval contains zero (red) or not (green) along with the affiliated text describing each result. The first nine estimated coefficients are from the first experiment and the rest from the second experiment.
Fig. 2 Approximate 95% confidence intervals for estimated regression coefficients in Teng, Poon, and Yang (Citation2016, experiments 1 & 2).
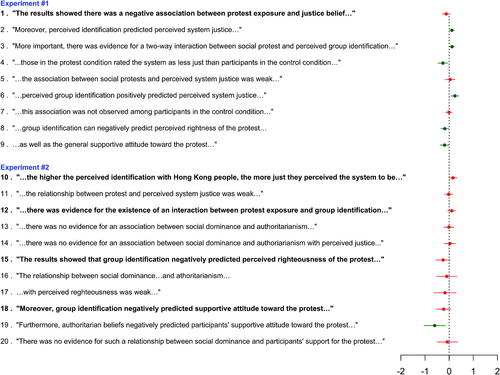
There are a few observations evident from this plot. The first is that all of the estimated coefficients are quite small (the largest in an absolute sense is –0.6) and the majority (13 of 20) are statistically insignificant at an approximate 5% significance level. Secondly, at least five of the insignificant results are interpreted as if there were effects (see the bold text for lines 1, 10, 12, 15, and 18). This suggests that, in the absence of interval estimates, the authors tended to over-interpret their results (compared to the use of the p-value threshold) by asserting the existence of effects that are not supported if one considers the variation in the data.
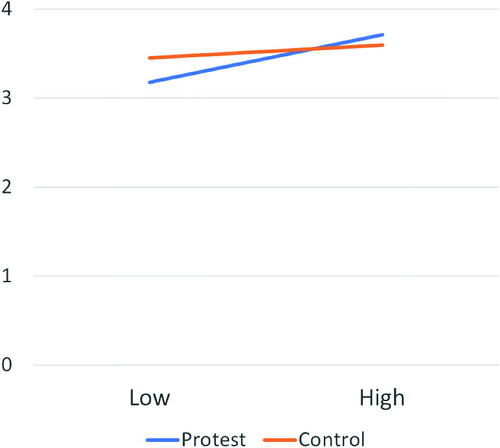
A particularly egregious example is plotted in the article. The authors say, “Moreover, consistent with our predictions, there was evidence for the existence of an interaction between protest exposure and group identification (; see ).” The interaction plot is given in where we note that in the published figure the range of the vertical axis is (3.0, 3.8) which visually amplified what would be considered a statistically insignificant interaction. Furthermore, the title of their article explicitly states without any qualification that the interaction effect exists: “Does Social Protest Shake People’s Justice Beliefs? It Depends on the Level of Group Identification” (our emphasis). They also stress this in the conclusion section of their article, “We found that protest exposure and group identification interacted to predict participants’ justice belief. Specifically, the more participants perceived identification with the protesters’ group, the less they thought the protest was right, and thus less supportive of the protest” (Teng, Poon, and Yang Citation2016, p. 274).
Fig. 3 Interaction plot using data from Teng, Poon, and Yang (Citation2016, p. 273). The original figure truncated range of the y-axis which visually magnified the differences in the slopes of the lines.
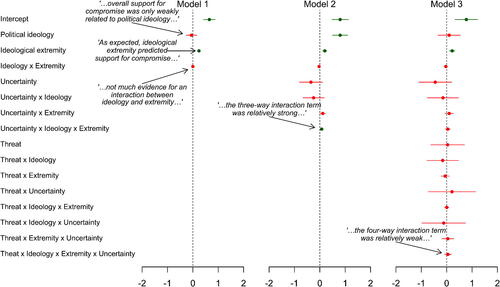
We now turn to Haas (Citation2016), the goal of which was to examine the impact of uncertainty and threat on support for political compromise. For study 2 of that article, data were collected on a sample of 210 subjects that consisted of a combination of 152 individuals recruited via Amazon’s Mechanical Turk website (which we will discuss in more detail in Section 5) and 58 undergraduates. The participants were randomly assigned to one of four conditions in a 2 × 2 design: threat versus control by uncertain versus certain.
shows plots of approximate 95% confidence intervals for the coefficients from three linear regression models, each with successively more terms, calculated from Table 1 of Haas (Citation2016, p. 143). Assuming the regression models were appropriately fit (something we cannot check), the plots clearly show that only the intercept, ideology extremity, and perhaps political ideology are statistically significant at the p < 0.05 level. That is, the uncertainty and threat terms, as well as all the associated interaction terms, are not significant (where we discount the negligible three way interaction in Model 2). Yet, the author then devotes an entire page to interpreting statistically insignificant differences between a variety of pairwise sample mean comparisons. For example: “Examining mean support for compromise by condition shows that in the full sample, uncertainty increased [author’s emphasis] support for compromise () relative to certainty (
) in the control condition” (Haas Citation2016, p. 144). However, assuming the study participants were evenly divided between each condition, the p-value for a two sample t-test is about 0.4, showing that the results are consistent with the assumption of equal population means. Yet, the author goes on to state conclusions such as, “Consistent with the results of Study 1, uncertainty was more likely to increase support for compromise when participants were not also feeling threatened” (Haas Citation2016, p. 145).
Fig. 4 Approximate 95% confidence intervals for estimated regression coefficients in Haas (Citation2016, study 2).
In summary, in this section we began by noting that the 2016 papers were not entirely free of inferential methods. Interestingly, Gatobu, Arocha, and Hoffman-Goetz (Citation2016) reinvented the bootstrap p-value, perhaps to fill the vacuum left by the ban. Mainly, however, we reviewed results in BASP papers related to Cohen’s d or regression analyses when the results included standard errors. In so doing, note that we did not cherry pick the most egregious examples to present; rather, we simply selected the papers that used statistics for which it was easy to do some basic inferential checks. When researchers only employ descriptive statistics we found that they are likely to overinterpret and/or overstate their results compared to a researcher who uses hypothesis testing with the p < 0.05 threshold.
5 Discussion
In reading the psychology literature, we found what we consider to be exemplary guidance for the rigorous application of statistical methods in psychology research. Specifically, the recommendations of the American Psychological Association’s Task Force on Statistical Inference (Wilkinson and the Task Force on Statistical Inference 1999) are excellent, where we note that there were statisticians on the task force (Donald Rubin, Frederick Mosteller, and John Tukey), and where the recommendations fully support the appropriate use of descriptive and inferential statistical methods in psychological research. In fact, the Task Force wrote:
Some had hoped that this task force would vote to recommend an outright ban on the use of significance tests in psychology journals. Although this might eliminate some abuses, the committee thought that there were enough counterexamples (e.g., Abelson Citation1997) to justify forbearance. (Wilkinson and the Task Force on Statistical Inference 1999, pp. 602–603).
Similarly, the Publication Manual of the American Psychological Association (APA) provides very relevant and appropriate advice for how to appropriately convey research results, including the following:
APA stresses that NHST is but a starting point and that additional reporting elements such as effect sizes, confidence intervals, and extensive description are needed to convey the most complete meaning of the results. The degree to which any journal emphasizes (or de-emphasizes) NHST is a decision of the individual editors. However, complete reporting of all tested hypotheses and estimates of appropriate effect sizes and confidence intervals are the minimum expectations for all APA journals (American Psychological Association Citation2009, p. 33).
However, the BASP editors decided to abandon this approach, where we note that BASP is not an APA journal.
Also in reading the literature, we noted that there is a very vocal subset of psychology researchers (in addition to the BASP editors) who believe that inferential statistical methods generally accepted in many other fields are not serving their research needs and goals. In particular, there has been severe criticism in some corners of psychology, as well as in the BASP editorials, against “nil-hypothesis testing.” Yet, a point that seems to have been missed in these discussions is one of statistics’ seminal contributions to the practice of science: tools that facilitate insight into whether an observed phenomenon could be a real effect or just noise in the data. As Benjamini (Citation2016) said of the p-value specifically, “In some sense it offers a first line of defense against being fooled by randomness, separating signal from noise, because the models it requires are simpler than any other statistical tool needs.”
Lakens (Citation2016) who did a brief review of some 2015 post-NHST ban BASP papers expressed a similar sentiment, albeit a bit more colorfully:
In their latest editorial, Trafimow and Marks [Citation2016] hit down some arguments you could, after a decent bottle of liquor, interpret as straw men against their ban of p-values. They don’t, and have never, discussed the only thing p-values are meant to do: control error rates. Instead, they seem happy to publish articles where some authors get all the leeway they need to adamantly claim effects are observed, even though these effects look a lot like noise.
However, this point is not lost on all psychology researchers. More than 20 years ago, Abelson (Citation1997, p. 14) wrote, “Null hypothesis tests are cogent in scrutinizing surprising results that critics doubt. They address the alternative argument that some familiar chance mechanism could have produced the result.” In a similar vein, 30 years ago, Cohen (Citation1988, p. 16) wrote, “Research reports in the literature are frequently flawed by conclusions that state or imply that the null hypothesis is true. For example, following the finding that the difference between two sample means is not statistically significant, instead of properly concluding from this failure to reject the null hypothesis that the data do not warrant the conclusion that the population means differ, the writer concludes, at least implicitly, that there is no difference.”
Our sense from reading these papers is that psychology research is much less focused on the question of whether an observed effect can be attributed to random variation in the data as it is on proving a particular hypothesis that explains the existence of a presumed effect. We see both as important, but failing to first skeptically assess whether an observed effect could be consistent with random variation may result in an excessive number of false positives in research results. Indeed, the scientific method demands skepticism of any observed results, where one should first want to rule out the simplest explanation that an observed result is consistent with random variation in the data before then seeking to find another explanation.
In an article published in BASP, Kline (Citation2015, p. 208), citing a study by Haller and Krauss (Citation2002), perhaps provides some insight into why some misconceptions persist in psychology when he writes “about 80%–90% of psychology professors endorse multiple false beliefs about statistical significance, no better than psychology undergraduate students in introductory statistics courses.” Gigerenzer (Citation2004, p. 588) also cites Haller and Krauss (Citation2002) and goes on to say, “Textbooks and curricula in psychology almost never teach the statistical toolbox, which contains tools such as descriptive statistics, Tukey’s exploratory methods, Bayesian statistics, Neyman–Pearson decision theory and Wald’s sequential analysis.” Instead, he says that psychology statistics textbooks focus exclusively on null hypothesis testing, where in referring to a “distinguished statistical textbook author” Gigerenzer says “He was not a statistician; otherwise, his text would likely not have been used in a psychology class” (Gigerenzer Citation2004, p. 587).
To illustrate some misperceptions, one need look no further than Valentine, Aloe, and Lau (Citation2015). This article was published in BASP after the p-value ban, ostensibly to help psychology researchers improve research practices. Yet as an example of questionable guidance, Valentine, Aloe, and Lau (Citation2015, p. 262) used questionnaire data collected on a 5-point Likert scale to “illustrate how to explore and present data for continuous outcomes.” We also noted multiple BASP papers that contained linear regression models using dependent variables based on Likert scale data (see, e.g., Haas Citation2016; Noordewier and van Dijk Citation2016; Skinner, Stevenson, and Camillus Citation2015), suggesting an issue with what it means to have continuous data and/or how to appropriately model using ordinal data.
Returning to the Inverse Inference Fallacy in Section 2.1, if psychologists are using this type of logic to understand hypothesis testing, then it is perhaps not surprising that some have difficulty with p-values. The Inverse Inference Fallacy seems, at least to us, like a strawman “derivation” of hypothesis testing, where it:
Focuses on a dichotomized decision (the result is “statistical significance”),
Overstates the resulting conclusion (H0 is “formally invalid”), and,
Suggests that
, where R is some result derived from the observed data, say a p-value, because the same word “probably” is used in both the first and third lines of Cohen’s “equivalent formulation.”
To the non-probabilistically inclined, the last point may stem from a general difficulty people have with understanding and interpreting conditional probabilities, where other common mistakes include thinking that and that
. The latter misinterpretation can be particularly troublesome because p-values can be dramatically smaller than
, the probability that the null hypothesis is true given the observed data (Berger and Sellke Citation1987).
In addition, in our opinion, one of the problems with tying hypothesis testing to deductive syllogistic reasoning is that it divorces it from the scientific method applied to experiments. That is, rather than being part of an experimental process that seeks to better understand what is more or less likely to be true, deductive syllogistic reasoning makes hypothesis testing seem like a logic exercise where the goal is to prove one of the hypotheses definitively true and the other definitively false.
In our review, we also found that some authors fail to clearly distinguish between sample and population quantities or between estimates and the quantity being estimated. For example, Valentine, Aloe, and Lau (Citation2015, p. 263, Equationeq. 1(1)
(1) ) define the coefficient of variation as
and they explicitly state “σ is the population SD and μ is the population mean,” which is fine. However, they then go on to illustrate with an example using data, where it then seems more appropriate to think about the data as a sample from some larger population so that they were estimating the coefficient of variation with
. This points to a deeper issue where, if the distinction between sample and population is not clear then the purpose of inference must also be unclear. As discussed by Wagenmakers et al. (Citation2011), it is also important to distinguish between exploratory and confirmatory analyses.
In reading the 2016 BASP papers, in a practice that is common throughout psychology research, nearly all of them used convenience samples, where they are almost exclusively comprised of undergraduate students and individuals recruited using Amazon’s Mechanical Turk. Specifically, within the 17 BASP 2016 research papers, there were a total of 47 studies, of which only four studies in three papers involved sampling from some sort of general population (Dolinski and Grzyb Citation2016; Gatobu, Arocha, and Hoffman-Goetz Citation2016; Montoya and Pittinsky Citation2016). For the other 43 studies:
Nineteen used Mechanical Turk in whole or part;
Twenty-three used college students, mainly undergraduates, in whole or part (with potentially two more in Bhogal, Galbraith, and Manktelow (Citation2016) but not enough information was given to be sure); and,
Two used preuniversity children/students.
For those unfamiliar with it, Mechanical Turk is an Internet-based crowdsourcing platform within which one can post tasks that people will do for pay, often in very small amounts. As the Mechanical Turk website says, “Amazon Mechanical Turk (MTurk) operates a marketplace for work that requires human intelligence. The MTurk web service enables companies to programmatically access this marketplace and a diverse, on-demand workforce” (www.mturk.com). Psychologists now often use it to conduct a variety of experiments, though it is important to note that those doing the tasks choose to do them; there is no way to conduct probability-based sampling nor any feature to sample from some larger targeted population.
Of course, the fact that nearly all the studies in the BASP research papers are based on convenience samples raises basic questions about whether inferential statistics are even appropriate to use on this data. For example, in a conclusion that probably won’t surprise statisticians, Peterson and Merunka (Citation2014, p. 1035) wrote:
In a study of business-related ethicality, analysis of data from four dozen convenience samples of undergraduate business students revealed significant differences in means, variances, intercorrelations, and path parameters across the samples. Depending on the particular convenience sample used, relationships between variables and constructs were positive or negative and statistically significant or insignificant.
Such a result raises important questions about whether many of the experiments in the papers we reviewed are reproducible using other convenience samples.
6 Conclusions
To statisticians, BASPs banning of the use of inference may seem baffling. Although there are limitations of statistical inference, we ascribe to the philosophy of the renowned British scientist Francis Galton (Citation1894, pp. 62–63):
Some people hate the very name of statistics, but I find them full of beauty and interest. Whenever they are not brutalized, but delicately handled by the higher methods, and are warily interpreted, their power of dealing with complicated phenomena is extraordinary. They are the only tools by which an opening can be cut through the formidable thicket of difficulties that bars the path of those who pursue the Science of man.
Here we are 125 years later and it seems that it remains important to emphasize Galton’s key caveats that statistical methods “are not brutalized” and that they are “warily interpreted.” Furthermore, after this review, we also feel it is important to re-emphasize Spiegelhalter’s comments on the ASA Statement on p-Values (Wasserstein and Lazar Citation2016) in “Too familiar to ditch:”
many point out that the problem lies not so much with p-values in themselves as with the willingness of researchers to lurch casually from descriptions of data taken from poorly designed studies, to confident generalisable inferences (Matthews, Wasserstein, and Spiegelhalter Citation2017, p. 41).
In the final accounting, it is the responsibility of the individual researcher to do good science in his or her field. All the statistics community can do is provide the best methods and tools possible; it is up the researcher to properly apply them (“delicately handled”) and appropriately decipher the results (“warily interpreted”). If a drunken driver crashes his car into the tree, it is not the car’s fault (at least not today and until such time as we have fully automated cars). Similarly, there is only so much the statistics profession can do to prevent unfair criticism or abuse of statistical methods and tools. However, when appropriate, we should speak up.
For example, the American Statistical Association’s Ethical Guidelines for Statistical Practice requires individual statisticians to be “candid about any known or suspected limitations, defects, or biases in the data that may impact the integrity or reliability of the statistical analysis” (American Statistical Association Citation2016). We should be just as candid as a profession about other organizations that institutionalize bad statistical practices. Of course, we do not want to be the statistical police, but when a journal like BASP tries to blame statistics for poor scientific practices, we should push back against arguments that lack merit.
That said, we have to take some responsibility for oversimplifying hypothesis testing in our introductory classes with simple dichotomized accept–reject rules and the language of “rejecting the null hypothesis” and “proving the alternative hypothesis” and the like. Furthermore, as a discipline, we would do better by our students to make teaching the scientific method part of our standard curriculum, as well as bringing more experimentation into the classroom, so that students begin to understand what it is like to try to learn through experimentation and particularly to give them actual experience trying to learn from data. Specifically, many of our introductory classes have become so focused on methods in the absence of their scientific application that students do not connect the two. We need to stop oversimplifying or assuming away the actual problems and teach our students how to apply statistics to real problems.
In addition, we need to pay more attention to how our tools are used and, to the extent possible, design them to be less prone to errors of human intuition. For example, we know that p-values confuse some practitioners (see, e.g., Greenland et al. Citation2016) and, while there are legitimate concerns and philosophical divides about their use, frequentist-based hypothesis testing will be with us for a very long time. Thus, we should take a pragmatic view about “mistake proofing” things like p-values. For example, we agree with Greenland (Citation2017) that transforming the p-value onto a “surprisal scale” of, say, , has the potential to align intuitive interpretations more closely with correct use and thereby help eliminate some of the mistakes so common with the use of p-values.
Regardless of whether one agrees with p-values and the hypothesis testing paradigm, psychology researchers would also do well to routinely report some measure of the uncertainty in their effect size point estimates. A good start would be to follow Cohen’s recommendation from 25 years ago:
my third recommendation is that, as researchers, we routinely report effect sizes in the form of confidence limits. “Everyone knows” that confidence intervals contain all the information to be found in significance tests and much more.
Yet they are rarely found in the literature. I suspect that the main reason they are not reported is that they are so embarrassingly large! (Cohen Citation1994, p. 1002).
In summary, in this article we presented our findings from reviewing the papers published in BASP in 2016 a full year after the editors banned the publication of inferential statistical methods. We found multiple instances of results seemingly being overstated beyond what the data would support if p-values (or some other form of statistical inference) had been used. Thus, the ban seems to be allowing authors to make less substantiated claims, the net result of which could be misleading to readers and could well result in a body of literature within which there are a greater number of irreproducible effects.
The Open Science Collaboration (Citation2015) attempted to replicate 100 psychology studies published in three psychology journals. They found that “[r]eplication effects were half the magnitude of original effects” and while “[n]inety-seven percent of original studies had statistically significant results,” only “[t]hirty-six percent of replications had statistically significant results.” In our opinion, the practices we have observed in the papers published in BASP post-ban will not help to solve this problem; in fact, we believe they will make it worse.
Acknowledgments
The authors gratefully acknowledge an associate editor and two reviewers for their thoughtful and very helpful comments on earlier drafts of this article. They were instrumental in helping us substantially improve the article.
Notes
1 For two normally distributed populations with means μ1 and μ2 and common SD σ, Cohen (Citation1988) defined , where
is the CDF of the standard normal distribution.
Related Research Data
References
- Abelson, R. P. (1997), “On the Surprising Longevity of Flogged Horses: Why There Is a Case for the Significance Test,” Psychological Science, 23, 12–15. DOI: 10.1111/j.1467-9280.1997.tb00536.x.
- American Psychological Association (2009), Publication Manual of the American Psychological Association (6th ed.), Washington, DC: American Psychological Association.
- American Statistical Association (2016), “Ethical Guidelines for Statistical Practice,” American Statistical Association, available at www.amstat.org/ASA/Your-Career/Ethical-Guidelines-for-Statistical-Practice.aspx.
- Benjamini, Y. (2016), “It’s Not the p-Values’ Fault,” American Statistical Association, available at http://amstat.tandfonline.com/doi/suppl/10.1080/00031305.2016.1154108?scroll=top.
- Berger, J. O., and Sellke, T. (1987), “Testing a Point Null Hypothesis: The Irreconcilability of p Values and Evidence,” Journal of the American Statistical Association, 82, 112–122. DOI: 10.2307/2289131.
- Bhogal, M. S., Galbraith, N., and Manktelow, K. (2016), “Physical Attractiveness and Altruism in Two Modified Dictator Games,” Basic and Applied Social Psychology, 38, 212–222. DOI: 10.1080/01973533.2016.1199382.
- Chatterjee, P. (2016), “Response to Pasher et al. (2016),” Basic and Applied Social Psychology, 38, 19–29. DOI: 10.1080/01973533.2015.1129335.
- Chen, N., Ding, G., and Li, W. (2016), “Do Negative Role Models Increase Entrepreneurial Intentions? The Moderating Role of Self-Esteem,” Basic and Applied Social Psychology, 38, 337–350. DOI: 10.1080/01973533.2016.1217223.
- Cohen, J. (1988), Statistical Power Analysis for the Behavioral Sciences (2nd ed.), Hillsdale, NJ: Erlbaum.
- Cohen, J. (1994), “The Earth Is Round (p <.05),” American Psychologist, 49, 997–1003.
- Covarrubias, R., Herrmann, S. D., and Fryberg, S. A. (2016), “Affirming the Interdependent Self: Implications for Latino Student Performance,” Basic and Applied Social Psychology, 38, 47–57. DOI: 10.1080/01973533.2015.1129609.
- Dolinski, D., and Grzyb, T. (2016), “One Serious Shock Versus Gradated Series of Shocks: Does ‘Multiple Feet-in-the-Door’ Explain Obedience in Milgram Studies?,” Basic and Applied Social Psychology, 38, 276–283. DOI: 10.1080/01973533.2016.1214836.
- Filho, E., and Rettig, J. (2016), “Intergroup Conflict Management Strategies From a Nobel Peace Laureate: The Case of José Ramos-Horta,” Basic and Applied Social Psychology, 38, 351–361. DOI: 10.1080/01973533.2016.1221348.
- Galton, F. (1894), Natural Inheritance, London: McMillan and Company.
- Gatobu, S. K., Arocha, J. F., and Hoffman-Goetz, L. (2016), “Numeracy, Health Numeracy, and Older Immigrants’ Primary Language: An Observation-Oriented Exploration,” Basic and Applied Social Psychology, 38, 185–199. DOI: 10.1080/01973533.2016.1197129.
- Gigerenzer, G. (2004), “Mindless Statistics,” The Journal of Socio-Economics, 33, 587–606. DOI: 10.1016/j.socec.2004.09.033.
- Greenland, S. (2017), “Cognitive Biases Built Into Testing, and a Surprising Solution: The Information Content of a P-Value as Measured by Surprisal,” American Statistical Association, Presentation at the ASA Symposium on Statistical Inference on October 12, 2018, Bethesda, MD.
- Greenland, S., Senn, S. J., Rothman, K. J., Carlin, J. B., Poole, C., Goodman, S. N., and Altman, D. G. (2016), “Statistical Tests, p-Values, Confidence Intervals, and Power: A Guide to Misinterpretations,” The American Statistician Online Supplement, 70, 1–20.
- Haas, I. J. (2016), “The Impact of Uncertainty, Threat, and Political Identity on Support for Political Compromise,” Basic and Applied Social Psychology, 38, 137–152. DOI: 10.1080/01973533.2016.1169181.
- Haller, H., and Krauss, S. (2002), “Misinterpretations of Significance: A Problem Students Share With Their Teachers?,” Institute for Science Education, available at http://www.metheval.uni-jena.de/lehre/0405-ws/evaluationuebung/haller.pdf.
- Herrmann, S. D., Adelman, R. M., Bodford, J. E., Graudejus, O., Okun, M. A., and Kwan, V. S. Y. (2016), “The Effects of a Female Role Model on Academic Performance and Persistence of Women in STEM Courses,” Basic and Applied Social Psychology, 38, 258–268. DOI: 10.1080/01973533.2016.1209757.
- Hill, C. A. (2016), “Implicit and Explicit Sexual Motives as Related, But Distinct Characteristics,” Basic and Applied Social Psychology, 38, 59–88. DOI: 10.1080/01973533.2015.1129610.
- Hughes, J., Creech, J. L., and Strosser, G. L. (2016), “Attributions About Morally Unreliable Characters: Relationship Closeness Affects Moral Judgments,” Basic and Applied Social Psychology, 38, 173–184. DOI: 10.1080/01973533.2016.1198979.
- Kline, R. B. (2015), “The Mediation Myth,” Basic and Applied Social Psychology, 37, 202–213. DOI: 10.1080/01973533.2015.1049349.
- Kressel, N. J., and Kressel, S. W. (2016), “Trends in the Psychological Study of Contemporary Antisemitism: Conceptual Issues and Empirical Evidence,” Basic and Applied Social Psychology, 38, 111–126. DOI: 10.1080/01973533.2016.1164704.
- Kuldas, S., and Bulut, S. (2016), “What Is Called Self in Educational Research and Practice?,” Basic and Applied Social Psychology, 38, 200–211. DOI: 10.1080/01973533.2016.1198260.
- Lakens, D. (2016), “So You Banned p-Values, How’s That Working Out for You?,” Eindhoven University of Technology, available at http://daniellakens.blogspot.com/2016/02/so-you-banned-p-values-hows-that.html.
- Marsman, M., Ly, A., and Wagenmakers, E.-J. (2016), “Four Requirements for an Acceptable Research Program,” Basic and Applied Social Psychology, 38, 308–312. DOI: 10.1080/01973533.2016.1221349.
- Matthews, R., Wasserstein, R. L., and Spiegelhalter, D. (2017), “The ASA’s p-Value Statement, One Year on,” Significance, 14, 38–41. DOI: 10.1111/j.1740-9713.2017.01021.x.
- Montoya, R. M., and Pittinsky, T. L. (2016), “Bounded Rationality’s Account for the Influence of Group Identification on Ingroup Favoritism: A Field Investigation Using Jewish and Arab Populations in Israel,” Basic and Applied Social Psychology, 38, 127–136. DOI: 10.1080/01973533.2016.1180295.
- Noordewier, M. K., and van Dijk, E. (2016), “Interest in Complex Novelty,” Basic and Applied Social Psychology, 38, 98–110. DOI: 10.1080/01973533.2016.1153474.
- Open Science Collaboration (2015), “Estimating the Reproducibility of Psychological Science,” Science, 349, aac4716-1–aac4716-8.
- Pashler, H., Rohrer, D., Abramson, I., Wolfson, T., and Harris, C. R. (2016a), “Response to comments by Chatterjee, Rose and Sinha,” Basic and Applied Social Psychology, 38, 41–46. DOI: 10.1080/01973533.2016.1138863.
- Pashler, H., Rohrer, D., Abramson, I., Wolfson, T., and Harris, C. R. (2016b), “A Social Priming Data Set With Troubling Oddities,” Basic and Applied Social Psychology, 38, 3–18. DOI: 10.1080/01973533.2015.1124767.
- Peterson, R., and Merunka, D. (2014), “Convenience Samples of College Students and Research Reproducibility,” Journal of Business Research, 67, 1035–1041. DOI: 10.1016/j.jbusres.2013.08.010.
- Rasmussen, K. R., Alibhai, A., Boon, S. D., and Ellard, J. H. (2016), “Trust as an Explanation for Relational Differences in Revenge,” Basic and Applied Social Psychology, 38, 284–300. DOI: 10.1080/01973533.2016.1215314.
- Rose, R. L. (2016), “Cautious Thoughts on ‘A Social Priming Data Set With Troubling Oddities’,” Basic and Applied Social Psychology, 38, 30–32. DOI: 10.1080/01973533.2015.1127237.
- Schuhr, A. (2016), “Seizing Control: Estimating Multiple Decision Processes and the Investigation of Self-Control,” Basic and Applied Social Psychology, 38, 241–257. DOI: 10.1080/01973533.2016.1207174.
- Sinha, J. (2016), “Selective Literature Review and Selective Data Analyses: Implications for the (Re)analysis of Public Access Research Data,” Basic and Applied Social Psychology, 38, 33–40. DOI: 10.1080/01973533.2015.1129336.
- Skinner, A. L., Stevenson, M. C., and Camillus, J. C. (2015), “Ambivalent Sexism in Context: Hostile and Benevolent Sexism Moderate Bias Against Female Drivers,” Basic and Applied Social Psychology, 37, 56–67. DOI: 10.1080/01973533.2014.996224.
- Stepanova, E. V., Strube, M. J., Clote, L. E., and Limes, D. (2016), “Pictorial Race Activation in Priming Measures,” Basic and Applied Social Psychology, 38, 223–239. DOI: 10.1080/01973533.2016.1201484.
- Teng, F., Poon, K.-T., and Yang, Y. (2016), “Does Social Protest Shake People’s Justice Beliefs? It Depends on the Level of Group Identification,” Basic and Applied Social Psychology, 38, 269–275. DOI: 10.1080/01973533.2016.1210518.
- Trafimow, D. (2005), “The Ubiquitous Laplacian Assumption: Reply to Lee and Wagenmakers (2005),” Psychological Review, 112, 669–674. DOI: 10.1037/0033-295X.112.3.669.
- Trafimow, D. (2014), “Editorial,” Basic and Applied Social Psychology, 36, 1–2. DOI: 10.1080/01973533.2014.865505.
- Trafimow, D., and Marks, M. (2015), “Editorial,” Basic and Applied Social Psychology, 37, 1–2. DOI: 10.1080/01973533.2015.1012991.
- Trafimow, D., and Marks, M. (2016), “Editorial,” Basic and Applied Social Psychology, 38, 1–2. DOI: 10.1080/01973533.2016.1141030.
- Tukey, J. W. (1977), Exploratory Data Analysis, Reading, MA: Pearson.
- Valentine, J. C., Aloe, A. M., and Lau, T. S. (2015), “Life After NHST: How to Describe Your Data Without ‘p-ing’ Everywhere,” Basic and Applied Social Psychology, 37, 260–273. DOI: 10.1080/01973533.2015.1060240.
- Wagenmakers, E.-J. (2007), “A Practical Solution to the Pervasive Problems of p Values,” Psychometric Bulletin and Review, 14, 779–804. DOI: 10.3758/BF03194105.
- Wagenmakers, E.-J., Wetzels, R., Borsboom, D., and van der Maas, H. (2011), “Why Psychologists Must Change the Way They Analyze Their Data: The Case of Psi: Comment on Bem (2011),” Journal of Personality and Social Psychology, 100, 426–432. DOI: 10.1037/a0022790.
- Wasserstein, R. L., and Lazar, N. A. (2016), “Editorial: The ASA’s Statement on p-Values: Context, Process, and Purpose,” The American Statistician, 70, 129–133. DOI: 10.1080/00031305.2016.1154108.
- Wilkinson, L., and the Task Force on Statistical Inference (1999), “Statistical Methods in Psychology Journals: Guidelines and Explanations,” American Psychologist, 54, 594–604. DOI: 10.1037/0003-066X.54.8.594.
- Witte, E. H., and Zenker, F. (2016a), “Beyond Schools: Reply to Marsman, Ly, and Wagenmakers,” Basic and Applied Social Psychology, 38, 313–317. DOI: 10.1080/01973533.2016.1227710.
- Witte, E. H., and Zenker, F. (2016b), “Reconstructing Recent Work on Macrosocial Stress as a Research Program,” Basic and Applied Social Psychology, 38, 301–307. DOI: 10.1080/01973533.2016.1207077.
- Woolston, C. (2015), “Psychology Journal Bans P Values,” Nature, 519, 9. DOI: 10.1038/519009f.