
 ?Mathematical formulae have been encoded as MathML and are displayed in this HTML version using MathJax in order to improve their display. Uncheck the box to turn MathJax off. This feature requires Javascript. Click on a formula to zoom.
ABSTRACT
Research in science education agrees that one of the key challenges of learners in the discipline is certainly connecting domain-specific representations to the underlying concepts. One way of supporting students to make applicable connections is using purposefully designed highlighting techniques in multimedia instructions. In order to examine the influence of different highlighting techniques on learning, 171 chemistry undergraduate students were provided with tutorial videos either with static, dynamic or without highlighting. The results show that students viewing tutorial videos with dynamic highlighting gave more sophisticated answers in direct retention tasks. Furthermore, results indicate that low prior knowledge is compensated by both static and dynamic highlighting techniques. This finding is supported by causal mediation analysis, which indicates that the effect of prior knowledge is moderated by the different highlighting techniques. Besides student learning outcomes, students’ evaluation of the different tutorial videos shows significant benefits of the highlighted instructions in terms of perceiving higher comprehensibility. The results support the use of appropriate highlighting techniques in instructional formats to foster a stronger link between conceptual knowledge and representations.
1. Introduction
The domain of chemistry relies on a system of external visual representations to display imperceptible phenomena on the molecular level. Using and understanding these types of representations is one of the main requirements in chemistry (Cooper et al., Citation2013; Gilbert & Treagust, Citation2009; Stieff et al., Citation2011). Particularly in organic chemistry, understanding the symbolic language is essential to infer chemical concepts from these representations and to use them as ‘evidence to support claims, draw inferences and make predictions’ (Kozma & Russell, Citation1997). Working with representations includes the ability to analyse specific features, generate new representations, and distinguish which representations can support specific arguments or not, among others (Kozma & Russell, Citation2005; Stieff et al., Citation2011). To develop this skill-set, learners need to connect chemical concepts that are encoded in a representation to visible surface features (Kozma, Citation2020; Rau, Citation2017). However, according to the representation dilemma, representations pose a twofold demand: on the one hand, students need to learn new information from representations, on the other hand, they might not yet fully understand the representations themselves (Rau, Citation2017). This dilemma might be exacerbated from the circumstance that representations are often taught as a mere ‘by-product’ of other topics and are therefore not explicitly discussed (Hilton & Nichols, Citation2011; Popova & Jones, Citation2021; Taskin & Bernholt, Citation2014). Therefore, it might not be surprising that dealing with representations is considered a major challenge for students (Taber, Citation2009; Taskin & Bernholt, Citation2014).
In chemistry education research, students’ difficulties with understanding these representations are well known (Cooper et al., Citation2013; Gilbert & Treagust, Citation2009; Johnstone, Citation1982). There is a consensus in the literature that learners often tend to either rely on surface features of representations in order to solve problems, or to use heuristics that involve the application of symbolic rules grounded in memorisation or intuition (Graulich, Citation2015b; Maeyer & Talanquer, Citation2013; Weinrich & Talanquer, Citation2015). Instead of connecting the appropriate meaning to the symbols, students are known to take a connect-the-dots or decorating-with-arrows approach while overall prioritising form over function (Anzovino & Bretz, Citation2015; Bhattacharyya & Bodner, Citation2005; Ferguson & Bodner, Citation2008; Grove et al., Citation2012; Rappoport & Ashkenazi, Citation2008; Strickland et al., Citation2010). Not only the ability to incorporate mechanistic reasoning into argumentation is described as a rather slow development (Weinrich & Talanquer, Citation2015), but also the application of heuristics seems to even hinder students to reach more sophisticated levels (Cooper et al., Citation2013).
While students’ problems and deficits in learning organic chemistry are well grounded in the literature, less is known about ways to foster the ability to infer chemical concepts from representations.
2. Theoretical background
Representational competencies can be considered an umbrella term for an essential set of knowledge and skills constituting domain-specific expertise (Daniel et al., Citation2018; Rau, Citation2020; Stieff et al., Citation2011; Tippett, Citation2016; Treagust et al., Citation2003). While serving as a bridge construct between cognitive and situative orientations, practices associated with components of representational competencies (e.g. analysing features of a representation) are well-grounded in multimedia learning theories (Rau, Citation2017). With regard to developing representational competencies, the three most acknowledged multimedia learning theories (Design, Function and Task Framework (Ainsworth, Citation2006), the Cognitive Theory of Multimedia Learning (Mayer, Citation2014) and the Integrated Model of Text and Picture Comprehension (Schnotz, Citation2014)) agree that learning from representations requires visual understanding of how information is encoded in those representations. Visual understanding involves three consecutive processes: selecting meaningful visual features for further processing, organising these visual features into an internal representation, and integrating the internal representation by mapping it to prior domain knowledge (Mayer, Citation2014; Schnotz, Citation2014). Thus, an external chemical representation demands the learner to identify relevant features (e.g. the symbol ‘C=O’ in a Lewis-structure), then to organise the selected information to the referent that is internally represented (e.g. mapping the ‘C=O’ to a carbonyl group) and to integrate the internal representation with conceptual knowledge (e.g. mapping carbonyl to its chemical properties, such as a negative inductive effect). Increasing expertise allows learners to efficiently and effortlessly form internal representations based on recognition, which involves fluent retrieval of conceptual knowledge (Chi et al., Citation1989; Kellman & Massey, Citation2013; Schnotz, Citation2014).
While experts see ‘at a glance’ what an external representation depicts, visual understanding is facilitated when the connection between representation and conceptual knowledge is made explicit (Chi et al., Citation1989; Hilton & Nichols, Citation2011; Kellman & Massey, Citation2013; Rau, Citation2020). To foster students’ visual understanding, evidence from cognitive sciences suggests that scaffolding with a signal or highlighting technique might be an appropriate strategy to overcome the representation dilemma (Rau, Citation2017; van Gog, Citation2014). By using highlighting in digital instructional formats, learners’ attention is purposefully guided towards the relevant parts of the representation to accentuate the organisation of the material and to reduce search space (Boucheix & Lowe, Citation2010; van Gog, Citation2014). When encountering new learning materials, these highlights are particularly helpful by facilitating the process of information selection (Mayer, Citation2014).
Common chemistry textbooks make use of highlighting by colouring individual parts of a representation such as functional groups (Bruice, Citation2016; Clayden et al., Citation2012). This static highlighting intends to guide the readers to specific parts of the representation or to the ideas discussed in the text. Bhattacharyya and Bodner (Citation2005) report that this kind of highlighting in organic chemistry textbooks appears to be helpful to students to the extent that they experience difficulties when transitioning to textbooks that no longer have such cues.
Nevertheless, textbooks are limited to presenting written explanations and corresponding visual representations sequentially, meaning that multiple sources of information must be integrated mentally before they can be understood (Mayer, Citation2014; Schnotz, Citation2014). By presenting new information in this manner, only the channel of visual processing is addressed, and thus attention must be split between explanation (text) and representation, which places an additional demand on the learner (Ayres & Sweller, Citation2014). According to the modality principle, addressing two sensory channels (auditory and visual) results in superior learning (Low & Sweller, Citation2014; Tindall-Ford et al., Citation1997). This increase of learning occurs when new information is explained by audible narration rather than by on-screen text, as is the case of tutorial videos. It was shown that the modality principle is especially efficient when the learning material is complex, as is the case of reaction mechanisms (Tindall-Ford et al., Citation1997). Following this line of argumentation and using tutorial videos for instruction, a permanent (static) colour-coded highlighting might not adequately account for the dynamic nature of an (audible) explanation. To address this, one approach is to combine the verbal explanations with highlighting by colouring parts of a representation sequentially while they are being referred to. These dynamic highlights are synchronised spatially and timely with the explanation. Especially in learning environments that address complex learning materials, dynamic highlighting aligned to verbal explanations were found to result in superior learning (Jamet et al., Citation2008; Jeung et al., Citation1997; Tabbers et al., Citation2004), as they facilitate learners to attend to information in a recommended order and to distribute their attention accordingly by a shortened search time (Boucheix & Lowe, Citation2010; de Koning et al., Citation2009).
3. Research questions
When learning organic chemistry, students’ main hindrances seem to be the ability to connect representations with underlying chemical concepts (Graulich, Citation2015a). A potential approach to foster this ability is incorporating specific highlighting into instructional material. Therefore, our study aims to provide evidence that purposefully designed highlighting techniques (either static or dynamic) in tutorial videos support students’ visual understanding, e.g. to make appropriate inferences about implicit chemical concepts from representations of organic reaction mechanisms. Accordingly, students’ learning gains and perception when working with these tutorial videos were analysed in order to answer the following research questions:
RQ 1: Do tutorial videos with static or dynamic highlighting of relevant parts of a representation improve students’ visual understanding in the context of reaction mechanisms more than tutorial videos without highlighting?
We hypothesise, based on the existing literature, that static highlighting results in beneficial learning compared to the non-highlighted condition, and, that dynamic highlighting results in substantial learning gains compared to the static and control condition (Jamet et al., Citation2008; Jeung et al., Citation1997; Tabbers et al., Citation2004).
Besides the pre- and post-tests measuring different facets of visual understanding (e.g. information retrieval from structural formula), the tutorial videos were accompanied by a set of immediate retention tasks that directly address aspects and relations that are explicitly mentioned in the videos (c.f. Method section). This measure indicates to what degree students elaborate on or rephrase the main arguments presented in the video. Based on these three measures, we intend to address the following research question:
RQ 2: Does students’ retention when watching the videos mediate the effect of their prior knowledge on their knowledge gain?
RQ 3: Do different highlighting techniques moderate the mediation of prior knowledge on learning gain via retention?
We assume that the relation between students’ prior knowledge and their knowledge after the intervention is at least partially mediated by the degree to which students are able to rephrase the main arguments in the videos (i.e. retention tasks). As students’ retention is intended to be guided by the different highlighting techniques implemented in the treatment conditions, we further expect this mediation to be moderated by the three intervention groups.
In addition to objective measurements of knowledge and learning gains, we were also interested in students’ perception of the different highlighting techniques and whether these techniques influence their subjective ratings of the comprehensibility of the tutorial videos.
RQ 4: Does highlighting influence students’ perception of the tutorial videos’ comprehensibility?
In line with our expectations regarding the benefit of the different highlighting techniques on students’ learning gains, we assume that students perceive the highlighting to be helpful to process and understand the content covered in the tutorial videos. Accordingly, we expect students to rate the comprehensibility increasingly higher when comparing groups from control to static to dynamic.
4. Method
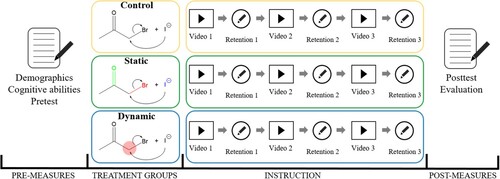
In order to examine the effect of the different highlighting techniques, the format of tutorial videos was chosen as the conveyed content could be kept constant. At the same time, the different highlighting versions could be implemented. The purposefully designed tutorial videos were presented to students in a randomised controlled intervention ().
Figure 1. Overview of the research design, measures and procedure. No highlighting is shown in the control group, functional groups are colour-coded in the static group, the translucent red dot moves synchronously to the explanation in the dynamic group.
4.1. Participants and setting
For this study, 198 students from beginner organic chemistry courses at two German universities were recruited on a voluntary basis. The organic chemistry lectures of the two testing locations were compared prior to the study and were very similar in curriculum and teaching style. At the time of the intervention, nucleophilic substitution reactions were covered in the lectures, however, these courses followed a rather traditional teaching approach based on name-reactions and predict-the-product tasks. Thus, students were unfamiliar with the task format presented in the videos. We chose students from this course as appropriate addressees for our intervention since participation in this course provided sufficient prior knowledge to potentially understand the representations displayed in the tutorial videos. Informed consent was obtained from all participants after the provision of information about data-handling and privacy protection rights. Also, students were informed that participation would not affect their course grade and that they could opt out from the study at any time without consequences. For mapping pre- and post-tests, pseudonyms were used. The research design followed ethical standards compliant with the German Research Foundation. 27 participants were excluded due to missing group affiliation, un-assignable pre- and post-tests or overall missing data. Consequently, data from 171 students were analysed.
The participants were randomly assigned to one of the experimental conditions of the between-subject design (cf. , cf. section instruments). The sample composition within the three groups was comparable ().
Table 1. Group composition and demographic statistics.
4.2. Instruments
4.2.1. Tutorial videos
The central element of the intervention are the tutorial videos. Overall, three videos with a length of approximately 5 min each were developed. The development and design of the videos are described with regard to three main aspects: content, task format, and explanation. The content of the videos covers nucleophilic substitution reactions, which are exemplary to basic reaction mechanisms in introductory organic chemistry at the university level. Influential factors in nucleophilic substitution that determine reactivity are leaving group ability, nucleophilicity, and substrate effects. These factors are governed by implicit properties of the reactants and students need to connect those properties to the explicit features of the structural formula at hand to make a claim about the reaction process.
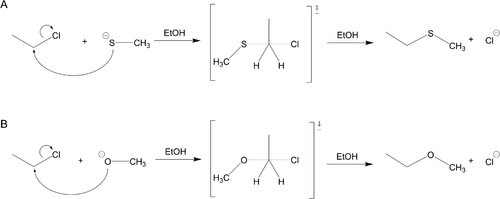
We chose case comparisons as the task format (). Rooting in analogy learning, case comparisons have been a long established pedagogical tool across various disciplines (e.g. Gentner, Citation1989; Treagust et al., Citation1992; see Alfieri et al., Citation2013, for a meta-analytic review). This format is also known in chemistry education to be advantageous in terms of eliciting students’ reasoning of chemical mechanisms by engaging them to compare the (explicit) structures and to critically weigh the (implicit) factors that influence the reaction process (Bodé et al., Citation2019; Caspari et al., Citation2018). Case comparisons typically display two similar reactions, which should be compared and discussed by the learner, e.g. to determine the reactivity based on commonalities and differences between the two cases (Graulich & Schween, Citation2018). When faced with this task format, beginner students have a significantly lower proportion of comparative eye-movements than advanced students (Rodemer et al., Citation2020). This finding indicates that case comparisons with visual highlights might support specifically students with low prior knowledge.
Figure 2. Example case comparison task from the tutorial videos.
The verbal explanation given in the tutorial videos is based on the principles of the comparative mechanistic reasoning framework and provides a complete cause–effect description (Caspari et al., Citation2018). The explanations follow a step-by-step structure: A brief overview addressing the changes that occur in both reactions (I), naming the goal of the comparison (II), emphasising the visual commonalities and differences (III), stating the relation between reactivity and influential factors (IV), explaining and comparing the influences of the implicit properties (V), summarising the effects on the transition state to refer to the energetic proceeding of the reactions (VI), and, finally, coming to a justified statement about the reactivity of both reactions (VII). Subsequently, all explanations were reviewed and approved by an independent expert of organic chemistry.
Following the research questions, the three tutorial videos are provided with either no cues (‘control’), permanent colour-coding of functional groups (‘static’), or sequential highlighting (in form of a translucent red dot), synchronised with the verbal explanation (‘dynamic’), while the verbal explanation and the permanent display of representations remain the same in all three conditions (; for original (German) and translated videos, see https://osf.io/r4sx3/?view_only=84f3319508594da7b1d5d93caf942c3f).
4.2.2. Cognitive abilities test
The subscale ‘figural analogies’ (N2) from the cognitive abilities test (KFT-R; Heller & Perleth, Citation2000) was used. In 25 items, a pair of two figures combined with a third figure is presented. Students are required to select one figure out of a list of five other figures that matches the third in such a way that both pairs illustrate an analogous relation. The instrument is a speeded test (8 min) and a well-established and standardised instrument to assess abstract-logical and perception-bound aspects of intelligent behaviour. The reliability of the test was sufficiently high (Cronbach’s α = .79).
4.2.3. Pre-/post-test
A test with 34 items was developed to assess the learners’ visual understanding, e.g. the ability to make appropriate inferences about implicit chemical concepts from representations, with respect to nucleophilic substitution reactions in organic chemistry. The purpose of the test was the assessment of students’ knowledge gains based on the intervention. The test draft was reviewed by an organic chemistry lecturer and two experts of chemistry education. Based on their recommendations, some items were revised and refinements were made. A pilot testing included 21 students. Students’ answers to the test and feedback resulted in further refinement of wording and revision of some items.
The items reflect tasks that are typical for representational competencies and, hence, visual understanding, e.g. selecting information from representations and meaningfully organise them (Rau, Citation2017). Six different aspects of nucleophilic substitution reactions were addressed in the items: information-retrieval from structural formula (12 items), case comparisons of functional group properties (11 items), case comparisons of reactivity between two similar reactions (3 items), predict-the-product tasks (3 items), sorting tasks for leaving group ability (3 items), and cloze texts on reaction process description (2 items). Answer formats included multiple-choice, true-false, constructed response, cloze texts, and drawings (for exemplary items cf. supplementary material S3).
For the analysis, each item was scored binary and an overall mean test score by participant was calculated. In accordance with recent studies (Scheid et al., Citation2018), the specific processes of visual understanding covered in the different tasks are not assumed to reflect individually measurable subskills, but the test is assumed to measure a one-dimensional construct. Test score reliability was assessed by calculating Cronbach’s alpha and was found to be sufficient (pre-test: α = .79; post-test: α = .68).
4.2.4. Retention tasks
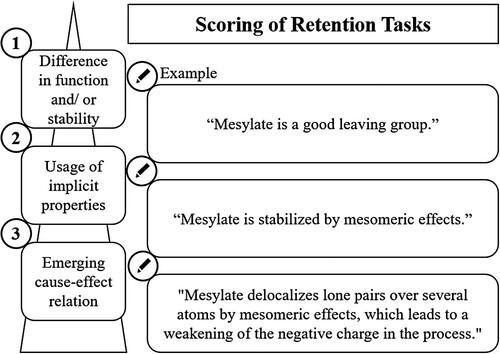
Immediately after each tutorial video, two retention tasks concerning the chemical factors that influence the reaction speed were presented to students. These factors were addressed in the videos; therefore, the retention tasks measure the elaborateness of the students’ answers in rephrasing the main arguments. One example task was: ‘Please explain the faster bond formation in reaction B’.
The theoretical considerations that went into these tasks and the tutorial videos are based on prior research concerning case comparisons in organic chemistry (Caspari et al., Citation2018; Graulich & Schween, Citation2018). The level of elaboration was scored using a 4-point rating scale ranging from 0 (wrong answer) to 3 (emerging cause–effect relation) (). Inter-rater reliability with two coders was determined by calculating Cohen’s kappa for coding one fourth of the overall answers (n = 43), which resulted in κ = .79. Refinements were made after resolving divergent codes. Since the inter-rater reliability was good, only one rater continued scoring the remaining answers. The scores of the retention tasks were averaged into a total retention score which was used for the later analysis. Again, score reliability for the retention tasks was found to be sufficiently high, α = .63.
Figure 3 Scoring of retention tasks.
4.2.5. Evaluation questions
Between the three videos, participants were asked to answer four evaluation questions on a 4-point Likert scale (1 – ‘totally disagree’ to 4 – ‘totally agree’). These were, for example: ‘The presentation in the video was easy to understand’ (see Appendix for all items). Test score reliability was calculated using Cronbach’s alpha for each of the three videos. In all three videos, the second item was not correlated with the remaining three items. Thus, this item was dropped, and a scale consistent of three items was formed, resulting in αVideo1 = .74, αVideo2 = .77, αVideo3 = .79. According to the conceptual considerations that went into the item design, the scale covers students’ subjective rating of the comprehensibility of the videos.
4.3. Data collection
The intervention was conducted in a single session of 1½ hour in the chemistry department’s lecture halls. Participants were assigned randomly to the experimental conditions while the size of the groups was balanced. First, the purpose of the study and information about legal rights and privacy protection were presented. After providing informed consent by signature, participants filled in a short questionnaire on demographic data. Afterwards, the cognitive abilities test (8 min) and the pre-test (25 min) were conducted. Then, the intervention started. Participants used either tablets or laptops with headphones to watch the tutorial videos. Technical support was provided when necessary. After each of the three videos, students were asked to answer the retention tasks and the evaluation questions before continuing with the next video. Overall, the intervention lasted about 30 min. The intervention was then followed by the post-test (25 min).
4.4. Analytical strategy
Following our research questions, several statistical procedures were conducted. To determine differences in the treatment groups, analyses of variance and subsequent post-hoc comparisons were conducted. If test assumptions (e.g. normal distribution) were violated, robust procedures were used instead (Field & Wilcox, Citation2017). For all statistical analyses, an α-level of .05 was used. As a measure for the effect size, (partial) η² is reported, where we qualify values of .01 as small, values of .06 as medium, and values of .14 as large effects (Cohen, Citation1988). In the case of pairwise comparisons, we report the correlation coefficient r as effect size, where values are qualified as small (.1 ≤ .3), medium (.3 ≤ .5) or large (≥.5) (Cohen, Citation1988). For robust procedures, we chose heteroscedastic one-way ANOVAs for trimmed means including the explanatory measure of effect sizes ξ, with the same ranges for interpretation as r (Mair & Wilcox, Citation2020).
In the case of robust repeated measurement methods, we used 2000 bootstrap samples and a default mean trim of 20%. Post-hoc tests are applied with 2000 bootstrap samples as well. To determine the effect of the different groups on the post-test while controlling for the pre-test score, estimated marginal means were calculated. For analyses of covariance, robust linear models with continuous predictors were chosen (Field & Wilcox, Citation2017).
To follow-up on possible significant findings for learning outcomes, moderated mediation models were constructed to test whether a possible relation between group, pre- and post-tests might be mediated by the retention tasks (Tingley et al., Citation2014). Unstandardised indirect effects were computed for each of 2000 bootstrapped samples, and the 95% confidence interval was computed by determining the indirect effects at the 2.5th and 97.5th percentiles.
Analyses were conducted in R 4.0.2 with packages tidyverse (Wickham et al., Citation2019), robustbase (Maechler et al., Citation2020), ggeffects (Lüdecke, Citation2018), WRS2 (Mair & Wilcox, Citation2020) and mediation (Tingley et al., Citation2014), among others.
5. Results
5.1 . Description of pre-intervention baseline and control of group randomisation
In order to analyse the randomisation to the three intervention groups, students’ scores in the pre-test, the cognitive abilities test, and their high school diploma (Abitur) grade were compared to ensure comparable groups prior to the intervention. With regard to the pre-test, neither group differ in their performance, F(2,168) = 0.91, p = .404, η² = .011. Also, the Abitur grades, F(2,166) = 1.17, p = .313, η² = .014, as well as the cognitive abilities scores are comparable between groups, F(2,168) = 0.56, p = .574, η² = .007. These findings indicate comparable conditions for all groups and that the randomisation was apparently successful.
5.2. Treatment effects on students’ retention of the tutorial videos
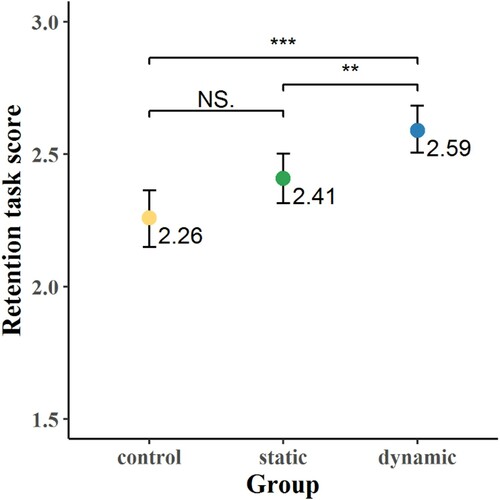
As for the retention tasks, an ANOVA was performed to determine differences between the treatments. The groups differed significantly from each other in the elaborateness of their answers, F(2,168) = 10.75, p < .001, η² = .11. In pairwise comparisons with Bonferroni-adjusted p-values, the control group (M = 2.26) and the static group (M = 2.41) do not differ significantly, t(168) = 2.14, p = .102, r = .16. However, the dynamic group (M = 2.59) has significantly higher mean scores than the control group, t(168) = 4.63, p < .001, r = .34, as well as the static group, t(168) = 2.55, p = .035, r = .19 ().
Figure 4. Retention task scores by group. Points indicate mean-values, error bars 95% confidence intervals. Results of pairwise comparisons are indicated by significance level (NS. p > .05; *p < .05; **p < .01; ***p < .001).
5.3. Treatment effects on students’ knowledge gains
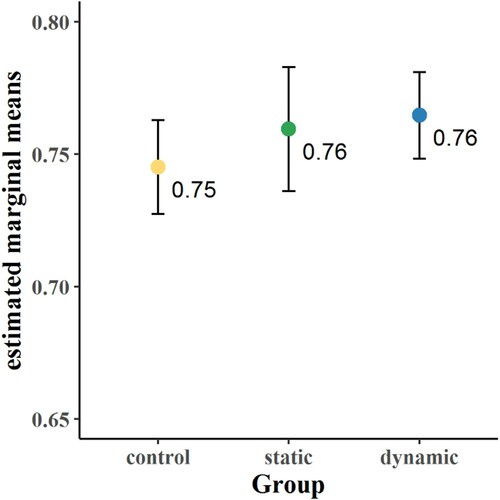
To determine differences in the post-test score by highlighting technique, a robust heteroscedastic one-way ANOVA was performed, since the test assumption of homogeneity of variance was violated. Based on this analysis, the groups reached comparable scores that do not differ significantly, Ft = 1.24, p = .296, ξ = .20 [0.04; 0.40]. Further, estimated marginal means were calculated to determine the effect of the different groups on the post-test while controlling for the pre-test score. After adjustment for the pre-test score, no statistically significant difference in the post-test score between the groups was found ().
Figure 5. Estimated marginal means of the post-test scores after controlling for the pre-test by group. Points indicate mean-values, error bars indicate 95% confidence intervals.
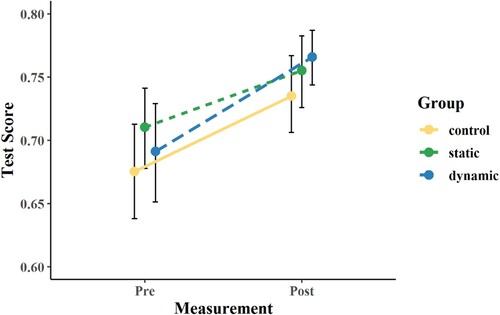
With regard to learning gains from pre to post, a robust repeated measurement analysis of variance was performed, since Levene’s Test indicated heterogeneity of variances. Results suggest a significant increase on the test performance from pre to post measurement across the three groups, Ft = 36.90, Fcrit = 3.57, p < .05 (). Post-hoc tests confirm the significant increase of the trimmed means in each group, .
Figure 6. Test scores from pre to post measurement by group. Points indicate mean-values, error bars indicate 95% confidence intervals.
In the next step of our analysis, we added the pre-test and the retention task scores as covariates to a robust linear model, as we assumed possible interaction effects. Since knowledge of 0 is not an interpretable value, the predictor variables were scaled to a mean of 0 and a SD of 1. Consequently, the reported coefficients (standardised β) can be interpreted in such a way that they reflect the effect of a pre-test score (or a retention score, respectively) that is one standard deviation above the average of the present sample on the post-test score. Also, group membership was dummy coded to compare both the static and the dynamic group to the control group.
The overall model had a large explained variance of R2 = .56 (cf. ). In line with the previous steps of the analysis, no main effect of both the static and the dynamic group was found. However, significant interaction effects were found between the pre-test score and both the static and the dynamic group. Both significant interactions have negative coefficients, which suggests a decrease of the positive effects of the pre-test on the post-test in these two treatment groups (). While the control group participants’ post-test score depends mainly on their pre-test performance (as reflected by the higher slope in ), the relation between pre-test and post-test scores is weakened by the two highlighting techniques.
Figure 7. Interaction effects of the static and dynamic groups with the pre-test score. Error bars indicate 95% confidence intervals.
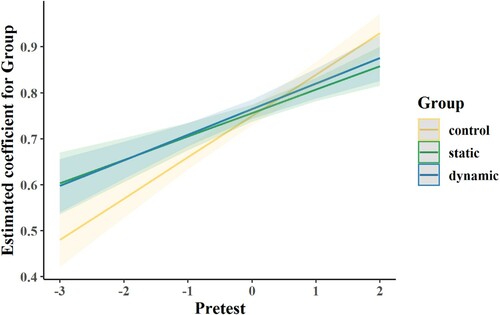
Table 2. Coefficients of the robust linear model.
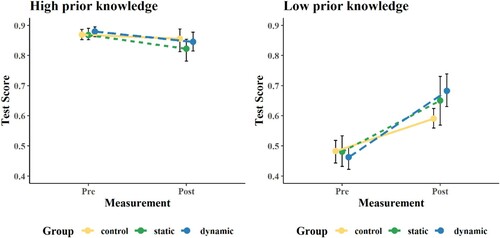
To further inspect the interaction effect of a weakened relation between pre- and post-test in the treatment groups, it was investigated how participants with either high or low prior knowledge scored from pre to post measurement and whether treatment groups differ from each other. Prior knowledge groups were formed based on students’ pre-test performance. Students with scores higher than one standard deviation from the overall mean were assigned to the high prior knowledge group and students below one standard deviation from the overall mean were assigned to the low prior knowledge group. Two ANOVAs were executed to uncover differences in the post-test performance by treatment (). In the case of high prior knowledge students, no differences in the post-test were found, F(2,30) = 0.80, p = .457, η² = .051. For low prior knowledge students, a significant difference is found, F(2,26) = 3.59, p = .042, η² = .216. Pairwise comparisons with Bonferroni-adjusted p-value show significantly higher post-test scores for the dynamic group compared to the control group (t(26) = 2.63, p = .042, r = .458), but no differences between control and static (t(26) = 1.45, p = .478, r = .273) or static and dynamic (t(26) = .76, p = 1, r = .147). Therefore, the results indicate that low prior knowledge is compensated by the corresponding highlighting while these techniques do not hinder high prior knowledge students.
Figure 8. Test scores from pre to post measurement, separated into high prior knowledge students (left) and low prior knowledge students (right) by group. Points indicate mean-values, error bars indicate 95% confidence intervals.
5.4. Moderated mediation analysis
With regard to the temporal course of the data collection (cf. Section 5), we investigated whether the relation between students’ prior knowledge (pre-test) and their knowledge after the intervention (post-test) is mediated by the elaborateness of students’ answers in the retention tasks following each video. Further, we investigated whether this mediation is moderated by the different highlighting techniques in the intervention groups (). The indirect effect was calculated by multiplying the effect of the pre-test on the retention test and the effect of the retention test on the post-test. Further, the significance of this indirect effect was tested using bootstrapping procedures. As depicted in , the regression coefficients between pre-test and post-test and the regression coefficients between retention test and post-test were significant in all three groups. The bootstrapped unstandardised indirect effect was between .037 (control group), .040 (static group), and .050 (dynamic group). As zero is not included in the confidence intervals for the static und dynamic group, it can be concluded that the indirect effect was statistically significant. This does not apply to the control group since the confidence interval ranges from −.002 to .10. Thus, the effect of the pre-test score on the post-test score was partially mediated via the retention test score and these relations were moderated only by the static and dynamic groups. The sequence of results (control < static < dynamic) is in line with the theoretical considerations that went into the study design.
Figure 9. Moderated mediation model for the relations between pre- and post-test mediated through the retention tasks and moderated by the groups.
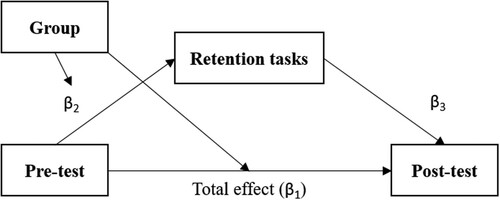
Table 3. Coefficients of moderated mediation model.
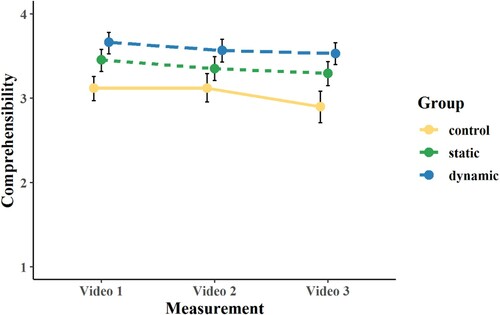
5.5. Students’ perception of the tutorial videos
The last part of the analysis focuses on the evaluation questions after watching the tutorial videos. To determine differences in the perceived comprehensibility across groups for each video, a repeated measurement ANOVA was performed (). While the main effect for the video was neglectable, F(2,340) = 18.19, p < .001, η2 = .01, the main effect for groups was medium to large, F(2,168) = 14,97, p < .001, η2 = .13. To analyse group differences for each video, pairwise comparisons with Bonferroni adjustment were conducted. For video 1, an increase of students’ perceived comprehensibility was observed from the control to the static group (p = .002, r = .26) and from the control to the dynamic group (p < .001, r = .39). No difference was found between the static and the dynamic group (p = .102). In video 2, significant differences between control and dynamic (p < .001, r = .31), but not between control and static (p = .087) and static and dynamic (p = .134) were found. In video 3, pairwise comparisons show significant differences between control and static (p = .002, r = .26), as well as between control and dynamic (p < .001, r = .39), but not between static and dynamic (p = .116). Overall, a similar pattern of results was found in all three videos, albeit with slight differences in the magnitude of the effects of the three treatment conditions on students’ perceived comprehensibility.
Figure 10. Evaluation scale comprehensibility by group across videos. Points indicate mean-values, error bars indicate 95% confidence intervals.
6. Discussion
The main goal of this study was to investigate if purposefully designed highlighting techniques (either static or dynamic) in tutorial videos support students’ visual understanding of chemical representations by explicitly connecting underlying concepts to representations used in organic reaction mechanisms. To compare effects, a randomised controlled trial with three groups (control, static, dynamic) was conducted. Based on comparable pre-test scores, cognitive abilities, and high school diploma (Abitur) grades, the randomisation was successful.
The results of the immediate retention tasks after each tutorial video suggest that a tutorial video with dynamic highlighting might be more beneficial to the learner than the provision of a tutorial video with static or no highlighting. As the retention tasks prompted students to re-narrate the content of the given videos, differences in scores reflect the amount of information that students extracted while watching the videos (cf. ). Dynamic highlighting might have facilitated the process of selecting information and organising it internally (cf. Mayer, Citation2014; Schnotz, Citation2014). Following the multimedia principles of modality and signalling, students’ attention might be constantly navigated towards the relevant features of the representations due to the synchronicity of the verbal explanation and the dynamic highlighting (de Koning et al., Citation2009; Jamet et al., Citation2008; Low & Sweller, Citation2014; Tabbers et al., Citation2004; van Gog, Citation2014). This hypothesis is supported by previous studies, which document that the contiguous processing of a representation is supported by visual cues that draw the participants’ attention to the relevant elements (c.f. Boucheix & Lowe, Citation2010; de Koning et al., Citation2009).
In contrast to the effects of highlighting on direct retention tasks, no main effects of the treatment groups were found on students’ visual understanding in the post-test. Nonetheless, our data indicates significant learning gains from pre to post, i.e. students performed better after the intervention, but indistinguishably better between groups. This might be due to the short intervention duration (½ hour), in which the benefit of the different highlighting techniques may be too little to be sustainably and differentially effective. Also, the effect of the highlighting compared to the verbal explanation might be substantially smaller.
However, one can assume that highlighting might not be equally beneficial for all students. Our data suggests that the effect of learners’ prior knowledge on their learning gains differs between the highlighting conditions, as indicated by significant interaction effects between the pre-test and the two treatments (cf. ). This finding is supported by pre-/post-comparisons for high and low prior knowledge students. While no significant differences in the post-test could be found for high prior knowledge students, in the case of low prior knowledge students, the dynamic group outperformed the control group significantly (cf. ). Following the assumption that the provision of highlighting serves a focusing function, low prior knowledge students seemed to be appropriately supported by the highlighting, while high prior knowledge students were not affected either positively or negatively by the provision of highlighting. It could be assumed that high prior knowledge students are already able to connect the verbal explanation to the visual representation and therefore the highlighting might not have any additional value (Kellman & Massey, Citation2013; Rau, Citation2017). In the case of low prior knowledge, students’ attention might have been guided in a way that helped them to develop a stronger focus on relevant parts of the representation. Thus, this focusing function supports students’ visual understanding, i.e. the ability to select information from external representations, organise them into internal representations and to finally integrate them by mapping the internal representation to domain knowledge (cf. Mayer, Citation2014; Schnotz, Citation2014). This assumption is supported by the finding of a significantly higher comprehensibility, as perceived by the students in the dynamic group compared to the control group (cf. ). This pattern of results is reconcilable with multimedia learning theories (Ainsworth, Citation2006; Mayer, Citation2014; Schnotz, Citation2014) and with the development of representational competencies as described in chemistry education research (Daniel et al., Citation2018; Kozma & Russell, Citation2005; Rau, Citation2017; Stieff et al., Citation2011; Tippett, Citation2016; Treagust et al., Citation2003).
The interpretation of a focusing function is also supported by considerably higher average causal mediation effects in the two treatment conditions. Here, the total effect from pre to post measurement is partly mediated via the retention score. In addition, the mediation is moderated by the static and dynamic highlighting techniques, with the highest proportion mediated in the dynamic group (cf. ).
Although the superiority of dynamic highlighting could not be conclusively clarified, evidence from our data suggests the added value of dynamic highlighting for students’ learning. The effects were mainly small, but substantial in the present sample and in the short duration of the intervention. However, we assume that in some areas of chemistry and other STEM disciplines there might be cases where static cues are equally beneficial as dynamic cues.
In line with previous studies investigating the effects of cues in other disciplines (Boucheix & Lowe, Citation2010; de Koning et al., Citation2009; van Gog, Citation2014), our study shows that the provision of highlighting compared to an un-cued instructional format had beneficial effects on fostering students’ visual understanding of representations. In addition to replicating the benefits of the signalling principle, our study provides evidence that a purposefully scripted explanation, which follows a theory-grounded structure (Caspari et al., Citation2018), increases students’ visual understanding independently from the type of highlighting provided.
7. Limitations
One limitation of the present study lies in the content of the tutorial videos, since nucleophilic substitution reactions are rather introductory in the field of organic chemistry. This limitation is supported by rather high pre-test scores across all groups. However, the case comparison tasks shown in the tutorial videos were a rather new task format for most learners. Therefore, we assume that the purposefully designed mechanistic explanations given in the tutorial videos supported learners in selecting and organising their prior knowledge systematically. Nonetheless, it remains to be observed if our findings are generalisable across other topics in organic chemistry as well as other domains, especially in the field of STEM, where the usage and comprehension of representations are deemed a fundamental competency (Gilbert & Treagust, Citation2009).
Another limitation is the short duration of the intervention. Larger learning gains are potentially possible through more videos, while longer interventions also raise questions in terms of how long this kind of support is beneficial for learning or at which point this support can be faded out. Finally, the question of the confounding effect of content (introductory topic), task format (unfamiliar/unknown) and video format (unfamiliar) arises. These effects affect all groups equally, but could above all influence the level of learning gains.
8. Conclusion and implications
Despite the aforementioned limitations, our results support the application of highlighting in instructional formats and provide evidence that a purposefully designed highlighting fosters student visual understanding. The findings call for quality assurance in instructional formats and attention guidance appropriate to the provided content. Still, it needs to be investigated how tutorial videos of this kind could be included into existing organic chemistry courses or seminars, as there is a reported need for specific instructional material (Popova & Jones, Citation2021). Furthermore, it remains to be systematically observed if highlighting techniques should be provided for all new contents in a lecture or if they might turn into a distractor when advanced learners already possess a certain degree of visual understanding.
Although the effect of signalling is well-documented in the literature, the actual processing and usage of visual highlighting by the learner are not yet fully understood. In order to support learners to profit from visual highlighting, it remains open to what extent visual guidance initiates a purely automatic attentional processing or a rather individual visual orientation that does not strictly follow the visual highlighting. It may as well depend on the complexity of the representation and task format given to the students, which influences students’ reliance on visual cues.
To conclude, our study contributes a step towards overcoming the representation dilemma by supporting students in connecting their partly fragmented ideas of chemical concepts to corresponding representations by implementing beneficial highlighting techniques and purposefully designed explanations into instructions. These instructional tools seem to provide adequate support to students’ visual understanding of reaction mechanisms as a specific type of complex representations, especially in case of students with low prior knowledge. While highlighting was shown to contribute to students’ visual understanding, further research is needed to better understand how students actually process this type of tutorial format in detail.
Supplemental Material
Download MS Word (71.4 KB)Acknowledgements
We thank all co-workers from the Graulich and Parchmann groups who assisted in data collection as well as the students who voluntarily participated in the study. A special thanks to Gyde Asmussen and Axel Langner who supported us throughout the whole project.
Disclosure statement
No potential conflict of interest was reported by the author(s).
Additional information
Funding
References
- Ainsworth, S. (2006). DeFT: A conceptual framework for considering learning with multiple representations. Learning and Instruction, 16(3), 183–198. https://doi.org/https://doi.org/10.1016/j.learninstruc.2006.03.001
- Alfieri, L., Nokes-Malach, T. J., & Schunn, C. D. (2013). Learning through case comparisons: A meta-analytic review. Educational Psychologist, 48(2), 87–113. https://doi.org/https://doi.org/10.1080/00461520.2013.775712
- Anzovino, M. E., & Bretz, S. L. (2015). Organic chemistry students’ ideas about nucleophiles and electrophiles: The role of charges and mechanisms. Chemistry Education Research and Practice, 16(4), 797–810. https://doi.org/https://doi.org/10.1039/C5RP00113G
- Ayres, P., & Sweller, J. (2014). The split attention principle in mutlimedia learning. In R. E. Mayer (Ed.), Cambridge handbooks in psychology. The Cambridge handbook of multimedia learning (pp. 206–226). Cambridge University Press.
- Bhattacharyya, G., & Bodner, G. M. (2005). “It gets me to the product”: How students propose organic mechanisms. Journal of Chemical Education, 82(9), 1402–1407. https://doi.org/https://doi.org/10.1021/ed082p1402
- Bodé, N. E., Deng, J. M., & Flynn, A. B. (2019). Getting past the rules and to the WHY: Causal mechanistic arguments when judging the plausibility of organic reaction mechanisms. Journal of Chemical Education, 96(6), 1068–1082. https://doi.org/https://doi.org/10.1021/acs.jchemed.8b00719
- Boucheix, J.-M., & Lowe, R. K. (2010). An eye tracking comparison of external pointing cues and internal continuous cues in learning with complex animations. Learning and Instruction, 20(2), 123–135. https://doi.org/https://doi.org/10.1016/j.learninstruc.2009.02.015
- Bruice, P. Y. (2016). Organic chemistry + mastering chemistry with Etext (8th ed.). Prentice Hall.
- Caspari, I., Kranz, D., & Graulich, N. (2018). Resolving the complexity of organic chemistry students’ reasoning through the lens of a mechanistic framework. Chemistry Education Research and Practice, 19(4), 1117–1141. https://doi.org/https://doi.org/10.1039/C8RP00131F
- Chi, M. T. H., Bassok, M., Lewis, M. W., Reimann, P., & Glaser, R. (1989). Self-explanations: How students study and use examples in learning to solve problems. Cognitive Science, 13(2), 145–182. https://doi.org/https://doi.org/10.1207/s15516709cog1302_1
- Clayden, J., Greeves, N., & Warren, S. G. (2012). Organic chemistry (Second ed.). Oxford University Press.
- Cohen, J. (1988). Statistical power analysis for the behavioral sciences (2nd ed.). L. Erlbaum Associates.
- Cooper, M. M., Corley, L. M., & Underwood, S. M. (2013). An investigation of college chemistry students’ understanding of structure-property relationships. Journal of Research in Science Teaching, 50(6), 699–721. https://doi.org/https://doi.org/10.1002/tea.21093
- Daniel, K. L., Bucklin, C. J., Leone, E. A., & Idema, J. (2018). Towards a definition of representational competence. In K. L. Daniel (Ed.), Towards a framework for representational competence in science education (pp. 3–11). Springer International Publishing.
- de Koning, B. B., Tabbers, H. K., Rikers, R. M. J. P., & Paas, F. (2009). Towards a framework for attention cueing in instructional animations: Guidelines for research and design. Educational Psychology Review, 21(2), 113–140. https://doi.org/https://doi.org/10.1007/s10648-009-9098-7
- Ferguson, R., & Bodner, G. M. (2008). Making sense of the arrow-pushing formalism among chemistry majors enrolled in organic chemistry. Chemistry Education Research and Practice, 9(2), 102–113. https://doi.org/https://doi.org/10.1039/B806225K
- Field, A. P., & Wilcox, R. R. (2017). Robust statistical methods: A primer for clinical psychology and experimental psychopathology researchers. Behaviour Research and Therapy, 98, 19–38. https://doi.org/https://doi.org/10.1016/j.brat.2017.05.013. http://www.sciencedirect.com/science/article/pii/S0005796717301067
- Gentner, D. (1989). The mechanisms of analogical learning. In S. Vosniadou & A. Ortony (Eds.), Similarity and analogical reasoning (pp. 197–241). Cambridge University Press.
- Gilbert, J. K., & Treagust, D. (2009). Models and modeling in science education. Vol. 4: Multiple representations in chemical education (1st ed.). Springer.
- Graulich, N. (2015a). The tip of the iceberg in organic chemistry classes: How do students deal with the invisible? Chemistry Education Research and Practice, 16(1), 9–21. https://doi.org/https://doi.org/10.1039/C4RP00165F
- Graulich, N. (2015b). Intuitive judgments govern students’ answering patterns in multiple-choice exercises in organic chemistry. Journal of Chemical Education, 92(2), 205–211. https://doi.org/https://doi.org/10.1021/ed500641n
- Graulich, N., & Schween, M. (2018). Concept-Oriented task design: Making purposeful case comparisons in organic chemistry. Journal of Chemical Education, 95(3), 376–383. https://doi.org/https://doi.org/10.1021/acs.jchemed.7b00672
- Grove, N. P., Cooper, M. M., & Rush, K. M. (2012). Decorating with arrows: Toward the development of representational competence in organic chemistry. Journal of Chemical Education, 89(7), 844–849. https://doi.org/https://doi.org/10.1021/ed2003934
- Heller, K. A., & Perleth, C. (2000). KFT 4 - 12 + R: Kognitiver Fähigkeitstest für 4. bis 12. Klassen, Revision [KFT 4 - 12 + R: Cognitive ability test for grades 4 to 12, revision]. Beltz.
- Hilton, A., & Nichols, K. (2011). Representational classroom practices that contribute to students’ conceptual and representational understanding of chemical bonding. International Journal of Science Education, 33(16), 2215–2246. https://doi.org/https://doi.org/10.1080/09500693.2010.543438
- Jamet, E., Gavota, M., & Quaireau, C. (2008). Attention guiding in multimedia learning. Learning and Instruction, 18(2), 135–145. https://doi.org/https://doi.org/10.1016/j.learninstruc.2007.01.011
- Jeung, H-J, Chandler, P., & Sweller, J. (1997). The role of visual indicators in dual sensory mode instruction. Educational Psychology, 17(3), 329–345. https://doi.org/https://doi.org/10.1080/0144341970170307
- Johnstone, A. H. (1982). Macro- and microchemistry. School Science Review, 64(227), 377–379.
- Kellman, P. J., & Massey, C. M. (2013). Perceptual learning, cognition, and expertise. In B. H. Ross (Ed.), The psychology of learning and motivation (pp. 117–165). Elsevier.
- Kozma, R. B. (2020). Use of multiple representations by experts and novices. In P. van Meter, A. List, D. Lombardi, & P. Kendeou (Eds.), Educational psychology handbook series. Handbook of learning from multiple representations and perspectives (pp. 33–47). Routledge, Taylor & Francis Group.
- Kozma, R., & Russell, J. (1997). Multimedia and understanding: Expert and novice responses to different representations of chemical phenomena. Journal of Research in Science Teaching, 34(9), 949–968. https://doi.org/https://doi.org/10.1002/(SICI)1098-2736(199711)34:9<949::AID-TEA7>3.0.CO;2-U
- Kozma, R., & Russell, J. (2005). Students becoming chemists: Developing representational competence. In J. K. Gilbert (Ed.), Models and modeling in science education: Vol. 1. Visualization in science education (pp. 121–145). Springer.
- Low, R., & Sweller, J. (2014). The modality principle in multimedia learning. In R. E. Mayer (Ed.), Cambridge handbooks in psychology. The Cambridge handbook of multimedia learning (pp. 227–246). Cambridge University Press.
- Lüdecke, D. (2018). Ggeffects: Tidy data frames of marginal effects from regression models. Journal of Open Source Software, 3(26), 772–776. https://doi.org/https://doi.org/10.21105/joss.00772
- Maechler, M., Rousseeuw, P., Croux, C., Todorov, V., Ruckstuhl, A., Salibian-Barrera, M., … Di Anna Palma, M. (2020). robustbase: Basic Robust Statistics (Version R package version 0.93-6). Comprehensive R Archive Network (CRAN). http://CRAN.R-project.org/package=robustbase
- Maeyer, J., & Talanquer, V. (2013). Making predictions about chemical reactivity: Assumptions and heuristics. Journal of Research in Science Teaching, 50(6), 748–767. https://doi.org/https://doi.org/10.1002/tea.21092
- Mair, P., & Wilcox, R. (2020). Robust statistical methods in R using the WRS2 package. Behavior Research Methods, 52(2), 464–488. https://doi.org/https://doi.org/10.3758/s13428-019-01246-w
- Mayer, R. E. (2014). Cognitive theory of multimedia learning. In R. E. Mayer (Ed.), Cambridge handbooks in psychology. The Cambridge handbook of multimedia learning (pp. 43–71). Cambridge University Press.
- Popova, M., & Jones, T. (2021). Chemistry instructors’ intentions toward developing, teaching, and assessing student representational competence skills. Chemistry Education Research and Practice, 22(3), 733–748. Advance online publication. https://doi.org/https://doi.org/10.1039/D0RP00329H
- Rappoport, L. T., & Ashkenazi, G. (2008). Connecting levels of representation: Emergent versus submergent perspective. International Journal of Science Education, 30(12), 1585–1603. https://doi.org/https://doi.org/10.1080/09500690701447405
- Rau, M. A. (2017). Conditions for the effectiveness of multiple visual representations in enhancing STEM learning. Educational Psychology Review, 29(4), 717–761. https://doi.org/https://doi.org/10.1007/s10648-016-9365-3
- Rau, M. A. (2020). Cognitive and socio-cultural theories on competencies and practices involved in learning with multiple external representations. In P. van Meter, A. List, D. Lombardi, & P. Kendeou (Eds.), Educational psychology handbook series. Handbook of learning from multiple representations and perspectives (pp. 17–32). Routledge, Taylor & Francis Group.
- Rodemer, M., Eckhard, J., Graulich, N., & Bernholt, S. (2020). Decoding case comparisons in organic chemistry: Eye-tracking students’ visual behavior. Journal of Chemical Education, 97(10), 3530–3539. https://doi.org/https://doi.org/10.1021/acs.jchemed.0c00418
- Scheid, J., Müller, A., Hettmannsperger, R., & Schnotz, W. (2018). Representational competence in science education: From theory to assessment. In K. L. Daniel (Ed.), Towards a framework for representational competence in science education (pp. 263–277). Springer International Publishing.
- Schnotz, W. (2014). An integrated model of text and picture comprehension. In R. E. Mayer (Ed.), Cambridge handbooks in psychology. The Cambridge handbook of multimedia learning (pp. 72–103). Cambridge University Press.
- Stieff, M., Hegarty, M., & Deslongchamps, G. (2011). Identifying representational competence with multi-representational displays. Cognition and Instruction, 29(1), 123–145. https://doi.org/https://doi.org/10.1080/07370008.2010.507318
- Strickland, A. M., Kraft, A., & Bhattacharyya, G. (2010). What happens when representations fail to represent?: Graduate students’ mental models of organic chemistry diagrams. Chemistry Education Research and Practice, 11(4), 293–301. https://doi.org/https://doi.org/10.1039/C0RP90009E
- Tabbers, H. K., Martens, R. L., & van Merriënboer, J. J. G. (2004). Multimedia instructions and cognitive load theory: Effects of modality and cueing. British Journal of Educational Psychology, 74(1), 71–81. https://doi.org/https://doi.org/10.1348/000709904322848824
- Taber, K. S. (2009). Learning at the symbolic level. In J. K. Gilbert & D. Treagust (Eds.), Models and modeling in science education: Vol. 4: Multiple representations in chemical education (1st ed., pp. 75–105). Springer.
- Taskin, V., & Bernholt, S. (2014). Students’ understanding of chemical formulae: A review of empirical research. International Journal of Science Education, 36(1), 157–185. https://doi.org/https://doi.org/10.1080/09500693.2012.744492
- Tindall-Ford, S., Chandler, P., & Sweller, J. (1997). When two sensory modes are better than one. Journal of Experimental Psychology: Applied, 3(4), 257–287. https://doi.org/https://doi.org/10.1037/1076-898X.3.4.257
- Tingley, D., Yamamoto, T., Hirose, K., Keele, L., & Imai, K. (2014). Mediation: R package for causal mediation analysis. Journal of Statistical Software, 59(5), 1–38. https://doi.org/https://doi.org/10.18637/jss.v059.i05
- Tippett, C. D. (2016). What recent research on diagrams suggests about learning with rather than learning from visual representations in science. International Journal of Science Education, 38(5), 725–746. https://doi.org/https://doi.org/10.1080/09500693.2016.1158435
- Treagust, D., Chittleborough, G., & Mamiala, T. (2003). The role of submicroscopic and symbolic representations in chemical explanations. International Journal of Science Education, 25(11), 1353–1368. https://doi.org/https://doi.org/10.1080/0950069032000070306
- Treagust, D. F., Duit, R., Joslin, P., & Lindauer, I. (1992). Science teachers’ use of analogies: Observations from classroom practice. International Journal of Science Education, 14(4), 413–422. https://doi.org/https://doi.org/10.1080/0950069920140404
- van Gog, T. (2014). The signaling (or cueing) principle in multimedia learning. In R. E. Mayer (Ed.), Cambridge handbooks in psychology. The Cambridge handbook of multimedia learning (pp. 263–278). Cambridge University Press.
- Weinrich, M. L., & Talanquer, V. (2015). Mapping students’ conceptual modes when thinking about chemical reactions used to make a desired product. Chemistry Education Research and Practice, 16(3), 561–577. https://doi.org/https://doi.org/10.1039/C5RP00024F
- Wickham, H., Averick, M., Bryan, J., Chang, W., McGowan, L., François, R., … Yutani, H. (2019). Welcome to the Tidyverse. Journal of Open Source Software, 4(43), 1686–1691. https://doi.org/https://doi.org/10.21105/joss.01686