
ABSTRACT
Understanding mechanisms underpinning formation of convection currents is pivotal for developing explanations of plate tectonics when teaching Geoscience topics. While student generated diagrams explaining convection currents may be used to evaluate student conceptual understanding and alternative conceptions in this topic, students may need support to produce elaborated explanatory diagrams. This study investigates the affordances of dialogue with peers and knowledgeable others as students construct explanatory diagrams of convection current formation and plate movement. Grade 8 students (n = 37) participated in small group and whole class discussions to construct explanations of plate movements at divergent boundaries and then drew diagrams to elaborate their understanding of this phenomenon. Throughout the process students were encouraged to mentally engage with the drawing process through discussions with peers and teachers. The drawing process provided opportunities for teachers to identify alternative conceptions that were not evident in teacher-student dialogic interactions but were evident in diagrams and to encourage consideration of scientific explanations through use of probing questions about what students were representing. The drawing process also elicited discussions between peers about complex interactions occurring within the mantle, during which some students became aware of inconsistencies within their explanations which led to adoption of more scientifically accurate conceptions.
Introduction
Geoscience topics such as plate tectonics and the rock cycle are taught in middle school (Grades 6–9: 11–15 year olds) in countries such as Australia, England and the USA (ACARA, Citation2016; Department_for_Education, Citation2013; NGSS, Citation2013). However, to understand the underlying causes of plate tectonics, students must integrate concepts learned in physics and chemistry, such as density, pressure, energy transfer, temperature and the kinetic theory of matter in order to be able to produce causal explanations for these huge movements over long periods of time (Conrad & Libarkin, Citation2022; Orion & Libarkin, Citation2014). Even students studying Geoscience at university level find it difficult to explain the formation of convection currents in the mantle and to construct an understanding of the complex and dynamic processes driving rock formation and change (Libarkin & Kurdziel, Citation2006; Orion & Libarkin, Citation2014; Raia, Citation2008). In a previous article we described the ways that middle school students’ explanatory diagrams about plate tectonics can be used to understand how they make sense of the underlying causes of these dynamic processes occurring within the Earth (McLure et al., Citation2021). However, how can teachers use the affordances of student generated explanatory diagrams more productively to support them in constructing conceptual understanding of these complex and dynamic processes?
When learning about plate tectonics in middle school, students progress from a static understanding of plates towards an understanding which involves dynamic processes that integrate the movements of convection currents in the mantle due to heating from the core with formation and destruction of crust material at plate boundaries (McDonald et al., Citation2019). Students who have constructed understanding at the highest learning progression are able to explain the formation of convection currents in terms of heat transfer to produce density differences and changes in buoyancy. However, very few students (<5%) were able to construct explanations of plate movements at this highest learning progression (McDonald et al., Citation2019). This may be because Geoscience is often taught in middle school as a series of lessons describing conditions for the formation of different types of rocks (sedimentary, igneous, metamorphic) without firstly addressing the underlying dynamic earth system which drives these changes. McDonald et al. (Citation2019) suggest that teaching of Earth science should begin by introducing students to the fundamental drivers of these dynamic processes. However, if constructing understanding of convection currents is challenging for university students, developing understanding of the complex interactions occurring in the mantle can be even more challenging for middle school students.
In order to support students to construct such understanding we adopted a dialogic approach combined with production of student-generated explanatory diagrams to teach this topic. Many studies have shown the benefits of student-generated diagrams to help students reason about scientific phenomena (Fan, Citation2015; Leopold & Leutner, Citation2012; Tippett, Citation2016; Tytler et al., Citation2020). For instance, Gobert (Citation2005) found that the affordances of student-generated diagrams resulted in students using deeper processing skills than when writing summaries about plate tectonics. Additionally, encouraging students to construct a series of complex explanatory diagrams which represent macroscopic, microscopic and sub-microscopic processes supports students in developing a more complex understanding of the inter-relatedness of entities and processes (McLure et al., Citation2021, Citation2022; Tytler et al., Citation2018). Student-generated explanatory diagrams also benefit students who do not possess the literacy skills and scientific vocabulary to successfully express their scientific understanding by giving them an alternative means of expressing their understanding (Chang et al., Citation2020). Likewise, students’ diagrams enable teachers to become aware of alternative conceptions that students hold, that may not be evident when students only provide verbal or written explanations (Chang et al., Citation2020; McLure et al., Citation2021).
However, students need teacher support in producing and refining explanatory diagrams of scientific phenomena, otherwise, in our experience, students tend to simply draw superficial macroscopic features or produce non-explanations in their diagrams (McLure et al., Citation2022). What features of dialogic interactions between teachers and students and between students themselves are productive in encouraging students to produce explanatory drawings that include more complex inter-relations between macroscopic, microscopic and sub-microscopic aspects of a phenomenon? How does the production of explanatory drawings support student-student dialogic interactions?
Gillies (Citation2016) describes the types of dialogic interactions that can occur in collaborative small groups when students are trained to use linguistic tools such as cognitive questioning. She categorised these interactions as statements, challenges, elaborations or explanations, open questions, closed questions and short responses. However, studies have shown that students do not usually pursue explanations, draw on prior knowledge or engage in discourse to give justifications for conclusions without external support or guidance (Chin et al., Citation2000; King, Citation2002).
When the focus turns to teacher-student discourse, many studies have found that teachers most often follow an initiation-response-evaluation (IRE) format (sometimes described as information-response-feedback) which does not encourage students to engage with cognitively challenging questions or make complex links between aspects of prior learning (e.g. Galton et al., Citation1999; Howe & Abedin, Citation2013). In addition, this form of classroom dialogue does not allow teachers to diagnose students’ alternative conceptions (Alexander, Citation2008). On the other hand, dialogic teaching probes students’ thinking by asking higher-order questions, encourages students to share ideas and consider alternatives, involves longer, reciprocal interchanges between teachers and students and encourages students to attend to other students’ contributions (Alexander, Citation2018).
Productive dialogic discourse has been studied in the Science classroom (Bansal, Citation2018; Tytler & Aranda, Citation2015) including in cooperative inquiry lessons (Gillies, Citation2016). While much dialogue in the science classroom is authoritative and follows the IRE pattern, more productive dialogic discourse led by expert teachers tends to follow a more open-ended pattern, such as Interrogation-Response-Follow-on (IRF) (Tytler & Aranda, Citation2015). This results in long chains of discursive moves, such as IRPRPRPRPR, which involve the teacher encouraging the student/s to elaborate or refine their explanations by using prompt (P) questions (Mortimer & Scott, Citation2003). By challenging students to extend their thinking, such dialogic discourse between teacher and student results in higher-order explanations from students (Bansal, Citation2018; Tytler & Aranda, Citation2015).
However, the kinds of productive discourse that occurs when students produce diagrams to construct their understanding have had less attention in the literature. Adams et al. (Citation2020) studied discursive moves of one secondary teacher around visual representations in science classrooms and found that the teacher used an interactive/authoritative approach to support students in extending their reasoning and refining the representations that they produced. However, there are few, if any, studies which investigate the effects of both student-student discourse and IRF teacher-student discourse on student generated diagrammatic explanations, nor the effects of producing those drawings on student-student discourse. This study aims to fill this gap.
Research question:
What productive interactions are observed between student-student and teacher-student dialogic interactions and the affordances of student generated explanatory drawings as students construct a series of diagrams to explain plate tectonics?
Methods
Context and participants
Two teachers and their Grade 8 Science classes (13–14 years of age) from a Western Australian government school who were engaged with an Earth Science unit (ACARA, Citation2015) investigating mantle convection and rock formation agreed to participate in this research. Both classes were of mixed ability. 37 of a total of 51 students and their parents from the two classes (22 and 15) gave informed consent for their drawings and discussions to be included in this research prior to data collection. Following provision of training in implementation of a drawing-based teaching strategy, including questioning strategies, described below, the teachers implemented this strategy with their students in five lessons: understanding convection currents as the driver of large-scale tectonic movements, the formation of sedimentary rocks, igneous rock formation processes, metamorphic rock formation processes, and the rock cycle. Prior to this unit, students had learned about the differences in particle movement in solids, liquids and gases based on the kinetic theory of matter, the concept of density, and the relationship between heat and particle movement.
Lesson
This paper focuses on the introductory lesson in which students developed models to explain the way in which convection currents in the mantle result in the formation of divergent plates at the mid-ocean ridge. An earlier paper (McLure et al., Citation2021) described this lesson and the ways in which students’ drawings can be used to understand how they make sense of the formation of convection currents. Following on from these findings, we focus on the ways in which dialogic interactions as students produce explanatory drawings, influence student understanding and the drawings they produced and how the affordances of producing explanatory drawings interact with student-student dialog to form new explanatory models.
The introductory lesson, on which this paper focuses, asked students to respond to a guiding question: How does convection in the mantle explain the movement of ocean crusts and why does a new ocean crust layer form at the mid-ocean ridge? The structure of each Geoscience lesson was based on the Thinking Frames Approach (McLure et al., Citation2020; Newberry et al., Citation2011). Students were placed in small groups which were determined at the beginning of the unit of work and which remained stable throughout. Within each small group students produce verbal explanations of their observations of convection currents forming in a tank of water, highlighted by the movement of coloured dyes and relate this to the overarching question explaining plate movement. They were then asked to present their explanations to the whole class and the teacher used questioning strategies to elicit more elaborated explanations and to challenge alternative conceptions. This whole-class discussion continued until students produced a scientific explanation of movement of tectonic plates based on their observations of formation of convection currents in water. Students were then directed to work within their small groups to individually construct explanatory drawings. The time allocated for the lesson was 60 min, during which students spent 15–20 min individually constructing a series of diagrams in response to four sub-questions scaffolding students’ drawings: Why do convection currents form in the mantle? Why do the plates get pushed apart? What happens at the mid-ocean ridge? What happens to the whole ocean crust over long periods of time? Teachers moved from group to group asking questions and encouraging greater elaboration through diagrams.
Data collection
Ethics approval was obtained before data collection commenced. Video and audio recordings of whole-class and small group interactions throughout the lesson were obtained from those who had given consent. In addition, worksheets from 37 students from the two participating classes were collected and analysed. A purposeful sample of participating students and the teachers were also interviewed at the end of the Geoscience unit using a semi-structured interview protocol to understand their perspectives about the learning experience.
Analysis
The focus of this paper is on two types of dialogic interactions: student-student interactions and teacher questioning of students about their drawings while they worked in their small groups. However, in order to understand these interactions in context, summaries of student-student interactions, as they develop initial verbal models of plate movements due to convection currents and teacher-student dialogic interactions during whole class discussions where initial explanations were presented and probed were made. The focus of the analysis was on the ways in which these dialogic interactions affect student decisions about what to draw, what to change in the diagrams and the ways in which the affordances of drawing itself influenced student discussions and conceptual understanding. Discourse moves were identified based on analysis frameworks developed by Mortimer and Scott (Citation2003) and summarised by Tang (Citation2021).
Video recordings of small groups were transcribed (together with audio recordings where video audio was unclear). Beside the transcriptions of verbal discourse, notes were taken about relevant gestures and body movements. In addition, drawing actions that were observed were described at each point in the discourse. Interactions between verbal dialogue, gestures and drawing elements were then analysed to understand the interplay between student-student dialogue and explanatory drawing, and teacher – student questioning and explanatory drawing in developing student understanding of plate tectonics. In order to understand the experience that students had while drawing explanatory diagrams and the dialogic interactions that occurred during the lesson, one group was chosen to illustrate interactions during the drawing task. This group (Group 6) was chosen because of the clarity and number of the verbal interactions between the group members as they were drawing and consisted of three students: Nadene (female), Caroline (female), Andrew (male).
Results
In response to the research questions, dialogic interactions (verbal utterances, gestures and diagrams) produced during each phase of the lesson were analysed. The drawing phase of the lesson followed initial student-student dialogic interactions (5 min) in their small groups where students were asked to develop explanations for the overarching question: how convection in the mantle explains the movement of ocean crusts and why a new ocean crust layer forms at the mid-ocean ridge. The dialogue between students in Group 6 (and in other groups) consisted mainly of tentative statements, questions which were not answered and lengthy pauses. Nadene suggested that, ‘when the mantle rises to the top it pushes the crust around’ which she showed with clockwise and anti-clockwise hand movements. However, this was not elaborated on by either of the other students, although Caroline thought that it might happen under water. Andrew was uncertain (shrugged) and didn’t contribute to the discussion.
In the whole class discussion that follows, students from each group presented their ideas to the class. The teacher led the discussion by initiating (I) the discussion with questions about what explanations students had developed (e.g. ‘What did you guys discuss today?’). Students then respond (R) (e.g. Group 1: ‘The mantle – the hottest part rises and then causes the plates to move’). The teacher then used a follow-on question (F) which either probed the student’s explanation (e.g. ‘Okay, where does the heat come from?’) or asks students to extend their explanations (e.g. ‘Flows? In which direction does it flow?’). These questions were often in conjunction with the teacher paraphrasing what students had contributed to the explanation so far (e.g. ‘And you said that it causes the plates to move. Did you elaborate on that at all? … Not yet?’). Less frequently the teacher evaluated (E) the student’s explanation, but then posed a follow-on question (F) to extend or probe explanations (e.g. ‘It does form the mid ocean ridge. And you're saying that because of the magma rising?’). Throughout the dialogue a scientific explanation was constructed as students from one group built on the explanations presented and elaborated by other groups. Despite not engaging in the initial small group discussion, Andrew presented an explanation for the movement of the plates based on the movement in opposite directions of currents in the magma for Group 6. He suggested that the collision of the currents causes the magma to rise. Other concepts highlighted in the discussion by other groups were: the core heats the mantle to form currents with material flowing upwards; heating particles makes them move faster and take up more volume – decreasing the density; magma cools as it rises and becomes denser and then moves back downwards to be heated again; and molten material at the mid-ocean ridge is pushed out and solidifies to form new crust. Based on the whole class discussion, it would appear that elements of a verbal scientific explanation of sea-floor spreading were elicited as a result of teacher questioning. However, the whole class discussion did not include dialogue about subduction at the other side of the plate. It was also unclear how well students were listening and absorbing the information elicited by the teacher from other groups. However, because the interaction flows from group to group, students had to be alert and listen to their peers so that they could respond when asked follow-on questions.
In the drawing phase of the lesson, which is the focus of this paper, students drew explanatory diagrams to explain the answers to each of four guiding questions. They continued to work in their small groups but produced individual diagrams. The dialogue between students, and between teacher and students, gestures and drawing actions are presented in and the diagrams that students produced for each question are presented together with the dialogue.
Table 1. Guided lesson question #1.
Table 2. Guided lesson question #2.
Table 3. Guided lesson question #3.
Table 4. Guided lesson question #4.
Why do convection currents form in the mantle?
and (a–c) present the student-student and student-teacher dialogues and diagrams produced in response to the first guiding question: Why do convection currents form in the mantle?
Figure 1. (a) Andrew (b) Caroline (c) Nadine.
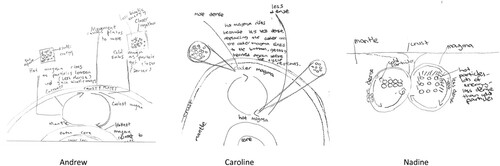
In the first part of the student-student dialogue (turns 1–3), Caroline and Andrew quickly drew the sections of the inner Earth, showing core, mantle and crust. Nadine, however, simply drew a line to represent the crust and indicated that below the line was mantle made of magma. She did not include the core and clearly did not consider the importance of the heat from the core in her explanation. In their initial discussion, Caroline and Andrew adopted one simple concept from the whole-class discussion, namely that the mantle is hotter near the core than the crust. While Caroline initially mentioned that cool magma is more dense, at this point, none of the students incorporated particles or density into their drawings. Caroline and Andrew simply wrote ‘hot magma’ and ‘cold magma’ on their diagrams. Nadine, on the other hand, focused on her first explanation which she gave during the initial student-student dialogic interaction at the beginning of the lesson, that is, that the mantle rises to the top and moves the crust around. She seemed satisfied with a simple explanation, drawing overlapping circles to represent currents without including particles.
In the next part of the discussion (turns 4–7), Caroline and Andrew added in another concept, that was raised in the whole class discussion, into their verbal and diagrammatic explanations: distance between particles (density) related to temperature. In turn 4, Caroline, who had already labelled the magma near the core as hot and the magma near the crust as cold, suddenly recognised that the colder magma will be denser (turn 4). Before thinking about how to incorporate density into her drawing it seems that she hadn’t really understood the effect of temperature on density, despite having verbalised this in turn 1 and having listened to the whole-class discussion about density and temperature which highlighted that particles that are hotter have more energy and move faster and hence are further apart. Caroline looked to Andrew for confirmation of her new understanding (turn 4).
The dialogue that followed turn 4 illustrates the complexity introduced into the explanation by the existence of a third concept – increasing pressure with depth in the mantle. Andrew pointed to the mantle near the core and speculated that there would be ‘stronger bonds’ between particles there. Even though neither mentioned the increased pressure near the core, both Andrew and Caroline seem to recognise this problem as they looked at their drawings and suggested that the particles are closer together near the core, even though these particles are hotter than those near the crust (turns 5 & 6). Andrew initially attributed higher density to stronger bonds between particles close to the core but then challenged and discarded this idea, possibly because there was no discussion of increasing pressure with depth during the whole-class discussion. Andrew’s response in turn 7 challenged Caroline’s assertion in turn 6 that particles near the core are closer together and moved the dialogue back to the relationship between density and temperature, ignoring the effects of pressure. This is consistent with the earlier whole class discussion, and both Caroline and Andrew (and later Nadene) choose to adopt a simplified explanation of changes in density related solely to temperature. Andrew then added in particles to his diagram to show cooler particles near the crust with greater density (closer together) and hotter particles further apart, although differences in spacing are difficult to see in his diagram.
In turns 8–15 the teacher joined Group 6 and used initiating (I) questions based on her understanding of the students’ diagrams to begin discussions which encouraged students to extend their explanations. Students responded (R) to her questions and she followed on (F) with questions to elicit development of another chain of reasoning in students’ explanations – increased temperature increases kinetic energy (KE) of particles which in turn results in greater spacing between particles.
Teacher questioning is instrumental, in this case, for the elaboration of students’ explanations of changing density related to temperature by encouraging students to consider the effects of temperature on particle motion. The teacher firstly looked at Andrew’s drawings and interprets the diagram as – particles are close together when colder (turn 8). She then asked a follow-on question to extend Andrew’s explanation in terms of what happens to particles when they are heated up. As a result, Andrew then described the increase in KE with temperature both verbally and in his drawings of particles (turn 9). Likewise, Caroline further elaborated Andrew’s explanation by adding that they vibrate more and she showed this with her hands, indicating that this pushes the particles apart (turn 10). However, although Caroline then added in particles with different arrangements into her diagram, depending on temperature, she chose not to add in any indication of changes in KE (b). Andrew, however, added in small lines into his drawing of particles in the hotter magma and wrote that they have kinetic energy and are far apart (a). However, he did not add in any lines to the cooler particles but simply wrote that they have less KE, possibly indicating that he thought that they are not vibrating.
The teacher’s attention then turned to Nadene (turn 11) who had remained silent up until that time, but who had drawn particles that are hotter closer together than the cooler particles. The teacher asked Nadene to explain the arrangement of the particles, which Nadene received as a challenge to her thinking. It is clear that, despite the whole-class discussion and Andrew and Caroline’s discussions, up until this time she had not adopted a scientific understanding of the relationship between temperature and density. However, following the teacher’s question, Nadene changed her drawing of particles to align with the preceding discussions. The teacher then asked a follow-on question to probe the source of the change in Nadene’s understanding (turn 14). Rather than responding verbally, Nadene added in lines to indicate increased KE around the ‘hot’ particles and added in some words to indicate the effect on density (c). Like Andrew, she did not add in lines to suggest vibrations of the cooler particles.
In response to the first guiding question, both Caroline and Andrew only drew one current to illustrate the changes in density with temperature, whereas Nadene started by drawing two opposing currents. This is consistent with her explanation for plate movement in the initial student-student dialogue (‘So, I guess like when the mantle rises to the top it moves it around and then it pushes the crust around’ ‘It rises up, and then it cools down. And then it pushes the crust’).
Why do the plates get pushed apart?
and (a–c) present the student-student dialogue and diagrams produced in response to the second guiding question: Why do plates get pushed apart?
Figure 2. (a) Andrew (b) Caroline (c) Nadine.
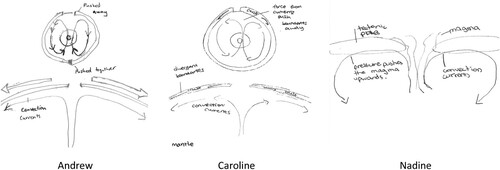
The discussion moves on to the second guiding question in turns 16–24. As Caroline read the second guiding question, she realised (turn 16) that there must be more than one current in the mantle and that they act on the plates. She also saw that Nadene had drawn two currents. She then produced a preliminary explanation relating magma movement and crustal movement by adding in two currents below the crust. However, she drew them both going clockwise (turn 16), so it is clear that she hadn’t understood or taken onboard Nadene’s explanations in the initial student-student dialogue or Andrew’s and others’ explanations of opposing currents given during the whole class, teacher-guided discussion (Andrew: ‘I guess a current would be in one direction – the direction maybe is multiple so they go against each other.’ Other student: ‘because of two different temperatures which caused the convection currents to move in the circle – current. And then they would be like gears and pushing them out from each other and so they drag the plates with them’). It is only as Caroline attempted to draw an explanation that inconsistencies between her initial explanation and the observations of plate movement become evident to her. In turn 17 Caroline experienced some cognitive conflict when her hand gestures representing the movement of the two currents were not consistent with her drawing of plates moving apart. Interestingly, Andrew trusts Caroline’s explanation showing currents going in the same directions (turn 18), despite having given a verbal explanation during the whole class discussion which involved currents going in opposite directions. In turn 19, Andrew reviewed his diagram and compared this to his verbal explanation of the direction of the currents. This introduced cognitive conflict as he recognised that his diagram is inconsistent with the plates being pushed apart.
Likewise, in turns 20–21 Caroline looked at her drawings and recognised that having two currents going in the same direction doesn’t result in the plates being pushed apart. Therefore, she used her diagram to test what would happen if the currents were going in opposing directions and whether this would result in diverging plates. She thus used her diagram to resolve the cognitive conflict that she was experiencing in turn 17. In turn 22, she then looked at Andrew’s drawing and described the changes she had made in her diagrams to him. As Andrew watched her gestures, he suddenly understood why the currents must go in opposing directions and added this into his own diagram. Although both Andrew and Caroline recognised the relationship between the movement of the currents and the plates at this point, both drew only two currents in the whole mantle and seemed to think that these pass through the core (a and b).
Nadene, on the other hand, seemed to have recognised from the start that the currents must oppose one another. She drew counter currents which seem to be dragging the crust apart, she introduced a new concept into her explanation, namely that pressure from an unnamed source is pushing the magma up (c). It may be that she saw the upward movement due to density differences in the magma as this source of pressure.
What happens at the mid-ocean ridge?
and (a–c) present the student-student dialogue and drawings produced in response to the third guiding question: What happens at the mid-ocean ridge?
Figure 3. (a) Andrew (b) Caroline (c) Nadine.
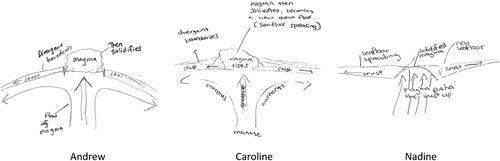
Turns 25–29 focused on the third guiding question about what is happening to the crust at the mid-open ridge. Caroline starts the discussion by making a propositional statement explaining the formation of new crust material at the ridge in terms of upward pressure from the magma pushing magma out between the gap in the crust, which then cools and solidifies as it comes into contact with cooler water. She then represented this verbal explanation by drawing a gap in the crust and new rock material forming at the mid-ocean ridge due to the convection currents moving mantle material upwards (turn 27, b). Andrew (a) and Nadene (c) adopted much of Caroline’s explanation in their diagrams.
What happens to the whole ocean crust over long periods of time?
and (a–c) present the student-student dialogue and drawings produced in response to the fourth guiding question: What happens to the whole ocean crust over long periods of time?
Figure 4. (a) Andrew (b) Caroline (c) Nadine.
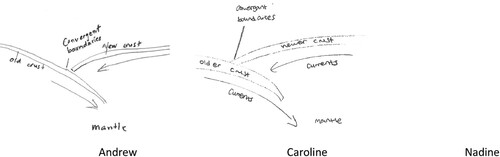
Finally, Caroline and Andrew considered what is happening at the other side of the plate. Due to understanding that they constructed in response to guiding question two, about the relationship between movement of plates related to currents moving in opposite directions, they are quite rapidly able to reason, using their drawings, that the currents will move towards each other to form a convergent boundary (turn 30). At this stage, however, students are running out of time, so there is limited discussion and Nadene is not able to complete her drawing for guiding question four.
Discussion
Apart from one small case study of one teacher’s discursive moves while their class produced scientific drawings (Adams et al., Citation2020), limited attention has been paid to the dialogic interactions that occur between students and to support students as they draw to explain, nor of the ways in which the process of drawing influences dialogic interactions between students. In this study, we analysed the dialogic interactions as students transferred their understanding developed through exploratory student-student dialogue and whole class, teacher-led teacher-student dialogic interactions, into explanatory diagrams in small groups.
As observed in other studies which showed that students do not usually pursue explanations, draw on prior knowledge, or engage in discourse to give justifications for conclusions without external support or guidance (Chin et al., Citation2000; King, Citation2002), the initial discussion of the open-ended question at the beginning of the lesson resulted in very limited explanations and limited student-student dialogic interactions. In particular, Andrew gave no verbal input into the discussion and neither he nor Caroline constructed coherent explanations. Nadene introduced one descriptive chain of events for how the movement of the mantle in counter currents pushes the crust apart but did not elaborate this idea. At this point, there was no teacher-student dialogic interaction and no drawing. Nadene appeared to be basing her explanation on observations of convection currents being set up in a tank of water placed over a heat source. However, no mention is made of the heat source driving the formation of the currents in the mantle, nor is there an explanation of why the currents form.
During the whole class discussion, the teacher used expert dialogic moves, specifically IRFRFRFRF, where the follow-on question either probes the concepts presented in students’ explanations or encourages students’ to further elaborate those explanations. She also frequently, summarises what students have said so far by rephrasing student contributions to focus students’ attention on what she believes are the most important points. This strategy is one that Tytler and Aranda (Citation2015) described in productive dialogic discourse led by expert teachers. In this way a scientific causal explanation was synthesised based on the contributions of each group. However, it is impossible to tell at the end of this phase how successfully students have adopted a scientific explanation which contains the elements of temperature change, KE change, density change, buoyancy change to explain the establishment of convection currents which act in opposing directs and result in sea-floor spreading.
It is only as students attempt to transfer their understanding into explanatory diagrams that it becomes evident, both to the students themselves and to the teachers, the extent to which students have comprehended and adopted the scientific explanation. It is evident from the dialogic interactions between Andrew and Caroline that, while they were able to repeat some of the statements elicited during the whole class discussion, they have not really grasped the full implications of these statements. For instance, Caroline repeats the statement that cold material is more dense than hot, yet when she attempts to draw this, she suddenly struggles to understand what this means and why there is a difference between the hot and cold mantle material. Dialogic interactions with Andrew then helped her to clarify the relationship between density and temperature. Andrew stated in a later interview, drawing the explanation led him to focus on one concept and then add in further concepts as he understood the interrelation between these concepts.
This study reveals the pivotal nature of the teacher’s role in supporting student to produce elaborated, complex chains of reasoning both verbally and in diagrams. Students’ initial choices of what to draw in order to produce an explanatory diagram were influenced by the responses elicited from students during the discussion that occurred during the whole class IRFRFRFRF teacher-student dialogue. However, students may have been satisfied with producing one or at most two chains of reasoning in their diagrams if they had not been prompted by a further series of IRFRF interaction with the teacher to form a more complex explanation is essential. Unlike the study of Adams et al. (Citation2020), where the teacher used authoritative dialogic moves when interacting with students about their drawings in order to correct misconceptions or encourage additions to drawings, the teacher did not revert to authoritative dialogue with students when discussing their diagrams. Instead, she firstly looked at students’ drawings and verbalised her interpretation of their pictorial explanations. As the teacher carefully scrutinised the students’ drawings student understanding was made evident, including alternative conceptions that they held. As discussed in our earlier study (McLure et al., Citation2021) this allowed the teacher to address alternative conceptions that might not otherwise have been apparent.
Secondly, the teacher used follow-on questions which either probed or asked students to extend their explanations. By extending the IRFRFRF dialogic interaction to the drawing process, the teacher gave the students opportunities to extend their diagrammatic explanations and recognise where there might be limitations in that explanation. This benefit was observed for all three students. It is interesting to note that, even though Narene had verbally expressed a simple descriptive explanation at the beginning of the lesson, she chose not to verbalise her explanations while drawing, but used her diagrams as the vehicle for explanation. As a result of the IRFRFRF teacher-student dialogue all three students included other concepts that had not been addressed earlier in their drawings, for example by adding in change in density through showing particles close together or further apart or by adding in lines to represent increased KE to explain the decreased density. These concepts may not have been considered or incorporated to make a more complex causal explanation without the teacher engaging in dialogic teaching at this point.
Finally, the process of drawing led students to engage in more productive student-student verbal dialogue. Nadene, was the exception. She continued to draw without contributing to the verbal dialogue, even when the teacher asked her questions. However, it was clear that she was listening to the discussion between the teacher and the other members of her group and hence was able to adopt their explanations quite quickly. As students drew, there was a lot of thinking out loud as they tried to transfer their conceptual understanding into a visual format. As another student noted in his interview, drawing led to more productive thinking and discussion.
In addition, there were several pivotal points, during the drawing phase of the lesson, where transferring conceptual understanding into drawings led to cognitive conflict and students were forced to question their currently held conceptions. This led to more productive dialogue between students as students reasoned using verbal, gestural and diagrammatic modes. In a real sense, the drawing process made some of the alternative conceptions that student held visible to themselves. For instance, Caroline initially drew the convection currents going in the same direction on her drawing and then recognised that this would not result in the observed spreading apart of the plate on the sea-floor. Results from this study suggest that social construction of student-generated visual representations, including purposeful teacher-student questioning strategies, may support students to construct more elaborated and coherent scientific explanations of the dynamic, complex processes of plate tectonics.
Implications for future research
As a result of the findings of this study there are several suggestions we would make for future research.
Further studies of the ways in which productive dialogic interactions between teachers and students may support greater engagement with drawing explanatory diagrams
Further studies of how explicit teaching to students of strategies for having productive dialogic interactions with peers, such as described by Gillies (Citation2016), may have benefits for the production of explanatory drawings
Conclusion
This study follows on from a study of the ways in which students make meaning about the complex scientific phenomenon of plate tectonics through diagrams (McLure et al., Citation2021). This study investigated how teacher-student and student-student dialogic interactions can support students as they engage in the drawing process to produce more elaborated causal explanations. The findings reveal the ways in which students can build on understanding that has begun to be constructed through whole-class teacher-student dialogic teaching as they transfer that understanding into explanatory diagrams. Students initially include one main causal concept in their drawings (e.g. the relationship between temperature and density). It highlights the need for further IRFRF interactions with the teacher in order to help students to clarify and extend their explanations to include other concepts (e.g. the relationship between temperature, KE and density and the formation of opposing currents). The study also highlighted the value of explanatory drawing: as a promoter of productive student-student discussion within a small group; to make visible students’ alternative conceptions; and to introduce cognitive conflict leading to change in student conceptions and the possibility of adopting scientific conceptions.
Ethics statement
Ethics approval was obtained from the Curtin University Human Research Ethics Committee (HRE2018-0114).
Disclosure statement
No potential conflict of interest was reported by the author(s).
Additional information
Funding
References
- ACARA. (2015). Australian Curriculum. https://www.australiancurriculum.edu.au/
- ACARA. (2016). Science. https://www.australiancurriculum.edu.au/f-10-curriculum/science/
- Adams, J., Chin, T. Y., & Tan, P. H. (2020). Talking to learn science: Examining the role of teacher talk moves around visual representations to learn science. Learning, Research and Practice, 6(1), 19–33. https://doi.org/10.1080/23735082.2020.1750671
- Alexander, R. (2008). Essays on pedagogy. Routledge.
- Alexander, R. (2018). Developing dialogic teaching: Genesis, process, trial. Research Papers in Education, 33(5), 561–598. https://doi.org/10.1080/02671522.2018.1481140
- Bansal, G. (2018). Teacher discursive moves: Conceptualising a schema of dialogic discourse in science classrooms. International Journal of Science Education, 40(15), 1891–1912. https://doi.org/10.1080/09500693.2018.1514543
- Chang, H.-Y., Lin, T.-J., Lee, M.-H., Lee, S. W.-Y., Lin, T.-C., Tan, A.-L., & Tsai, C.-C. (2020). A meta-analysis on the relationship between school characteristics and student outcomes in science and maths – evidence from large-scale studies. Studies in Science Education, 56(1), 1–34. https://doi.org/10.1080/03057267.2020.1735758
- Chin, C., O'Donnell, A., & Jinks, T. (2000). The structure of discouse in collaborative learning. The Journal of Experimental Education, 69(1), 77–97. https://doi.org/10.1080/00220970009600650
- Conrad, D., & Libarkin, J. C. (2022). Using conceptual metaphor within the model of educational reconstruction to identify students'alternative conceptions and improve instruction: A plate tectonics example. Journal of Geoscience Education, 70(2), 262–277. https://doi.org/10.1080/10899995.2021.1983941
- Department_for_Education. (2013). Science programmes of study: Key stage 3 national curriculum in England. GOV.UK. https://assets.publishing.service.gov.uk/government/uploads/system/uploads/attachment_data/file/335174/SECONDARY_national_curriculum_-_Science_220714.pdf
- Fan, J. E. (2015). Drawing to learn: How producing graphical representations enhances scientific thinking. Translational Issues in Psychological Science, 1(2), 170–181. https://doi.org/10.1037/tps0000037
- Galton, M., Hargraves, L., Comber, C., Wall, D., & Pell, T. (1999). Changes in patterns of teacher interaction in primary classrooms: 1976-1996. British Educational Research Journal, 25(1), 23–37. https://doi.org/10.1080/0141192990250103
- Gillies, R. M. (2016). Dialogic interactions in the cooperative classroom. International Journal of Educational Research, 76, 178–189. https://doi.org/10.1016/j.ijer.2015.02.009
- Gobert, J. D. (2005). The effects of different learning tasks on model-building in plate tectonics: Diagramming versus explaining. Journal of Geoscience Education, 53(4), 444–455. https://doi.org/10.5408/1089-9995-53.4.444
- Howe, C., & Abedin, M. (2013). Classroom dialogue: A systematic review across four decades of research. Cambridge Journal of Education, 43(3), 325–356. https://doi.org/10.1080/0305764X.2013.786024
- King, A. (2002). Structuring peer interaction to promote high-level cognitive processing. Theory Into Practice, 41(1), 33–39. https://doi.org/10.1207/s15430421tip4101_6
- Leopold, C., & Leutner, D. (2012). Science text comprehension: Drawing, main idea selection, and summarizing as learning strategies. Learning and Instruction, 22(1), 16–26. https://doi.org/10.1016/j.learninstruc.2011.05.005
- Libarkin, J. C., & Kurdziel, J. P. (2006). Ontology and the teaching of earth system science. Journal of Geoscience Education, 54(3), 408–413. https://doi.org/10.5408/1089-9995-54.3.408
- McDonald, S., Bateman, K., Gall, H., Tanis-Ozcelik, A., Webb, A., & Furman, T. (2019). Mapping the increasing sophistication of students’ understandings of plate tectonics: A learning progressions approach. Journal of Geoscience Education, 67(1), 83–96. https://doi.org/10.1080/10899995.2018.1550972
- McLure, F., Won, M., & Treagust, D. F. (2020). A sustained multidimensional conceptual change intervention in grade 9 and 10 science classes. International Journal of Science Education, 42(5), 703–721. https://doi.org/10.1080/09500693.2020.1725174
- McLure, F., Won, M., & Treagust, D. F. (2021). What students’ diagrams reveal about their sense-making of plate tectonics in lower secondary science. International Journal of Science Education, 43(16), 2684–2705. https://doi.org/10.1080/09500693.2021.1983922
- McLure, F., Won, M., & Treagust, D. F. (2022). Analysis of students’ diagrams explaining scientific phenomena. Research in Science Education, 52(4), 1225–1241. https://doi.org/10.1007/s11165-021-10004-y
- Mortimer, E. F., & Scott, P. (2003). Meaning making in science classrooms. Open University Press.
- Newberry, M., Gilbert, J. K., & Consortium, C. H. S. (2011). The thinking frames approach. Primary Science Teaching Trust. Retrieved June 7, 2013, from https://pstt.org.uk/resources/cpd-units/the-thinking-frames-approach
- NGSS. (2013). Next Generation Science Standards: For states, by states. https://www.nextgenscience.org/
- Orion, N., & Libarkin, J. C. (2014). Earth system science education. In N. G. Lederman & S. K. Abell (Eds.), Handbook of research on science education (Vol. II, pp. 481–496). Routledge.
- Raia, F. (2008). Causality in complex dynamic systems: A challenge in earth systems science education. Journal of Geoscience Education, 56(1), 81–94. https://doi.org/10.5408/1089-9995-56.1.81
- Tang, K. S. (2021). Discourse strategies for science teaching and learning. Routledge.
- Tippett, C. D. (2016). What recent research on diagrams suggests about learning with rather than learning from visual representations in science. International Journal of Science Education, 38(5), 725–746. https://doi.org/10.1080/09500693.2016.1158435
- Tytler, R., & Aranda, G. (2015). Expert teachers’ discursive moves in science classroom interactive talk. International Journal of Science and Mathematics Education, 13(2), 425–446. https://doi.org/10.1007/s10763-015-9617-6
- Tytler, R., Prain, V., Aranda, G., Ferguson, J., & Gorur, R. (2020). Drawing to reason and learn in science. Journal of Research in Science Teaching, 57(2), 209–231. https://doi.org/10.1002/tea.21590
- Tytler, R., Prain, V., & Hubber, P. (2018). Representation construction as a core science disciplinary literacy. In K. S. Tang, & K. Danielsson (Eds.), Global developments in literacy research for science education (pp. 301–317). Routledge.