
Abstract
We investigated the effects of (poly)phenol-rich sugarcane extract (PRSE), sugarcane fibre (SCFiber), and the combination of them (PRSE + SCFiber) on the gut microbiota and short-chain fatty acids (SCFA) production using in vitro digestion and pig faecal fermentation. Measuring total phenolic content and antioxidant activity through the in vitro digestion stages showed that PRSE + SCFiber increased the delivery of (poly)phenols to the in vitro colonic fermentation stage compared to PRSE alone. The PRSE + SCFiber modulated the faecal microbiota profile by enhancing the relative abundances of Prevotella, Lactobacillus, and Blautia, and reducing the relative abundance of Streptococcus. PRSE + SCFiber also mitigated the inhibitory effects of PRSE on SCFA production. These results suggest that the inclusion of sugarcane fibre with PRSE could increase the availability of phenolic compounds in the colon and modulate the gut microbiota towards a more favourable profile.
Introduction
Gut microbiota, the complex and dynamic population of microorganisms which resides along the human gastrointestinal tract, plays a pivotal role in human health. Multiple factors are involved in shaping the diversity and composition of the human gut microbiota throughout the lifetime (Thursby and Juge Citation2017). For example, health status, host genetics, dietary patterns, medication and living environment can alter the bacteria in the human colon (Carding et al. Citation2015). Imbalanced and disturbed gut bacterial community, also known as dysbiosis, is often related to the pathogenesis of many inflammatory diseases and infections (Carding et al. Citation2015). The complex relationship between the gut microbiota and human health is critical, while diet plays a crucial role in establishing and regulating the gut microbiota profile and its functions (Graf et al. Citation2015). Plant-based diets are correlated with gut microbiota enterotypes which are associated with good human health, the animal protein-based and high fat-based diets (De Filippis et al. Citation2016). (Poly)phenols and dietary fibres are commonly found in plant-based products. They could be metabolised by the gut microbial community and result in the production of potential health-promoting phenolic metabolites and short-chain fatty acids (SCFA), respectively. A recent study by Tomas et al. (Citation2020) showed that different soluble dietary fibres affected the phenolic metabolites production during in vitro colonic fermentation. Besides, different dietary fibres, such as inulin, pectin, konjac, and chitosan, exhibited different modulatory effects on the flavanone profile of grapefruit peel during simulated colonic fermentation (Tang et al. Citation2022).
Sugarcane (Saccharum officinarum L.) bagasse and molasse are underutilised wastes generated from sugar production which could be further exploited for health use. In a study by Ji et al. (Citation2019), a (poly)phenol-rich sugarcane extract was shown to regulate carbohydrate metabolism by inhibiting glucose and fructose update in Caco-2 human intestinal cells, and by restoring insulin production in dysfunctional β-cells. Sugarcane molasses also exhibited suppressive effects on nitric oxide production, which indicated anti-inflammatory capacity (Wang et al. Citation2011). Moreover, Deseo et al. (Citation2020) postulated that sugarcane molasses possessed relatively high antioxidant activity and phenolics content. Sugarcane bagasse fibre is suggested as a natural carrier to deliver (poly)phenols to the colon and lead to potential health benefits via modulation of the gut microbiota (Loo et al. Citation2020). Nevertheless, the knowledge regarding the interaction between (poly)phenols and sugarcane fibre, and their reciprocal relationships with the gut bacterial community remains tenuous.
Due to the comparable anatomy, physiology and metabolism between pigs (Sus scrofa) and humans, these animals are suggested to be a good non-primate model to study the nutrients digestion and absorption (Roura et al. Citation2016). Similarities of microbiota composition and diversity were found in the intestines between pigs and humans (Xiao et al. Citation2016). This suggested that pig gut microbiota can be utilised as an appropriate model to study the complex interactions between foods and gut microbial community (Heinritz et al. Citation2013). In our previous study, pig faecal microbiota composition was found to be modulated by a crude ethanol extract of sugarcane molasses in combination with sugarcane fibre (Loo et al. Citation2022). To further study the effects of sugarcane phenolics with reduced interfering components, (poly)phenol-rich sugarcane extract (PRSE) used in this study was prepared from the ethanol extract of sugarcane molasses and partially purified by fractionation on Amberlite FPX66 resin (Dow Chemical Company, USA) as the resin-bound (ME-RBF) materials according to Deseo et al. (Citation2020). PRSE recovered from Amberlite FPX66 is a dark brown free flowing powder with low level of contaminating sugars, amino acids, and organic acids. The aim of this study is to examine the effects of PRSE, and its sugarcane fibre mix on the pig faecal microbiota profile and the subsequent SCFA production.
Materials and methods
Chemicals and reagents
The following analytical grade chemicals were purchased from Sigma-Aldrich (Castle Hill, NSW, Australia): sodium chloride (NaCl), potassium chloride (KCl), magnesium chloride (MgCl2), calcium chloride (CaCl2), monopotassium phosphate (KH2PO4), sodium phosphate monobasic (NaH2PO4), sodium phosphate dibasic (Na2HPO4), sodium bicarbonate (NaHCO3), ammonium carbonate ((NH4)2CO3), sodium hydroxide (NaOH), magnesium sulphate (MgSO4), dipotassium phosphate (K2HPO4), porcine pepsin, pancreatin, peptone, casein, bile salts, yeast extract, soluble starch, tryptone, pectin, mucin, L-Cysteine, Tween-80, guar, formic acid, acetic acid, propionic acid, iso-butyric acid, butyric acid, iso-valeric acid, valeric acid, ortho-phosphoric acid, 4-methyl-valeric acid, and hydrochloric acid (HCl).
Sample preparation
The Product Makers (TPM) (Keysborough, Victoria, Australia) provided the samples used in this study, which includes PRSE, sugarcane fibre (SCFiber), and the PRSE-sugarcane fibre mix (PRSE + SCFiber). The fractionation process in preparing PRSE removes sugars, amino acids, organic acids, and minerals from the phenolic materials in molasses. The Amberlite FPX66 resin-bound ME-RBF fraction was eluted with ethanol and was then spray-dried to form a dark brown free flowing powder, with total phenolic content of 149.0 ± 2.2 mg gallic acid equivalents (GAE)/g dry weight of powder as measured by the modified Folin-Ciocalteu reagent (FCR) method (Singleton and Rossi Citation1965). The major (poly)phenols present in PRSE are diosmin (227 µg/g dry weight), syringic acid (107 µg/g dry weight), and chlorogenic acid (74 µg/g dry weight) as characterised by Deseo et al. (Citation2020).
SCFiber was produced following the protocol from Pluschke et al. (Citation2019). Briefly, water-soluble substances and sugars were removed from the sugarcane bagasse by water extraction, and then dried at 40 °C and powdered to <100 µm in particle size. SCFiber contains 0.84 g dietary fibre per g powder.
PRSE + SCFiber is generated by mixing liquid PRSE with SCFiber powder and oven-dried for 72 h at 60 °C, resulting in a final product that contains 57.6 ± 0.34 mg GAE and 466 mg dietary fibre per g powder.
Experimental design
Samples containing 0.2 g of PRSE dry powder (29.8 ± 0.5 mg GAE), 0.27 g of SCFiber (0.23 g total dietary fibre), and 0.5 g PRSE + SCFiber (29.8 ± 0.5 mg GAE and 0.23 g total dietary fibre) were subjected to in vitro gastrointestinal digestion and colonic fermentation. The weights of samples are different to ensure that the PRSE-only and PRSE + SCFiber samples contain equivalent amounts of phenolics as GAE, while the SCFiber-only and PRSE + SCFiber samples contain equivalent amounts of total dietary fibre. Blank control group was performed the same way without adding any samples. All samples and blanks were performed in triplicate (n = 3).
In vitro gastrointestinal digestion
The in vitro gastrointestinal digestion was executed according to INFOGEST static in vitro digestion protocol (Brodkorb et al. Citation2019), with other minor modifications as previously mentioned by Loo et al. (Citation2022), or otherwise stated. In this study, small modification was done in the oral phase, where each sample was hydrated with 2.5 mL of water and then mixed with 12.5 μL of 0.3 mol/L CaCl2 and 2 mL of simulated salivary fluid (SSF) for 2 min. After that, oral-phase mixture was subjected to gastric phase digestion by mixing with 3.75 mL of simulated gastric fluid, 0.8 mL of porcine pepsin stock solution (25000 U/mL), 2.5 μL of CaCl2 (0.3 mol/L) and 347.5 μL of water. The gastric-phase mixture was adjusted to pH 3.0 and the gastric digestion was started by shaking the mixture at 150 rpm for 2 h at 37 °C. During the intestinal phase, 5.5 mL of simulated intestinal fluid, 2.5 mL of freshly prepared pancreatin solution (800 U/mL), 1.25 mL of fresh fed state bile solution (40 mg/mL), 20 μL of 0.3 mol/L CaCl2 and 655 μL of water were mixed with the gastric-phase mixture. Then, the intestinal-phase mixture was adjusted to pH 7.0 and the intestinal digestion was commenced by shaking the mixture at 150 rpm for 2 h at 37 °C. At the end of the intestinal digestion, samples were snap frozen by liquid nitrogen and stored at −20 °C. Blanks were made up the same way without adding any samples.
In vitro colonic fermentation
Basal medium preparation
Basal medium was prepared by dissolving 5 g tryptone, 5 g peptone, 5 g soluble starch, 4.5 g KCl, 4.5 g NaCl, 4.5 g yeast extract, 4 g mucin, 3 g casein, 2 g pectin, 1.5 g NaHCO3, 1.23 g MgSO4·7H2O, 1.0 g guar, 0.8 g L-Cysteine HCl, 0.5 g KH2PO4, 0.5 g K2HPO4, 0.4 g bile salts, 0.11 g CaCl2 and 1 mL Tween-80 in MilliQ water and made up to the final volume of 1 L (Sirisena et al. Citation2018).
Faecal slurry preparation
Four female grower pigs (Large White × Landrace, 61.5 ± 5.0 kg, and age of 14 weeks) with no intestinal diseases which consumed a standard commercial diet for 2 months (Barastoc Pig Grower, Ridley Corporation, Australia) (56.3% starch, 18% crude protein, 2.7% fat, 2.38% dietary fibre, 14% digestible energy) and water provided ad libitum, were randomly selected as the source for pig faeces. These pigs were fed as control group in another pig-feeding study with ethical approval obtained from the Veterinary and Agricultural Sciences Human Ethics Advisory Group, University of Melbourne (Ethics Approval ID: 10395). Equal mass (50 g) of freshly defaecated faeces from each pig was collected and pooled on one occasion. Faecal slurry (20% w/w) was prepared by mixing 20 g of pooled faeces and 80 g sterile 0.1 M phosphate buffer (pH = 7.0) in a stomacher for 10 min. Next, it was mixed in a stomacher and then filtered by sterile muslin fabric (Charles Parsons Textiles, Australia). The faecal slurry was stored in sterilised bottle, flushed with nitrogen gas and used for experiment on the same day (Sirisena et al. Citation2018). Replicate fermentations for each treatment were done with this faecal material.
In vitro colonic fermentation
The in vitro colonic fermentation was carried out according to Loo et al. (Citation2022) and Pérez-Burillo et al. (Citation2021) with modifications. The samples and blanks obtained from the in vitro digestion were thawed and centrifuged to obtain the precipitates (containing approximately 10% [v/v] of in vitro digestion supernatant) for in vitro colonic fermentation. Five mL of faecal slurry and 5 mL of basal medium pre-warmed at 37 °C were added to the tubes containing the intestinal phase precipitate and followed by flushing the headspace with nitrogen gas before closing the tubes. The fermentation process was performed in an anerobic shaking incubator that was maintained at 37 °C and 100 rpm for 24 h. The sample collection was carried out at 0, 3, 6, 12, and 24 h of fermentation from all tubes. The collected tubes were immediately frozen with liquid nitrogen. All tubes were stored at −20 °C until further analysis.
Determination of total phenolic content and antioxidant activity
Sample extracts preparation
Sample extracts of raw samples (PRSE, SCFiber, and PRSE + SCFiber) and the in vitro digested samples were performed according to Loo et al. (Citation2022). Briefly, the raw samples were extracted with 80% methanol (containing 0.1% formic acid [v/v]) for 24 h by shaking incubator at 150 rpm at room temperature, and the resulted supernatant was used for the determination of total phenolic content (TPC) and Trolox equivalent antioxidant capacity (TEAC).
The in vitro digested samples were centrifuged and separated into two fractions for total phenolic and antioxidant activity tests, respectively. The digesta precipitate fraction was further extracted with 80% methanol (containing 0.1% formic acid [v/v]) for 24 h, and the resulting supernatant was used for the chemical tests. The digesta supernatant fraction was further treated by two different methods. For the measurement of TPC, the digesta supernatant was treated with the Carrez precipitation to eliminate the interfering materials from the digestive solution. For the determination of TEAC, the digesta supernatant was mixed with methanol (containing 0.1% formic acid [v/v]) at 1:1 ratio (v/v) and centrifuged to obtain the resulted supernatant for the assay.
Total phenolic content (TPC)
The determination of TPC was performed by following the modified Folin-Ciocalteu reagent (FCR) method (Singleton and Rossi Citation1965). Determinations were done in triplicate and the TPC was expressed as mg gallic acid equivalents (mg GAE) calculated using the gallic acid callibration curve ranged from 0 to 1000 µg gallic acid/mL.
Trolox equivalent antioxidant capacity
The determination of TEAC was performed as previously described (Re et al. Citation1999) by using 2,2′-azino-bis-3-ethylbenzothiazoline-6-sulfonic acid (ABTS) as the free radical. All determinations were performed in triplicate and the TEAC was expressed as mg Trolox equivalents (mg TE) calculated using the Trolox calibration curve.
Intestinal bio-accessibility and colonic availability
The intestinal bio-accessibility (IB) was calculated as the percentage of TPC or TEAC after in vitro gastrointestinal digestion that was detected in the intestinal digesta supernatant. It represents the TPC and TEAC of materials which are available for absorption during digestion. The colonic availability (CA) was calculated as the percentage of TPC or TEAC after in vitro gastrointestinal digestion that are detected in the intestinal digesta precipitate. It represents the TPC and TEAC of materials which are carried over to the in vitro colonic fermentation and accessible by the gut microbiota (Loo et al. Citation2022). The Intestinal Bioaccessibility (IB) and Colonic Availability (CA) were calculated as previously described (Loo et al. Citation2022).
DNA extraction and 16S rRNA sequencing
Before sending the samples for DNA extraction and 16S rRNA sequencing performed by Australian Genome Research Facility Ltd (Australia), excess phenolic materials were removed from all samples by washing through the in vitro fermented precipitate for 3 times using ice-cold phosphate buffered saline (PBS) containing 2% polyvinylpolypyrrolidone (v/v) at a ratio of 2:3 (fermented precipitate: PBS, v/v) (Liu et al. Citation2021), and the subsequent pellets were then mixed with DNA/RNA shield solution (Zymo Research, California, USA). The DNA extraction was performed by using DNeasy® PowerSoil® Pro Kit (QIAGEN GmbH, Hilden, Germany) and the 16S rRNA gene from V1 to V3 regions were amplified by polymerase chain reaction (PCR) conducted on an Illumina MiSeq (San Diego, CA, USA) with the 27 F-519R primers, details of the PCR process are provided in supplementary document 1. The raw sequence reads were stored in the NCBI Sequence Read Archive under the BioProject ID PRJNA804672.
SCFA extraction and analysis of in vitro colonic fermentation samples
Sample preparation for SCFA analysis by gas chromatography (GC) was performed according to Loo et al. (Citation2022). Briefly, all in vitro fermented samples were centrifuged, and 1.5 mL of the resulted supernatants were mixed with 3.5 mL of dilute acid solution (containing 1% orthophosphoric acid [v/v] and 1% formic acid [v/v]) and 8 µmol of internal standard (4-methyl-valeric acid). The final mixture was then ready for GC analysis. Acetic, propionic, butyric, iso-butyric, iso-valeric, and valeric acid were used as the standard compounds for identification and quantification purposes, with calibration curves ranging from 0 to 200 ppm. All standards, reagents, and prepared samples were stored at 4 °C before analysis.
GC (7890B Agilent, CA, USA) coupled with a flame ionisation detector (FID) and a SGE BP21 capillary column (12 × 0.53 mm internal diameter [ID] and film thickness of 0.5 µm, SGE International, Ringwood, VIC, Australia, P/N 054473) were used for the SCFA analysis performed as previously described by Gu et al. (Citation2019), with the same GC method. All results were expressed as mmol/L fermenta.
Data analysis
One-way analysis of variance (ANOVA) and Tukey’s HSD test were performed to analyse the differences in SCFA concentration among different treatment groups using IBM® SPSS statistics software 27 (SPSS Inc., Chicago, IL, USA). Result was expressed as mean ± standard deviation (mean ± SD) and significant difference was defined by p < 0.05.
QIIME 2 (version 2020.11) platform was used to perform the microbiome bioinformatics (Bolyen et al. Citation2019) which included the demultiplexing and quality filtration done by q2-demux plugin, denoising with DADA2 (via q2-dada2) (Callahan et al. Citation2016), amplicon sequence variants (ASVs) alignment by mafft (via q2-alignment) (Katoh et al. Citation2002), phylogenetic tree construction by fasttree2 (via q2-phylogeny) (Price et al. Citation2010), and taxonomy assignment using the classify-sklearn naïve Bayes taxonomy classifier (via q2-feature classifier) (Bokulich et al. Citation2018). QIIME 2 platform was also used to conduct the non-parametric microbial interdependence test (NMIT) (Zhang Y et al. Citation2017). Linear discriminant analysis (LDA) effect size (LEfSe) analysis was performed to determine the significant taxonomic differences of faecal bacteria between treatments (https://huttenhower.sph.harvard.edu/galaxy/) (Segata et al. Citation2011). One-way ANOVA and Tukey’s HSD test were performed to determine the significant differences in the relative abundances of major bacterial genera (relative abundance >0.5%) at each fermentation time point between different treatments, using IBM® SPSS statistics software 27 (SPSS Inc., Chicago, IL, USA). Data were checked for normal distribution prior to ANOVA analysis. Data were expressed as mean ± SD and significant difference was defined by p < 0.05.
R (R Core Team Citation2021) was used to calculate the Spearman’s rank correlation coefficient between the relative abundances of bacterial genera and SCFA concentration. The correlation was performed by correlating the values of changes in SCFA content (ΔSCFA1 = SCFA [3h] – SCFA [0h]; (ΔSCFA2 = SCFA [6h] – SCFA [3h]; (ΔSCFA3 = SCFA [12h] – SCFA [6h]; (ΔSCFA4 = SCFA [24h] – SCFA [12h]) and the values of changes in bacterial genera relative abundances (Δrelative abundance1 = relative abundance [3h] – relative abundance [0h]; (Δrelative abundance2 = relative abundance [6h] – relative abundance [3h]; (Δrelative abundance3 = relative abundance [12h] – relative abundance [6h]; (Δrelative abundance4 = relative abundance [24h] – relative abundance [12h]). Phylogenetic Investigation of Communities by Reconstruction of Unobserved States 2 (PICRUSt2) analysis was performed to predict the functional pathways using the 16S rRNA sequencing data (Douglas et al. Citation2020).
Results and discussion
In vitro bio-accessibility of PRSE after digestion was influenced by the addition of SCFiber
To study the IB and CA of phenolic compounds derived from PRSE, samples subjected to in vitro gastrointestinal digestion were separated into the supernatant and precipitate fractions, and the TPC and TEAC of these fractions were measured (). The phenolic compounds in PRSE were more soluble in the intestinal digesta, indicated by the statistically higher (p < 0.05) IB (87.1% in terms of TPC) used to track phenolic materials (). By contrast, the IB was significantly lower (p < 0.05) in the PRSE + SCFiber sample (61.8% in terms of TPC). This was probably owing to phenolic compounds trapped within the sugarcane fibre matrix rendering them insoluble. Regarding the CA, combination of SCFiber with PRSE increased the CA of phenolic compounds in PRSE from 12.9% to 38.2% in terms of TPC, and from 15.9% to 23.5% in terms of TEAC. For the SCFiber-only treatment, the CA was 84.7% in terms of TPC and 81.5% in terms of TEAC, indicating that more than 80% of the residual phenolic compounds found in SCFiber were retained in the intestinal digested precipitate. Overall, these results showed that the inclusion of SCFiber with PRSE significantly improved the amount of phenolics from PRSE which could be delivered to the colonic phase.
Table 1. TPC and TEAC of raw samples and digested samples after in vitro digestion.
Dietary fibre is suggested to be a natural carrier for the delivery of phenolic compounds to the colon because it can interact with (poly)phenols by hydrophobic interactions, hydrogen bonding, and Van der Waals forces, and trap the (poly)phenols within the dietary fibre matrix (Jakobek and Matić Citation2019; Loo et al. Citation2020). Consequently, this fibre-(poly)phenol complex may increase the availability of phenolic compounds to the colon. The current results support our earlier findings using crude sugarcane molasses extract (Phytolin) mixed with sugarcane fibre, which also improve the delivery of phenolic compounds to the colonic phase (Loo et al. Citation2022). Besides, a recent study by Tang et al. (Citation2022) also indicated that medium-viscosity dietary fibres (chitosan and konjac) increased the retention of (poly)phenols during in vitro digestion.
Microbial profile was modulated by PRSE and SCFiber during in vitro colonic fermentation
Bioinformatics analysis of the 16S rRNA amplicon of the samples collected during the fermentation process was performed to interpret the effects of PRSE, SCFiber, and PRSE + SCFiber on the faecal microbiota profile. NMIT was performed to assess the interdependencies of operational taxonomic units (OTUs) within the faecal bacterial community which might change over time (Zhang Y et al. Citation2017). The NMIT result showed that PRSE + SCFiber displayed the most significant different microbiota profile as compared to the blank, while the clear clustering of different treatment groups indicated the distinctive microbiota composition between different samples (). Furthermore, significant associations (Kruskal–Wallis sum-rank test α < 0.05; LDA score >2.00) between different bacterial taxa and treatments at the end of 24 h of fermentation were identified by LEfSe analysis (). Additionally, alpha diversity (Table S1, Supplementary Materials) and beta diversity (Figure S1, Supplementary Materials) indices also showed the different influences induced by the treatments compared to the blank. In general, these results are aligned with previous studies that showed plant-based (poly)phenols and polysaccharides modulated the gut microbiota profiles at different levels. For instance, cocoa (poly)phenols combined with cellulose or the enzyme-resistant fraction of a barley variety (BARLEYmax) differently affected the alpha- and beta-diversities of pig faecal microbiota (Nagata et al. Citation2021). Besides, the SCFiber-only and PRSE + SCFiber samples significantly reduced the Firmicutes/Bacteroidetes ratio (F/B ratio) among the different treatments at the end of 24 h in vitro fermentation (), suggesting that SCFiber might contribute to the reduction of F/B ratio. Firmicutes and Bacteroidetes are the most dominant phyla among the 90% of bacteria found in human gut microbial community (Eckburg et al. Citation2005). It is suggested that low F/B ratio is associated with lower risk of obesity because Bacteroidetes was positively correlated with reduced body fat, while the association between Firmicutes and obesity could be related to the greater energy yield. Firmicutes possess more carbohydrate metabolism enzymes that lead to higher capacity to metabolise carbohydrate which allows higher energy absorption (Crovesy et al. Citation2020). However, the association between F/B ratio and obesity is still being debated whether it can be considered as an indicator of obesity-type gut microbiota (Magne et al. Citation2020).
Figure 1. Alterations in the faecal bacterial community in different treatments. (a) Principal coordinates analysis (PCoA) plot showing the nonparametric microbial interdependence test (NMIT) distance at genus level to investigate the differences in microbiota profile between treatments using the time-based microbiota composition data. (b) Taxonomic cladogram showing the significantly discriminative taxa associated with different treatments by linear discriminant analysis (LDA) effect size (LEfSe) analysis (Kruskal–Wallis sum-rank test α < 0.05; LDA score > 2.00). The significantly discriminative taxa associated with each treatment is represented by different colour shading and the non-significant bacterial taxa is represented by the yellow dots.
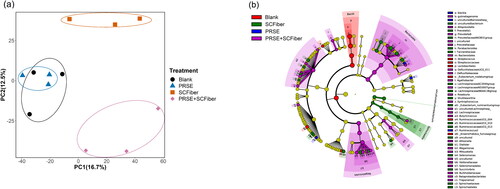
Table 2. Firmicutes/Bacteroidetes ratio of different samples after 24 h of in vitro colonic fermentation.
In addition, we compared the modulatory effects of PRSE, SCFiber, and PRSE + SCFiber on the relative abundance of the bacterial genera (>0.5% across all samples) throughout the in vitro fermentation. As compared to the blank, each treatment altered the relative abundances of specific bacterial genera differently at different fermentation time points ( and Table S2, Supplementary Materials). Particularly, PRSE + SCFiber showed synergistic effects on modulating the relative abundances of certain bacterial genera (>0.5%) at specific fermentation time points, which was not shown by PRSE or SCFiber alone. For instance, the relative abundance of Prevotella was increased in the PRSE + SCFiber treatment at 3 h and 24 h of fermentation which was not observed with PRSE or SCFiber compared to the blank. Prevotella was associated with plant-based diets rich in fibres due to its ability to digest complex fibres in foods (Precup and Vodnar Citation2019). Thus, high levels of Prevotella species were found in communities that consumed diets high in plant-based foods across the world (Precup and Vodnar Citation2019). Evidence reported that Prevotella species were positively correlated to propionic acid production, and they claimed this correlation has important roles in the prevention of obesity by decreasing hepatic lipogenesis and serum cholesterol (Chambers et al. Citation2015).
Figure 2. Changes in the relative abundances of the faecal microbial community in different treatments during the in vitro colonic fermentation. Relative abundances plot of the major bacterial genera (relative abundance > 0.5%) of blank, PRSE, SCFiber, and PRSE + SCFiber resulting from independent fermentation of each treatment at the 0, 3, 6, 12, and 24 h of in vitro colonic fermentation. Genera grouped as “Other” were those with relative abundance < 0.5%.
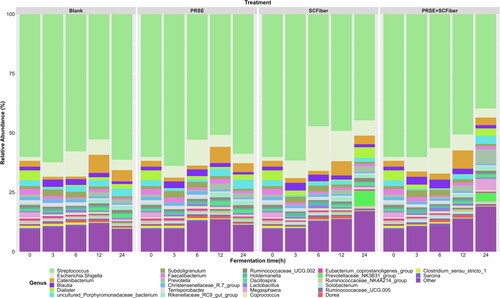
The in vitro colonic fermentation of PRSE + SCFiber significantly increased (p < 0.05) the relative abundance of Blautia spp. at 6 h and 12 h of fermentation over that of PRSE or SCFiber compared to the blank. Some Blautia species are recognised as butyrate-producing bacteria in the gut microbiota, where butyrate is a bacterial metabolite that associated with beneficial effects on glucose metabolism and obesity-associated inflammation (Udayappan et al. Citation2016; Zhang Q et al. Citation2017). Increased abundance of Blautia spp. was significantly correlated to the ameliorating of glucose and lipid homeostasis in a human randomised clinical trial (Tong et al. Citation2018).
PRSE + SCFiber also significantly increased (p < 0.05) the relative abundance of Lactobacillus at 12 h of fermentation over that of PRSE or SCFiber compared to the blank. Lactobacillus is one of the major groups of probiotic bacteria that are commercially exploited as probiotics and present ubiquitously in the human intestine (Marco et al. Citation2006). It is suggested that bacteria of the Lactobacillus genera benefits human health through different mechanisms such as regulation of the immune response, consolidation of the intestinal barrier, and protection against pathogens either by the producing antimicrobial compounds or competing for mucosal binding sites (Marco et al. Citation2006). The molecular mechanism of some of these processes are reviewed by Turroni et al. (Citation2014).
However, the increments of Blautia and Lactobacillus did not continue up to 24 h of fermentation. This may indicate that higher amount of substrate is needed to support the growth of these specific genera. The suppressed bacterial growth might also be caused by the negative feedback from excessive fermentation end-products or by the exhaustion of micronutrients from the basal medium. Due to the resilience of human gut microbiota, short-term changes in dietary intakes are suggested to be insufficient to cause significant alterations to the gut microbiota profile (Lozupone et al. Citation2012). Therefore, the potential beneficial effects of the PRSE + SCFiber could be further examined in the future by long-term intervention study using different dosages.
On the other hand, the relative abundance of Streptococcus was significantly reduced by PRSE + SCFiber compared to blank at 24 h of fermentation. Increased abundance of Streptococcus was previously found to be associated with patients with chronic kidney disease and end-stage renal disease (Zhao et al. Citation2021). Besides, major structural imbalance of gut microbiota observed in colorectal cancer was associated with enriched abundance of Streptococcus (Wang et al. Citation2012).
In comparison to our previous finding using Phytolin and SCFiber (Loo et al. Citation2022), this current study showed similar synergistic effects on the regulation of microbial community. Both the combinations of Phytolin + SCFiber and PRSE + SCFiber caused the most significantly different microbiota profile compared to the blanks as indicated by the NMIT results and significantly increased the relative abundance of Lactobacillus after 12 h of fermentation. On the other hand, differences in the modulation of other bacterial genera were observed between these studies. For instance, Phytolin + SCFiber significantly increased (p < 0.05) the relative abundance of Catenibacterium and decreased the relative abundances of Mogibacterium, Dialister, and Echerichia-Shigella (Loo et al. Citation2022), while PRSE + SCFiber in this current study induced significant reduction (p < 0.05) in the relative abundance of Streptococcus and caused significant increment (p < 0.05) in the relative abundance of Prevotella and Blautia spp. The faecal materials sourced from different batches of pigs between these two studies might possess different baseline microbiota composition and possibly led to the different microbiota regulatory effects observed between these studies. Nonetheless, both studies suggest that the combination of sugarcane (poly)phenols with fibre may synergistically modulate the gut microbiota towards a better profile.
Production of SCFA during in vitro colonic fermentation
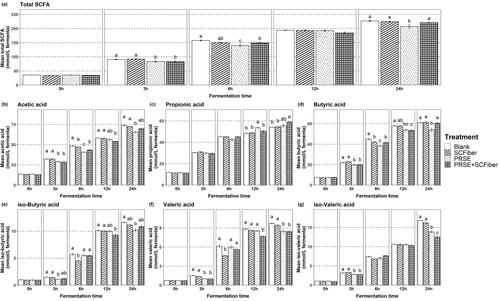
The SCFA production throughout the 24 h in vitro colonic fermentation were studied ( and Table S3, Supplementary Materials). PRSE, SCFiber and PRSE + SCFiber significantly (p < 0.05) affected the production of individual SCFA at specific time points as compared to the blank fermentation. Amongst the SCFA measured in different samples and blanks, acetic, propionic, and butyric acids with concentration ranges from 50 tp 75 mmol/L fermenta were the major SCFA produced throughout the 24 h fermentation. Iso-butyric, iso-valeric and valeric acids were produced in relatively lower concentrations, that ranges from 8.5 to 17 mmol/L fermenta.
Figure 3. Concentration of short chain fatty acids produced throughout the in vitro colonic fermentation. (a) Total SCFA, (b) acetic acid, (c) propionic acid, (d) butyric acid, (e) iso-butyric acid, (f) valeric acid and (g) iso-valeric acid content (mmol/L fermenta) of blank, PRSE, SCFiber, and PRSE + SCFiber at the 0, 3, 6, 12, and 24 h of in vitro colonic fermentation. Each treatment was subjected to in vitro digestion and the digested precipitate was proceeded to in vitro colonic fermentation. Statistical significance (p < 0.05) of the results between different treatments is indicated by different letters in each plot and results are expressed as means ± SD (n = 3).
Microbial fermentation of dietary fibres in the colon produces SCFA that are important for gut integrity by modulating mucus production, luminal pH and supplying energy source for epithelial cells (Blaak et al. Citation2020). SCFA are also involved in the regulation of host metabolic health by modulating the tissue-specific mechanisms associated with appetite regulation, energy expenditure, glucose homeostasis and immunoregulation (Morrison and Preston Citation2016).
Generally, fermentation of different dietary fibres result in varying amounts of total SCFA production, depending on fibre structures and the starting faecal microbiota composition (Jonathan et al. Citation2012). However, we observed no significant differences in the total SCFA content after 24 h in vitro colonic fermentation of the SCFiber-only sample compared to the blank. This indicates that the faecal bacterial community might prefer to metabolise the more readily fermentable carbohydrate substrates in the basal medium instead of the sugarcane fibre, even though the sugarcane fibre was presented at a much higher concentration in the fermentation than the starch and guar of the basal medium.
By contrast, fermentation of PRSE-only samples caused a significant reduction in total SCFA production between 3 h and 6 h and at 24 h of fermentation as compared to blank. This could be due to the inhibitory effect of phenolics in PRSE on the metabolism of faecal bacteria. In the study by Kemperman et al. (Citation2013), (poly)phenols from red wine grape extract resulted in a reduced amount of butyric acid from fermentation while black tea (poly)phenols decreased total SCFA production. The phenolic compounds present in PRSE might also decrease the capability of faecal bacteria to metabolise the basal medium materials by inhibiting their growths. It was postulated that flavonoid aglycones, but not their glycosides, might be inhibitory on certain intestinal bacteria (Duda-Chodak Citation2012). The PRSE used in our study is rich in diosmin, a flavonoid glycoside which is derived from its aglycone diosmetin (Deseo et al. Citation2020). Perhaps the diosmin in PRSE is deglycosylated by the faecal micobiota into diosmetin which in turn inhibits microbial growth that resulted in lower SCFA production. Further studies are suggested to clarify the metabolism of diosmin by gut microbiota and its effects on microbial growth and SCFA production.
The phenolic compounds being delivered by PRSE + SCFiber to the fermentation stage from the in vitro intestinal digestion was about 5 times higher in TPC and 4 times higher in TEAC as compared to the PRSE-only sample. However, the inhibitory effect of PRSE on SCFA production was mitigated by the inclusion of SCFiber and caused the total SCFA content to be not significantly different with the blank at the end of 24 h of fermentation. Even though the SCFiber might not be fermented by the faecal microbiota due to the presence of more readily fermentable carbohydrates in the basal medium, it can be envisaged that the association of phenolic compounds from the PRSE with the SCFiber limited the inhibitory effect of phenolics on the bacteria activity. Therefore, it is suggested that the inclusion of sugarcane fibres with (poly)phenols may contribute to better SCFA production than (poly)phenols alone.
Relative abundance of distinct pig faecal microbiota genera correlated with SCFA production
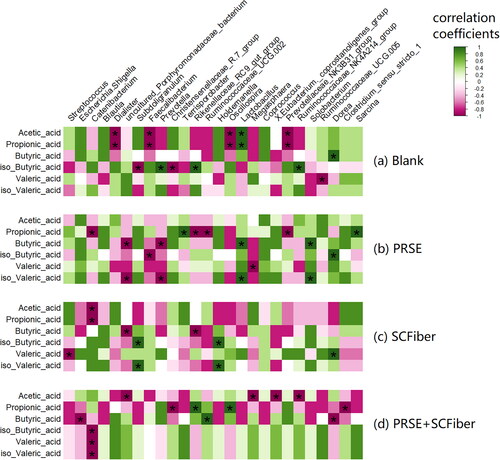
The gut microbiota plays an important role in the production of SCFA. Therefore, we investigated the associations between the changes in pig faecal microbiota and SCFA concentration to analyse the relationship between different bacterial genera and the individual SCFA production. The positive correlation patterns between the relative abundances of pig faecal bacteria and SCFA production changed when different samples were applied during the in vitro colonic fermentation (). In the blank treatment, acetic acid and propionic acid productions were associated with Lactobacillus, while butyric acid production was associated with Dorea. Besides, the production of iso-butyric acid was correlated with Prevotella, Rikenellaceae RC9 gut group, and Ruminococcaceae NK4A214 group. When PRSE was applied, production of propionic acid was associated with Terrisporobacter and Sarcina while production of butyric acid was associated with Lactobacillus and Solobacterium. Also, iso-butyric acid production was correlated with Dorea whereas iso-valeric acid production was correlated with Lactobacillus and Solobacterium. In the case of fermentation with SCFiber, Subdoligranulum and Holdemanella were correlated with the productions of iso-butyric acid and iso-valeric acid, while Dorea was associated with the production of valeric acid. In terms of fermentation with PRSE + SCFiber, associations were observed between the propionic acid production with Rikenellaceae RC9 gut group and Oscillospira, and between the butyric acid production with Ruminococcaceae UCG 002. This result indicated that the productions of specific SCFA in different treatments were correlated with the relative abundances of these potential SCFA-producing gut bacteria.
Figure 4. Correlations between specific bacterial genera and SCFA in different treatments. Spearman’s correlation heatmap of (a) blank, (b) PRSE, (c) SCFiber, and (d) PRSE + SCFiber showing the relationship between the changes in the relative abundances of major bacterial genera (relative abundance > 0.5%) and the changes in SCFA contents in different treatments. Positive correlations are indicated by green colours (r values > 0.6, FDR adjusted p < 0.05), while negative correlations are represented by pink colours (r values < –0.6, FDR adjusted p < 0.05). Other correlation coefficients are indicated by the colour scheme. Statistically significant correlations are marked with an asterisk ‘*’ (FDR adjusted p < 0.05).
PICRUSt2 analysis was performed to predict the possible metabolic pathways possessed by specific bacterial genera in different treatments to show their metabolic ability to produce specific SCFA, thus, to support their estimated correlations. Only the functional pathways possessed by the bacterial genera that were significantly correlated (p < 0.05) with individual SCFA were reported (). Additionally, only metabolic pathways that produce acetic, propionic, and butyric acids were predicted. This is because the MetaCyc database lacks information of functional pathways related to the production of iso-butyric, iso-valeric and valeric acids. Hence, it limits the ability to discuss the metabolic potential of the bacteria that correlated with the production of minor SCFA.
Table 3. Predicted metabolic pathways using PICRUSt2 analysis related to the significantly correlated pairs of bacterial genera and SCFAs from Spearman’s correlation result.
As shown in the PICRUSt2 result, different faecal bacteria were found to possess distinctive metabolic pathways related to the production of specific SCFA. The relative function abundance reported in was calculated by averaging the relative function abundance of all samples in each of the treatment groups (i.e. 0, 3, 6, 12 and 24 h in Blank, PRSE, SCFiber, and PRSE + SCFiber, respectively). In the blank group, 8 metabolic pathways corresponded to the acetic acid production and 4 metabolic pathways related to the propionic acid production were predicted for Lactobacillus, while 3 metabolic pathways attributed to the butyric acid production were predicted for Dorea. For PRSE group, 4 functional pathways were predicted for Terrisporobacter and Sarcina, respectively, with the propionic acid production, whereas 4 metabolic pathways related to the butyric acid production were predicted for Lactobacillus and Solobacterium. In terms of PRSE + SCFiber group, 4 and 2 metabolic pathways were predicted for Osillospira and Rikenellaceae RC9 gut group, respectively, that are potential to produce of propionic acid, while 5 metabolic pathways produce butyric acid were predicted for Ruminococcaceae UCG-002. Thus, these results indicated that these bacteria might be responsible, and possibly be dominant, to produce each of these specific SCFA in different sample groups, despite the limitation of PICRUSt2 analysis.
SCFA derived from the catabolism of fibres by gut microbiota play a vital role in mediating various biological activities and interacting with gut microbiota (Koh et al. Citation2016). The interaction between different treatments with the gut microbiota could possibly alter the activity of certain bacterial groups and caused the variations of associations between specific faecal bacterial genera with the production of individual SCFA. The metabolic capacities of certain bacteria groups were predicted by the PICRUSt2 analysis, where diverse metabolic pathways related to the SCFA production were possessed by different bacteria. In the study by De Filippis et al. (Citation2016), similar correlations have been reported where different dietary intakes are significantly correlated with different bacterial groups and SCFA production.
Conclusions and future perspectives
In conclusion, the combination of PRSE with sugarcane fibre enhanced the availability of phenolic compounds carried to the colon. This contributes to the subsequent effects of PRSE + SCFiber compared to PRSE or SCFiber alone on the pig faecal microbiota that ultimately modulates the microbial community to exhibit a potential beneficial profile not shown with PRSE or SCFiber only samples. PRSE + SCFiber shows significant differences in the pig faecal bacterial community in comparison with the blank treatment after 24 h of in vitro fermentation; of particular note are the increased relative abundances of Prevotella, Blautia, and Lactobacillus, and the reduced relative abundances of Streptococcus. Incorporating SCFiber with PRSE also mitigates the inhibitory effect of PRSE on SCFA production. The changes in correlations between individual SCFA production and specific bacteria suggest that different samples interact differently with the pig faecal microbiota and led to varying bacterial metabolic activity. These differences in metabolic capacity could be attributed to the different metabolic pathways possessed by these potential SCFA-producing gut bacteria, and thus, resulting in productions of specific SCFA in different sample groups. Hence, we suggest that the inclusion of sugarcane fibre with the phenolic compounds from the PRSE product could have favourable outcomes for the gut microbiota, by improving the availability of the phenolics to the colon and modulate the gut microbiota towards a more favourable health profile. While the current study focussed on the effects on SCFA production and gut microbiota profiles, further studies are suggested to characterise the changes of individual (poly)phenols and specific fibre contents after digestion and colonic fermentation.
Supplemental Material
Download PDF (576.4 KB)Acknowledgements
The authors would like to acknowledge Dr Barry Kitchen (Chief Scientific Officer, Head Bioactives Division, TPC) for interesting and insightful comments regarding the work. The authors would also like to acknowledge Hieu Le (PhD candidate of the University of Melbourne) for providing the pig fecal materials from the School of Agriculture & Food Animal House used in our in vitro fermentation study. YTL is a recipient of a Melbourne Research Scholarship.
Disclosure statement
The authors declare that they have no known competing financial interests or personal relationships that could have appeared to influence the work reported in this paper.
Additional information
Funding
References
- Blaak EE, Canfora EE, Theis S, Frost G, Groen AK, Mithieux G, Nauta A, Scott K, Stahl B, van Harsselaar J, et al. 2020. Short chain fatty acids in human gut and metabolic health. Benef Microbes. 11(5):411–455.
- Bokulich NA, Kaehler BD, Rideout JR, Dillon M, Bolyen E, Knight R, Huttley GA, Caporaso JG. 2018. Optimizing taxonomic classification of marker-gene amplicon sequences with QIIME 2’s q2-feature-classifier plugin. Microbiome. 6(1):1–17.
- Bolyen E, Rideout JR, Dillon MR, Bokulich NA, Abnet CC, Al-Ghalith GA, Alexander H, Alm EJ, Arumugam M, Asnicar F, et al. 2019. Reproducible, interactive, scalable and extensible microbiome data science using QIIME 2. Nat Biotechnol. 37(8):852–857.
- Brodkorb A, Egger L, Alminger M, Alvito P, Assunção R, Ballance S, Bohn T, Bourlieu-Lacanal C, Boutrou R, Carrière F, et al. 2019. INFOGEST static in vitro simulation of gastrointestinal food digestion. Nat Protoc. 14(4):991–1014.
- Callahan BJ, McMurdie PJ, Rosen MJ, Han AW, Johnson AJA, Holmes SP. 2016. DADA2: high-resolution sample inference from Illumina amplicon data. Nat Methods. 13(7):581–583.
- Carding S, Verbeke K, Vipond DT, Corfe BM, Owen LJ. 2015. Dysbiosis of the gut microbiota in disease. Microb Ecol Health Dis. 26(0):26191.
- Chambers ES, Viardot A, Psichas A, Morrison DJ, Murphy KG, Zac-Varghese SEK, MacDougall K, Preston T, Tedford C, Finlayson GS, et al. 2015. Effects of targeted delivery of propionate to the human colon on appetite regulation, body weight maintenance and adiposity in overweight adults. Gut. 64(11):1744–1754.
- Crovesy L, Masterson D, Rosado EL. 2020. Profile of the gut microbiota of adults with obesity: a systematic review. Eur J Clin Nutr. 74(9):1251–1262.
- De Filippis F, Pellegrini N, Vannini L, Jeffery IB, La Storia A, Laghi L, Serrazanetti DI, Di Cagno R, Ferrocino I, Lazzi C, et al. 2016. High-level adherence to a Mediterranean diet beneficially impacts the gut microbiota and associated metabolome. Gut. 65(11):1812–1821.
- Deseo MA, Elkins A, Rochfort S, Kitchen B. 2020. Antioxidant activity and polyphenol composition of sugarcane molasses extract. Food Chem. 314:126180.
- Douglas GM, Maffei VJ, Zaneveld JR, Yurgel SN, Brown JR, Taylor CM, Huttenhower C, Langille MG. 2020. PICRUSt2 for prediction of metagenome functions. Nat Biotechnol. 38(6):685–688.
- Duda-Chodak A. 2012. The inhibitory effect of polyphenols on human gut microbiota. J Physiol Pharmacol. 63(5):497–503.
- Eckburg PB, Bik EM, Bernstein CN, Purdom E, Dethlefsen L, Sargent M, Gill SR, Nelson KE, Relman DA. 2005. Diversity of the human intestinal microbial flora. Science. 308(5728):1635–1638.
- Graf D, Di Cagno R, Fåk F, Flint HJ, Nyman M, Saarela M, Watzl B. 2015. Contribution of diet to the composition of the human gut microbiota. Microb Ecol Health Dis. 26(0):26164.
- Gu C, Howell K, Padayachee A, Comino T, Chhan R, Zhang P, Ng K, Cottrell JJ, Dunshea FR. 2019. Effect of a polyphenol-rich plant matrix on colonic digestion and plasma antioxidant capacity in a porcine model. J Funct Foods. 57:211–221.
- Heinritz SN, Mosenthin R, Weiss E. 2013. Use of pigs as a potential model for research into dietary modulation of the human gut microbiota. Nutr Res Rev. 26(2):191–209.
- Jakobek L, Matić P. 2019. Non-covalent dietary fiber – polyphenol interactions and their influence on polyphenol bioaccessibility. Trends Food Sci Tech. 83:235–247.
- Ji J, Yang X, Flavel M, Shields ZP-I, Kitchen B. 2019. Antioxidant and anti-diabetic functions of a polyphenol-rich sugarcane extract. J Am Coll Nutr. 38(8):670–680.
- Jonathan MC, van den Borne JJ, van Wiechen P, da Silva CS, Schols HA, Gruppen H. 2012. In vitro fermentation of 12 dietary fibres by faecal inoculum from pigs and humans. Food Chem. 133(3):889–897.
- Katoh K, Misawa K, Ki K, Miyata T. 2002. MAFFT: a novel method for rapid multiple sequence alignment based on fast Fourier transform. Nucleic Acids Res. 30(14):3059–3066.
- Kemperman RA, Gross G, Mondot S, Possemiers S, Marzorati M, Van de Wiele T, Doré J, Vaughan EE. 2013. Impact of polyphenols from black tea and red wine/grape juice on a gut model microbiome. Food Res Int. 53(2):659–669.
- Koh A, De Vadder F, Kovatcheva-Datchary P, Bäckhed F. 2016. From dietary fiber to host physiology: short-chain fatty acids as key bacterial metabolites. Cell. 165(6):1332–1345.
- Liu D, Legras J-L, Zhang P, Chen D, Howell K. 2021. Diversity and dynamics of fungi during spontaneous fermentations and association with unique aroma profiles in wine. Int J Food Microbiol. 338:108983.
- Loo YT, Howell K, Chan M, Zhang P, Ng K. 2020. Modulation of the human gut microbiota by phenolics and phenolic fiber-rich foods. Compr Rev Food Sci F. 19(4):1268–1298.
- Loo YT, Howell K, Suleria H, Zhang P, Gu C, Ng K. 2022. Sugarcane polyphenol and fiber to affect production of short-chain fatty acids and microbiota composition using in vitro digestion and pig faecal fermentation model. Food Chem. 385:132665.
- Lozupone CA, Stombaugh JI, Gordon JI, Jansson JK, Knight R. 2012. Diversity, stability and resilience of the human gut microbiota. Nature. 489(7415):220–230.
- Magne F, Gotteland M, Gauthier L, Zazueta A, Pesoa S, Navarrete P, Balamurugan R. 2020. The firmicutes/bacteroidetes ratio: a relevant marker of gut dysbiosis in obese patients? Nutrients. 12(5):1474.
- Marco ML, Pavan S, Kleerebezem M. 2006. Towards understanding molecular modes of probiotic action. Curr Opin Biotechnol. 17(2):204–210.
- Morrison DJ, Preston T. 2016. Formation of short chain fatty acids by the gut microbiota and their impact on human metabolism. Gut Microbes. 7(3):189–200.
- Nagata R, Sato S, Kilua A, Fukuma N, Nakayama Y, Kitazono E, Aoyama T, Han K-H, Fukushima M. 2021. Combined effects of BARLEYmax and cocoa polyphenols on colonic microbiota and bacterial metabolites in vitro. Food Sci Biotechnol. 30(11):1–9.
- Pérez-Burillo S, Molino S, Navajas-Porras B, Valverde-Moya ÁJ, Hinojosa-Nogueira D, López-Maldonado A, Pastoriza S, Rufián-Henares JÁ. 2021. An in vitro batch fermentation protocol for studying the contribution of food to gut microbiota composition and functionality. Nat Protoc. 16(7):3186–3209.
- Pluschke AM, Feng G, Williams BA, Gidley MJ. 2019. Partial replacement of meat by sugar cane fibre: cooking characteristics, sensory properties of beef burgers and in vitro fermentation of sugar cane fibre. Int J Food Sci Technol. 54(5):1760–1768.
- Precup G, Vodnar D-C. 2019. Gut Prevotella as a possible biomarker of diet and its eubiotic versus dysbiotic roles: a comprehensive literature review. Br J Nutr. 122(2):131–140.
- Price MN, Dehal PS, Arkin AP. 2010. FastTree 2–approximately maximum-likelihood trees for large alignments. PLoS One. 5(3):e9490.
- R Core Team. 2021. R: a language and environment for statistical computing Vienna, Austria: R Foundation for Statistical Computing.
- Re R, Pellegrini N, Proteggente A, Pannala A, Yang M, Rice-Evans C. 1999. Antioxidant activity applying an improved ABTS radical cation decolorization assay. Free Radic Biol Med. 26(9–10):1231–1237.
- Roura E, Koopmans S-J, Lallès J-P, Le Huerou-Luron I, de Jager N, Schuurman T, Val-Laillet D. 2016. Critical review evaluating the pig as a model for human nutritional physiology. Nutr Res Rev. 29(1):60–90.
- Segata N, Izard J, Waldron L, Gevers D, Miropolsky L, Garrett WS, Huttenhower C. 2011. Metagenomic biomarker discovery and explanation. Genome Biol. 12(6):R60–18.
- Singleton VL, Rossi JA. 1965. Colorimetry of total phenolics with phosphomolybdic-phosphotungstic acid reagents. Am J Enol Viticult. 16(3):144–158.
- Sirisena S, Ajlouni S, Ng K. 2018. Simulated gastrointestinal digestion and in vitro colonic fermentation of date (Phoenix dactylifera L.) seed polyphenols. Int J Food Sci Technol. 53(2):412–422.
- Tang R, Yu H, Ruan Z, Zhang L, Xue Y, Yuan X, Qi M, Yao Y. 2022. Effects of food matrix elements (dietary fibres) on grapefruit peel flavanone profile and on faecal microbiota during in vitro fermentation. Food Chem. 371:131065.
- Thursby E, Juge N. 2017. Introduction to the human gut microbiota. Biochem J. 474(11):1823–1836.
- Tomas M, Rocchetti G, Ghisoni S, Giuberti G, Capanoglu E, Lucini L. 2020. Effect of different soluble dietary fibres on the phenolic profile of blackberry puree subjected to in vitro gastrointestinal digestion and large intestine fermentation. Food Res Int. 130:108954.
- Tong X, Xu J, Lian F, Yu X, Zhao Y, Xu L, Zhang M, Zhao X, Shen J, Wu S, et al. 2018. Structural alteration of gut microbiota during the amelioration of human type 2 diabetes with hyperlipidemia by metformin and a traditional Chinese herbal formula: a multicenter, randomized, open label clinical trial. MBio. 9(3):e02392–02317.
- Turroni F, Ventura M, Buttó LF, Duranti S, O’Toole PW, Motherway MOC, van Sinderen D. 2014. Molecular dialogue between the human gut microbiota and the host: a Lactobacillus and Bifidobacterium perspective. Cell Mol Life Sci. 71(2):183–203.
- Udayappan S, Manneras-Holm L, Chaplin-Scott A, Belzer C, Herrema H, Dallinga-Thie GM, Duncan SH, Stroes ESG, Groen AK, Flint HJ, et al. 2016. Oral treatment with Eubacterium hallii improves insulin sensitivity in db/db mice. Npj Biofilms Microbiomes. 2(1):1–10.
- Wang B-S, Chang L-W, Kang Z-C, Chu H-L, Tai H-M, Huang M-H. 2011. Inhibitory effects of molasses on mutation and nitric oxide production. Food Chem. 126(3):1102–1107.
- Wang T, Cai G, Qiu Y, Fei N, Zhang M, Pang X, Jia W, Cai S, Zhao L. 2012. Structural segregation of gut microbiota between colorectal cancer patients and healthy volunteers. Isme J. 6(2):320–329.
- Xiao L, Estellé J, Kiilerich P, Ramayo-Caldas Y, Xia Z, Feng Q, Liang S, Pedersen AØ, Kjeldsen NJ, Liu C, et al. 2016. A reference gene catalogue of the pig gut microbiome. Nat Microbiol. 1(12):1–6.
- Zhang Q, Xiao X, Li M, Yu M, Ping F, Zheng J, Wang T, Wang X. 2017. Vildagliptin increases butyrate-producing bacteria in the gut of diabetic rats. PLoS One. 12(10):e0184735.
- Zhang Y, Han SW, Cox LM, Li H. 2017. A multivariate distance-based analytic framework for microbial interdependence association test in longitudinal study. Genet Epidemiol. 41(8):769–778.
- Zhao J, Ning X, Liu B, Dong R, Bai M, Sun S. 2021. Specific alterations in gut microbiota in patients with chronic kidney disease: an updated systematic review. Renal Failure. 43(1):102–112.