
 ?Mathematical formulae have been encoded as MathML and are displayed in this HTML version using MathJax in order to improve their display. Uncheck the box to turn MathJax off. This feature requires Javascript. Click on a formula to zoom.
ABSTRACT
A portable single-sided nuclear magnetic resonance (NMR) surface scanner was applied to the non-destructive quantification of lipid and water in meat block samples of farmed bluefin tuna (Thunnus thynnus). Proton NMR relaxation measurements of the fresh meat block samples were performed at room temperature in a laboratory. Totally, 34 tuna meat block samples were measured; the required measurement time was approximately 70 s for each sample. The results yielded estimation errors of 3.7 and 2.7 g/100 g for the lipid and water weight fractions, respectively. The investigation depth of the sensor was as deep as 3 cm, which enables the non-destructive quantification of the meat of the intact whole tuna beneath the thick scales, skin, and subcutaneous fat in markets and seafood factories.
Introduction
The lipid content of fresh tuna is an important factor for determining meat quality and price (Shimose et al., Citation2018). Thus, there is a high demand for non-destructive, rapid, portable, and precise measurement systems to enable buyers to more precisely evaluate the meat quality of tuna. Such measurement systems of the lipid content are also needed for the quality control of aquatic food products at factories (Marcone et al., Citation2013; Tao and Ngadi, Citation2018). One such measurement system is a low-field time-domain (non-imaging) proton nuclear magnetic resonance (NMR) surface scanner using single-sided permanent magnets (Blümich et al., Citation2008; Blümich and Singh, Citation2018; Capitani et al., Citation2017; Casanova et al., Citation2011; Erikson et al., Citation2012). NMR surface scanners allow the water and lipid contents to be quantified separately by taking advantage of the difference between the proton spin-spin relaxation times (T2 values) of the water molecules in the muscle and the lipid molecules. This NMR method is advantageous over other methods employing near infrared, microwaves, and electrical current (Tao and Ngadi, Citation2018; Willis and Hobday, Citation2008; Xiaobo et al., Citation2016) in that the sensed region can lie completely in the meat portion, and the undesirable effects of the backbone and skin (Kent, Citation1990; Koyama et al., Citation2018; Nielsen et al., Citation2005; Shimamoto et al., Citation2003) can be neglected.
Unfortunately, the investigation depth (the distance from the sensor coil to the center of the sensed region) of single-sided NMR scanners previously developed for the measurement of the lipid and water contents of relatively small fish (i.e. Atlantic salmon) is on the order of several millimeters because of the small dimensions of the magnets used (Aursand et al., Citation2008; Veliyulin et al., Citation2005). Such a depth of investigation is too shallow to probe the meat beneath the thick skin with scales and subcutaneous fat of large tuna. In response to this issue, in this study, an NMR scanner with a large single-sided magnet originally developed for the lipid and water measurements of the trapezius muscle of live cattle was employed to assess tuna meat. The NMR cattle scanner provides an investigation depth of 3 cm, which is sufficient to probe the meat of large tuna beneath the skin and subcutaneous fat. The cattle scanner system was improved in the present study by implementing a system of magnet temperature stabilization by water circulation. Fresh tuna meat block samples with and without skin were measured using the improved NMR scanner at room temperature in a laboratory to confirm its ability to accurately quantify the lipid and water contents of tuna meat instead of beef meat. Special care was taken to demonstrate the negligible effects of the tuna skin on the NMR measurement accuracy, because the skin is known to affect the measurement accuracy of other methods (e.g. near infrared spectroscopy and electrical or electromagnetic methods; Kent, Citation1990; Nielsen et al., Citation2005; Shimamoto et al., Citation2003).
Methods and samples
Single-sided NMR scanner
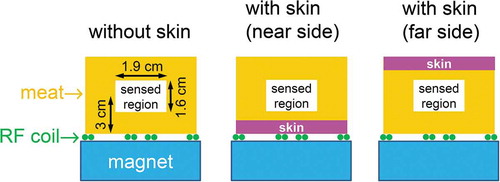
The NMR live cattle scanner was applied to the measurements of packed fresh tuna meat samples in the present study. The NMR sensor unit consists of a Nd-Fe-B magnet made by Hitachi Metals, Ltd. (Tokyo, Japan), an in house built planar radio-frequency (RF) coil, and a tuning and matching (T/M) box with capacitors, as shown in . The details of the scanner can be found in a previous report (Nakashima, Citation2015). Briefly, thanks to the single-sided magnet geometry, one side of the planar RF coil is exposed to free space, enabling the non-destructive surface scanning of large objects such as live cattle and intact whole tuna. The sensed region of the RF coil has large dimensions of 1.9 × 1.9 × 1.6 cm3, with the 1.6 cm dimension in the direction normal to the coil, due to the carefully designed magnetic circuit with a sweet spot (Marble et al., Citation2007; Utsuzawa and Fukushima, Citation2017). The investigation depth (the distance from the RF coil to the center of the sensed region) can be up to 3 cm (). The RF coil and the magnetic circuit are designed such that the first ≈2 cm from the coil surface do not contribute to the NMR signals. Thus, NMR signals from the subcutaneous fat layer and skin of fish can be eliminated, and NMR signals can be obtained from a region composed of only tuna meat distant from the skin by ≈3 cm. The scanner system is portable and compatible with an AC 100 V power supply.
Figure 1. Photograph of a packed tuna meat sample on the planar RF coil. The system is placed on an RF shield cloth to cancel environmental RF noise. The diameter of the blue plastic cover of the magnet is 31 cm. A copper foil (300 × 300 × 0.2 mm3) with slits was inserted between the RF coil and the blue magnet cover to reduce the undesirable eddy current induced by the RF pulses. The side of the cylindrical magnet was covered with a heat insulator (polyurethane foam). The magnet was placed on an aluminum disk in which water with a constant temperature was circulated to reduce the undesirable temperature drift of the magnet.
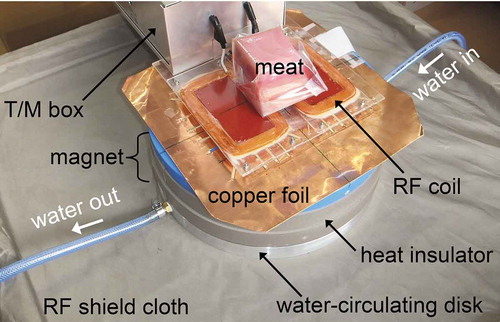
Figure 2. Schematics of fish meat samples mounted on the sensor, which consists of an RF coil and a magnet. The investigation depth was 3 cm. Two types of meat samples were prepared: meat with and without skin. Two sample arrangements were considered for samples with skin: the near- and far-side arrangements.
The Nd-Fe-B permanent magnet of is characterized by a large sweet spot (i.e. sensed region) with a magnetic field gradient as small as ≈100 mT/m (Nakashima, Citation2015), which ensures large signal-to-noise ratios for NMR signals. However, the small field gradient makes the system sensitive to the temperature change of the magnet. For example, if the magnet temperature is increased by 1°C, the static magnetic field of the sweet spot decreases by 0.11 mT, corresponding to the Larmor frequency decrease by 4.5 kHz. The value of 4.5 kHz is comparable to ± 5 kHz, which is the frequency range covered by the rectangle RF pulse with a duration of 0.2 ms of the scanner. We have confirmed experimentally that such downward shift of 4.5 kHz yielded the NMR signal reduction by approximately 40% (unpublished data). If the magnet temperature varies with the ambient temperature during experiments, the optimal tuning of the RF coil could be lost, resulting in the underestimation of the NMR signal. Thus, the magnet temperature was stabilized by constructing an aluminum disk for water circulation () in the present study. A pump system with thermostats was used to circulate water with a constant temperature (23.0°C) through the aluminum disk at a flow rate of 15 L/min. As a result, the fluctuation of the magnet temperature could be reduced to less than 0.1°C, ensuring reliable quantitative NMR measurements using the permanent magnet.
The transient transverse relaxation of protons (1H nuclei) in tuna meat samples was measured using the NMR scanner. The targets were the protons of water molecules in muscle and those of lipid molecules. The proton Larmor frequency is 4.1 MHz. A phase-alternated pair stacking (PAPS) Carr Purcell Meiboom Gill (CPMG) pulse sequence was employed to acquire the proton transverse relaxation data (Nakashima, Citation2015). The parameters of the PAPS CPMG sequence were as follows. The duration of the 90º and 180º pulses was 0.2 ms, the echo spacing was 0.5 ms, the sequence repetition time was 2.2 s (i.e. the T1 full relaxation condition, where T1 refers to the spin-lattice relaxation time, as listed in ), the number of echoes was 1200, and the number of stacked signals was 32. Thus, an NMR measurement time of approximately 70 s (2.2 s × 32 times) was required for each sample. The resultant quality factor Q of the RF coil ranged from 37 to 43 depending on the tuna sample on the coil. The sensor unit with a tuna sample mounted for measurement () was completely covered with an RF shield cloth (see Figure ESM_7 of Nakashima (Citation2015)) during the NMR measurements to reduce the environmental RF noise.
Table 1. Properties of end member samples (subcutaneous fat and lean meat) from three bluefin tuna (A to C). Note the evident difference in the T2 values between the end member samples.
Sample description
Three fresh tuna (fish A to C) were purchased from local stores; all three were farmed bluefin tuna (Thunnus thynnus), as listed in . In total, 34 boneless meat block samples were cut from the tuna and vacuum-sealed in thin plastic films to prevent undesired water evaporation and fat alteration during the NMR experiments. Totally, 31 of the 34 packed samples were roughly cubical, with sides approximately 6 cm in length, large enough to completely cover the sensed region of 1.9 × 1.9 × 1.6 cm3; additionally, 30 of the 31 cubical samples were white muscle and covered a broad range of lipid contents from lean meat to fatty meat, and the remaining sample was dark muscle. Three of the 34 samples were almost pure subcutaneous fat with negligible amounts of lean meat. These three samples were prepared by collecting the thin fat layer near the skin and were unfortunately small in volume in comparison with the sensed region. These samples played the important role as end member samples for the lipid quantification by NMR, as described in the next section. Each packed meat sample was left in the laboratory for several hours to allow it to equilibrate with the ambient room temperature (23 to 26°C), placed on the RF coil (), adjusted for T/M, covered with an RF shield cloth, and then measured using the PAPS CPMG method.
In the NMR experiments, special care was taken to examine the effect of skin with scales on the measurement accuracy of the lipid and water contents of the meat samples. This is because the presence or state of the fish skin is critical to the accuracy of other techniques (e.g. measurements of near infrared spectra, microwave attenuation, and electrical impedance; Kent, Citation1990; Kubo et al., Citation2016; Nielsen et al., Citation2005; Shimamoto et al., Citation2003; Tao and Ngadi, Citation2018). Among the 31 almost cubical samples, 18 and 13 samples were prepared with and without skin, respectively. In the measurements of the 18 samples with skin, two arrangements were examined in the NMR measurement: the near- and far-side arrangements, in which the skin is located on the sides of the sample nearest to and farthest from the RF coil, respectively (). The near-side case represents the conditions of the non-destructive measurement of an intact whole fish with the RF coil in contact with the skin. The electromagnetic coupling between the RF coil and the skin may be stronger in the near-side case than in the far-side case. The coupling effects of the skin on the accuracy of lipid and water estimation by NMR scanning was examined by comparing these two cases.
After the NMR measurements, a small piece of meat with sides of approximately 4 cm in length was cut from each sample, taking care to include the sensed region of 1.9 × 1.9 × 1.6 cm3 but not skin with scales. The lipid and water contents of these tuna meat pieces were then analyzed using the conventional food chemical analysis techniques indicated in to determine their true contents. The details of the techniques followed the Standard Tables of Food Composition in Japan 2015 (7th Ed.) determined by the Ministry of Education, Culture, Sports, Science and Technology, Japan. The accuracy of the NMR method was then evaluated by comparing the results obtained by NMR and conventional analysis. For a limited number of meat pieces, the iron and protein contents were also analyzed using the conventional food analysis techniques noted in . The purpose of the iron analysis was to discuss the effects of iron atoms with unpaired electrons (Lauffer, Citation1987) on the T2 values of water in muscle, and the purpose of the protein analysis was to confirm that boneless meat can be well approximated as a mixture of lipid, water, and protein.
Principle of the lipid/water quantification by T2 relaxometry
The principle of the lipid and water quantification of tuna meat samples by T2 relaxation data processing is described here. The raw time-series data, f(t), obtained by T2 relaxometry using the PAPS CPMG pulse sequence consisted of 1200 echo data points, where t is time. The first four echoes were discarded, because the initial echoes are inevitably transient and distorted due to the grossly inhomogeneous magnetic and RF fields (Hürlimann and Griffin, Citation2000). The time-series data were then divided by Q0.5, where Q is the quality factor of the RF coil; as stated previously, Q varied in the range of 37 ≤ Q ≤ 43 among the tested samples. This quality factor correction was performed because the magnitude of f(t) increases with Q0.5 (Doty et al., Citation1981; Hoult and Bhakar, Citation1997) and thus must be scaled to quantitatively compare PAPS CPMG datasets obtained in cases with different Q values.
As a final step, it was assumed that boneless fatty tuna meat is a mechanical mixture of muscle (water + protein) and lipid. This assumption is the same as that employed for the quantification of lipid and water in beef samples (Nakashima, Citation2015). Although it is difficult to obtain proton relaxation signals from the protein macromolecules using low-field time-domain NMR, they can be readily obtained from small water and lipid molecules with relatively high mobility. Thus, the obtained time-series data were a mixture of proton relaxation signals from the two end members, lipid and water, as
where alipid and awater are the NMR signal amplitudes for lipid and water, respectively, and T2lipid and T2water are the T2 values for lipid and water, respectively. The values of alipid and awater were determined from Eq. (1) using the method of least squares, and the constants T2lipid and T2water were calculated using the following method.
The measurement results of three samples of lean meat with negligible lipid contents and three samples of almost pure subcutaneous fat with a small amount of water are listed in as the properties of the end members. In the present study, T2lipid and T2water were taken to be 156 and 53 ms, which are the arithmetic average of the three subcutaneous fat samples and that of the three lean meat samples in , respectively. It should be noted that T2lipid and T2water are significantly different, as has been reported for salmon (Veliyulin et al., Citation2005) and beef (Nakashima, Citation2015), which ensures the lipid and water contained in the samples can be differentiated with reasonable accuracy.
Results
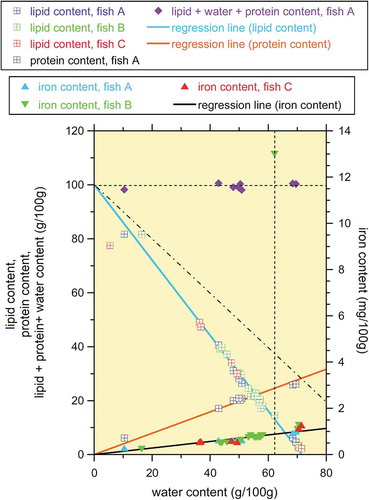
The results of the conventional food chemical analysis of the tuna samples that were also analyzed by the NMR method are summarized in . All contents are expressed in units of mass per 100 g of tuna meat. Additionally, the results in are shown as the lipid, protein, and iron contents plotted against the water content. The lipid and protein contents were found to correlate negatively (Kent, Citation1990) and positively with the water content, respectively. The fact that the slope of the regression line for the lipid content is as steep as – 1.4 (that is, steeper than – 1) suggests that the protein content increases with water content, which was confirmed by the above-mentioned positive correlation between the protein and water contents. The sum of the lipid, water, and protein contents for fish A was almost 100 g/100 g, as shown in , confirming the validity of the assumption given in the previous section that boneless tuna meat is a mixture of muscle (water + protein) and lipid. According to the preliminary meat analysis of a bluefin tuna (i.e. not fish A, B, or C), the ash and carbohydrate contents were negligible in comparison with the sum of the lipid, water, and protein contents, again supporting the above assumption. The slope of the regression line describing the relationship between the protein and water contents (0.4 in ) was used to convert the water content into muscle content, as presented in the next section. The iron content was found to correlate positively with the protein content. This is likely a consequence of the fact that much of the iron is stored in muscle, not in fatty tissue, as myoglobin.
Three examples of PAPS CPMG time series datasets corrected by the corresponding Q values are shown in . As expected from , the two end members, the subcutaneous fat and lean meat samples, exhibited slow and fast T2 decays, respectively. The fatty tuna meat sample (lipid content of 40.6 g/100 g, water content of 42.9 g/100 g) showed proton decay with an intermediate time constant between those of the end members. The reasonable fit of Eq. (1) to the time series data in justifies the proposed simple model assuming a single T2 decay component for each end member. The signal amplitude (i.e. signal intensity as t → 0) for the subcutaneous fat sample was significantly smaller than those for the other two samples shown in . This is a consequence of the fact that this sample (as well as the other two subcutaneous fat samples listed in ) is small in volume relative to the sensed region. Because this small amplitude yields an undesirable underestimation of the lipid and water contents, the data for the three subcutaneous fat samples in are omitted in and .
The signal amplitudes alipid and awater obtained by fitting Eq. (1) to the PAPS CPMG time series data are plotted against the measured lipid and water contents in . The data were obtained from the 13 samples without skin and 18 samples with skin, which had a large volume (side lengths of approximately 6 cm). Because two arrangements (the near- and far-side cases depicted in ) were examined for the samples with skin, the total number of data points in is 13 + 18 × 2 = 49. Regression analysis was performed to calibrate the system, and the obtained correlation coefficients were 0.96 and 0.95 for lipid and water, respectively. These are nearly unity and are comparable to the degrees of the correlation reported by previous fish measurements (Aursand et al., Citation2008; Veliyulin et al., Citation2005) using single-sided magnets.
The regression lines in were then employed to convert the alipid and awater values into lipid and water contents, and the results are shown in . The root mean square residuals of the 49 data points for the lipid and water contents were 3.7 and 2.7 g/100 g, respectively. It is also possible to convert the water content into the muscle (water + protein) content because the ratio of protein to water is constant (i.e. 0.4), as shown in . The muscle content calculated as 1.4 times the water content is shown in . This cross plot is the final product of the present study, and it allows the error of the NMR method to be estimated, as discussed in the next section.
Figure 3. Results of the chemical analysis of tuna meat samples obtained using the methods noted in . The dash-dotted line has a slope of – 1, and the horizontal dotted line represents 100 (g/100 g). The data points for the dark muscle sample lie along the vertical dotted line. The three regression lines were obtained using the method of least squares (the data for the dark muscle sample were not considered in the regression analysis for the iron content). A linear relationship was observed between each of the lipid, protein, and iron contents and the water content, excluding the case of the unusually high iron content of the dark muscle sample.
Discussion
From the fitting of Eq. (1) to the PAPS CPMG time-series data (), calibration lines with high correlation coefficients were obtained (). These calibration results yielded a cross plot () indicating that the estimation errors, which were calculated as the root mean square residuals, for lipid and water were as small as 3.7 and 2.7 g/100 g, respectively. This error level is comparable to that obtained by the near infrared spectroscopy for yellowfin tuna (Khodabux et al., Citation2007). It should also be noted that the scattering of the data points in was independent of the fish (A to C in ), implying that the calibration lines are universal. The measurement time was as short as approximately 70 s for each sample, and potentially it can be shortened by reducing the number of signal stacking (Nakashima, Citation2015). Thus, the single-sided NMR scanner is a promising tool for the rapid, non-destructive, accurate estimation of the lipid and water content of fresh tuna meat.
Figure 4. Examples of the PAPS CPMG time-series data corrected by each Q value for three samples from fish A. The properties of the subcutaneous fat and lean meat samples without skin are listed in . According to the conventional chemical analysis in , the lipid, water, protein, and iron contents of the fatty meat sample were 40.6 g/100 g, 42.9 g/100 g, 17.1 g/100 g, and 0.62 mg/100 g, respectively. The fatty meat sample with skin was measured with the near side arrangement (see ). The model given by Eq. (1) obtained using the method of least squares is superimposed using a solid line for each sample.
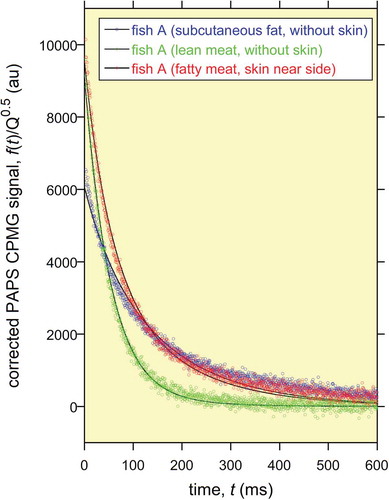
Figure 5. Calibration of the PAPS CPMG measurements using the 31 tuna meat samples. The correlation coefficient R is given in each plot. (a) Calibration for lipid content. (b) Calibration for water content.
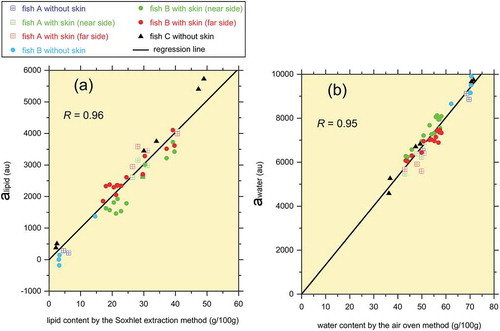
Figure 6. Cross plots of the lipid and water contents measured by NMR and conventional analytical methods. (a) Lipid content. (b) Water content. The solid and dashed lines correspond to errors of 0 and ±5 g/100 g, respectively. The water content is also converted into the muscle (water + protein) content in (b).
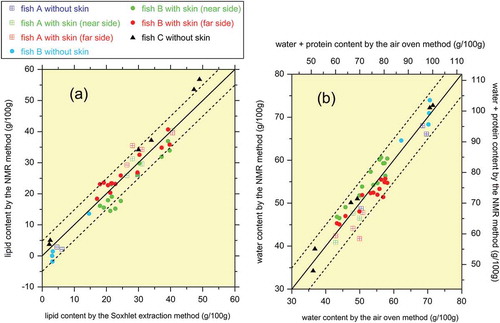
When discussing fish meat quality, it is desirable to measure the muscle (water + protein) content rather than the water content alone. Unfortunately, protein is a macromolecule and thus cannot be detected using the low-field time-domain NMR scanner employed in the present study because of the low mobility or self-diffusivity of macromolecules. This makes it difficult to directly quantify the muscle content using the proposed NMR apparatus. However, it is possible to estimate the muscle content via the water content using a method that has been successfully applied to beef meat in a previous study (Nakashima, Citation2015). As shown in , the ratio of the protein weight fraction to the water weight fraction is constant at 0.4. Thus, the muscle content (water + protein content) can be estimated as 1.4 times the water content, which is indicated in . This linear water-to-muscle conversion is expected to be useful to estimate the lean meat quantity as the sum of the water and protein contents excluding the lipid content.
The accuracy of the non-destructive lipid measurements employing different principles (near infrared spectroscopy and electrical and electromagnetic measurements) is reduced by the state of the skin (thickness and degree of wetness), as reported by Kent (Citation1990), Shimamoto et al. (Citation2003), Nielsen et al. (Citation2005), and Kubo et al. (Citation2016). The near- and far-side sample arrangements () were employed to examine the effects of the presence of skin on the NMR accuracy. Fortunately, as summarized in , no significant difference was observed between the two arrangements, suggesting that the electromagnetic coupling between the skin and the RF coil is negligible. This is a consequence of the static and RF magnetic fields penetrating the skin (as well as the lipid and muscle) without significant absorption/scattering/distortion, which is not the case for near infrared rays and electrical current. Although the effects of the degree of wetness of the skin on the NMR accuracy were not examined in the present study, these effects would likely also be negligible because the wetness of the skin does not affect the penetration of the magnetic fields. The observed independence of the accuracy of the NMR method on the skin suggests that it will be possible to scan any portion of the meat of intact whole fish beneath the skin with the accuracy demonstrated in .
The model given by Eq. (1) assumes that the T2water value is constant for all samples and is independent of the iron content. This assumption may break down if the iron content is abnormally large because of the strong relaxation effect induced by the unpaired electrons of iron atoms. Fortunately, however, the iron content of the analyzed samples was small, with the highest measured iron content equal to 13.0 mg/100 g for the dark muscle sample, as shown in . According to the literature (Mitsumori et al., Citation2012; Pierre et al., Citation2005), this iron concentration is too low to significantly reduce the T2 of the water contained in the tuna samples. Thus, the constant-T2water model employed in the present study is reasonable, as evidenced by the large correlation coefficients of the calibration lines in .
In the present study, T2 values for lipid and water are taken to be 156 and 53 ms, respectively. Proton T2 values measured by single-sided NMR scanners are often affected by the diffusion of hydrogen-bearing molecules in inhomogeneous magnetic fields. As a result, T2 values strongly depend on the strength of the static field gradient of the sensed region and on the echo spacing (Cabeęa et al., Citation2011; Pedersen et al., Citation2003). For example, smaller T2lipid and T2water values are reported by Veliyulin et al. (Citation2005) for a different single-sided scanner with a larger field gradient (approximately 10 T/m). Thus, T2lipid and T2water in Eq. (1) should be properly determined for each measurement system.
The definite sensed region of the NMR sensor () should be noted as an advantage of the NMR method over other methods. For example, the electrical impedance method (Shimose et al., Citation2018) inevitably allows the electrical current to flow in a broad region within the fish body, including bones, which have a conductivity very different from that of the target meat, necessitating data correction according to the fish size and species (Koyama et al., Citation2018). In contrast, the undesired signals from bones, which also have different lipid and water contents from the meat, can be eliminated in the NMR method if all bones are located outside of the compact sensed region (1.9 × 1.9 × 1.6 cm3). In this case, complex NMR data correction considering the fish size and species is not needed.
Although the measurements were performed in the laboratory of our institute for meat block samples in the present study, the NMR scanner system can be operated wherever an AC 100 V power line is available. As a demonstration of this, the NMR scanning of intact whole bluefin tuna in a local domestic site distant from our institute has been performed successfully (unpublished data). Thus, the single-sided NMR scanner system is expected to be applicable to the rapid, accurate, non-destructive quantification of the lipid, water, and muscle contents of intact whole fish in markets and seafood factories.
Conclusions
A single-sided NMR scanner was applied to the non-destructive quantification of the lipid and water contents of 34 meat block samples of bluefin tuna at room temperature in a laboratory. Reasonable calibration lines were obtained for the lipid and water contents through the time-domain analysis of the proton T2 relaxation data coupled with the conventional food chemical analysis of the samples. The calibration results revealed that (i) the estimation error of the lipid and water weight fractions was small at 3.7 and 2.7 g/100 g, respectively, and (ii) the effects of the tuna skin were not significant. The investigation depth of the scanner is 3 cm, which is considered to be sufficient for the on-site quantification of the lipid and muscle contents of the meat of the intact whole tuna beneath the skin with scales and subcutaneous fat.
Disclosure statement
No potential conflict of interest was reported by the authors.
Additional information
Funding
References
- Aursand, I. G., Veliyulin, E., and Erikson, U. 2008. Low field NMR studies of Atlantic salmon (Salmo salar). In: Modern Magnetic Resonance. Webb, G. A. (Ed.). Dordrecht: Springer. Pp. 905–913.
- Blümich, B., Perlo, J., and Casanova, F. 2008. Mobile single-sided NMR. Prog. Nucl. Magn. Reson. Spectrosc. 52: 197–269. doi:10.1016/j.pnmrs.2007.10.002
- Blümich, B., and Singh, K. 2018. Desktop NMR and its applications from materials science to organic chemistry. Angew. Chem. Int. Ed. 57: 6996–7010. doi:10.1002/anie.v57.24
- Cabeęa, L. F., Marconcini, L. V., Mambrini, G. P., Azeredo, R. B., and Colnago, L. A. 2011. Monitoring the transesterification reaction used in biodiesel production, with a low cost unilateral nuclear magnetic resonance sensor. Energy Fuels. 25: 2696–2701. doi:10.1021/ef200294j
- Capitani, D., Sobolev, A. P., Di Tullio, V., Mannina, L., and Proietti, N. 2017. Portable NMR in food analysis. Chem. Biol. Technol. Agric. 4: 17. doi:10.1186/s40538-017-0100-1
- Casanova, F., Perlo, J., and Blümich, B. (Eds.). 2011. Single-Sided NMR. Heidelberg: Springer Berlin.
- Doty, F. D., Inners, R. R., and Ellis, P. D. 1981. A multinuclear double-tuned probe for applications with solids or liquids utilizing lumped tuning elements. J. Magn. Reson. 43: 399–416.
- Erikson, U., Standal, I. B., Aursand, I. G., Veliyulin, E., and Aursand, M. 2012. Use of NMR in fish processing optimization: a review of recent progress. Magn. Reson. Chem. 50: 471–480. doi:10.1002/mrc.3825
- Hoult, D. I., and Bhakar, B. 1997. NMR signal reception: virtual photons and coherent spontaneous emission. Concepts Magn. Reson. 9: 277–297. doi:10.1002/(ISSN)1099-0534
- Hürlimann, M. D., and Griffin, D. D. 2000. Spin dynamics of Carr-Purcell-Meiboom-Gill-like sequences in grossly inhomogeneous B0 and B1 fields and application to NMR well logging. J. Magn. Reson. 143: 120–135. doi:10.1006/jmre.1999.1967
- Kent, M. 1990. Hand-held instrument for fat/water determination in whole fish. Food Control. 1: 47–53. doi:10.1016/0956-7135(90)90121-R
- Khodabux, K., L’Omelette, M. S. S., Jhaumeer-Laulloo, S., Ramasami, P., and Rondeau, P. 2007. Chemical and near-infrared determination of moisture, fat and protein in tuna fishes. Food Chem. 102: 669–675. doi:10.1016/j.foodchem.2006.05.057
- Koyama, T., Hasegawa, J., Takiguchi, A., et al. 2018. Development of techniques for estimating fish lipid content of chub mackerel Scomber japonicas using bioelectrical impedance. Nippon Suisan Gakk. 84: 274–279. (in Japanese with English abstract and figure captions). doi:10.2331/suisan.17-00052
- Kubo, K., Matsumoto, Y., Kuwahara, K., et al. 2016. Nondestructive determination of fat content in yellowtail and horse mackerel by impedance analysis. Nippon Suisan Gakk. 82: 743–752. (in Japanese with English abstract and figure captions). doi:10.2331/suisan.16-00009
- Lauffer, R. B. 1987. Paramagnetic metal complexes as water proton relaxation agents for NMR imaging: theory and design. Chem. Rev. 87: 901–927. doi:10.1021/cr00081a003
- Marble, A. E., Mastikhin, I. V., Colpitts, B. G., and Balcom, B. J. 2007. A compact permanent magnet array with a remote homogeneous field. J. Magn. Reson. 186: 100–104. doi:10.1016/j.jmr.2007.01.020
- Marcone, M. F., Wang, S., Albabish, W., Nie, S., Somnarain, D., and Hill, A. 2013. Diverse food-based applications of nuclear magnetic resonance (NMR) technology. Food Res. Int. 51: 729–747. doi:10.1016/j.foodres.2012.12.046
- Mitsumori, F., Watanabe, H., Takaya, N., et al. 2012. Toward understanding transverse relaxation in human brain through its field dependence. Magn. Reson. Med. 68: 947–953. doi:10.1002/mrm.23301
- Nakashima, Y. 2015. Development of a single-sided nuclear magnetic resonance scanner for the in vivo quantification of live cattle marbling. Appl. Magn. Reson. 46: 593–606. doi:10.1007/s00723-015-0657-4
- Nielsen, D., Hyldig, G., Nielsen, J., and Nielsen, H. H. 2005. Lipid content in herring (Clupea harengus L.)—influence of biological factors and comparison of different methods of analyses: solvent extraction, Fatmeter, NIR and NMR. LWT. 38: 537–548. doi:10.1016/j.lwt.2004.07.010
- Pedersen, H. T., Ablett, S., Martin, D. R., Mallett, M. J. D., and Engelsen, S. B. 2003. Application of the NMR-MOUSE to food emulsions. J. Magn. Reson. 165: 49–58.
- Pierre, T. G. S., Clark, P. R., Chua-Anusorn, W., et al. 2005. Noninvasive measurement and imaging of liver iron concentrations using proton magnetic resonance. Blood. 105: 855–861. doi:10.1182/blood-2004-01-0177
- Shimamoto, J., Hiratsuka, S., Hasegawa, K., Sato, M., and Kawano, S. 2003. Rapid non-destructive determination of fat content in frozen skipjack using a portable near infrared spectrophotometer. Fish. Sci. 69: 856–860. doi:10.1046/j.1444-2906.2003.00698.x
- Shimose, T., Kanaiwa, M., and Tanabe, T. 2018. Influence of the fat content on the auction price of Pacific bluefin tuna Thunnus orientalis at Japanese fish markets. Fish. Res. 204: 224–230. doi:10.1016/j.fishres.2018.03.001
- Tao, F., and Ngadi, M. 2018. Recent advances in rapid and nondestructive determination of fat content and fatty acids composition of muscle foods. Crit. Rev. Food Sci. Nutr. 58: 1565–1593. doi:10.1080/10408398.2016.1261332
- Utsuzawa, S., and Fukushima, E. 2017. Unilateral NMR with a barrel magnet. J. Magn. Reson. 282: 104–113. doi:10.1016/j.jmr.2017.07.006
- Veliyulin, E., van der Zwaag, C., Burk, W., and Erikson, U. 2005. In vivo determination of fat content in Atlantic salmon (Salmo salar) with a mobile NMR spectrometer. J. Sci. Food Agric. 85: 1299–1304. doi:10.1002/(ISSN)1097-0010
- Willis, J., and Hobday, A. J. 2008. Application of bioelectrical impedance analysis as a method for estimating composition and metabolic condition of southern bluefin tuna (Thunnus maccoyii) during conventional tagging. Fish. Res. 93: 64–71. doi:10.1016/j.fishres.2008.02.010
- Xiaobo, Z., Xiaowei, H., and Povey, M. 2016. Non-invasive sensing for food reassurance. Anal. 141: 1587–1610. doi:10.1039/c5an02152a