
Abstract
Ovarian cancer stem cells (OCSCs) that are a subpopulation within bulk tumor survive chemotherapy and conduce to chemo-resistance and tumor relapse. However, conventional gene delivery is unsuitable for the on-demand content release, which limits OCSCs therapeutic utility. Here, we reported ultrasound-targeted microbubble destruction (UTMD)-triggerable poly(ethylene glycol)-disulfide bond-polyethylenimine loaded microbubble (PSP@MB). Taking advantage of glutathione (GSH) responsiveness, ultrasound triggering and spatiotemporally controlled release manner, PSP@MB is expected to realize local gene delivery for OCSCs treatment. But the biophysical mechanisms of gene delivery via PSP@MB and ultrasound remain unknown. The aim of this study is to determine the potential of gene delivery to OCSCs via ultrasonic synergistic biophysical effects and GSH-sensitive PSP@MB. The GSH-sensitive disulfide bond cleavable properties of PSP@MB were confirmed by 1H NMR spectra and infrared spectroscopy. The biophysical mechanisms between PSP@MB and cells were confirmed by scanning electron microscopy (SEM) and confocal laser scanning microscope (CLSM) to optimize the ultrasonic gene delivery system. The gene transfection via ultrasound and PSP@MB was closely related to the biophysical mechanisms (sonoporation, enhanced-endocytosis, sonoprinting, and endosomal escape). Ultrasound combined with PSP@MB successfully delivered aldehyde dehydrogenase 1 (ALDH1) short hairpin RNA (shRNA) plasmid to OCSCs and promoted apoptosis of OCSCs. The gene transfection rate and apoptosis rate were (18.41 ± 2.41)% and (32.62 ± 2.36)% analyzed by flow cytometry separately. This study showed that ultrasound triggering and GSH responsive PSP@MB might provide a novel strategy for OCSCs treatment via sonoporation and enhanced-endocytosis.
Introduction
Ovarian cancer (OC) is the most fatal gynecological cancer, with approximately 295,414 new cases diagnosed and 184,799 died in the worldwide annually (Bray et al., Citation2018). The five-year survival rate is 29% at advanced stage (Reid et al., Citation2017). Currently, the first-line therapy for OC consists of surgical resection followed by chemotherapy. Although these strategies are initially effective, approximately 80% of OC patients with advanced stage experience recurrence and chemo-resistant. It is urgent to better understand the recurrence and chemo-resistant. Some study (Zong & Nephew, Citation2019) has showed that the chemotherapy could not eradicate the quiescent ovarian cancer stem cells (OCSCs). OCSCs are a subpopulation within ovarian tumor with high clone-genesis capacity and tumorigenesis (Seo et al., Citation2016; Li et al., Citation2017). Resistance to chemotherapy and radiotherapy has been shown for OCSCs. Therefore, OCSCs have been proposed as the root of ovarian tumor relapse (Lheureux et al., Citation2019). Consequently, it is crucial to design a novel strategy to target OCSCs and sensitize them to chemotherapy (Sotiropoulou et al., Citation2014; Wang et al., Citation2019a,Citationb). Current therapeutic strategies mainly involve targeting OCSCs markers, epigenetic features, stem cell signaling, metabolic traits, and microenvironment (Zong & Nephew, Citation2019). Among these strategies, gene therapy represents an attractive alternative treatment for OCSCs.
Gene therapy is the main stream as an important part of biotherapies now (Foldvari et al., Citation2016). Gene therapy can be classified as two kinds, that the first is to deliver a functional gene copy to fix defective one, while the second is to deliver RNA interference (RNAi) that can suppress pathological gene expression (Kargaard et al., Citation2019). Gene regulation of nucleic acids has played a critical role in cancer via RNAi. However, unsuccessful gene therapy is often due to the lack of safe and efficient tools to target delivery into the local site in vivo. Also, the naked gene is susceptible to nuclease degradation and unstable in the body (Silva et al., Citation2011). Non-viral vectors have been widely investigated for gene targeted delivery to solid tumor. Non-viral vectors are mainly including cationic polymers, liposomes, and peptide-based nanoparticles. Compared with viral vectors, non-viral vectors have the advantage of a decreased immune response, more flexibility in design and low cytotoxicity (Riley & Vermerris, Citation2017). Among the non-viral gene carriers, 25 kDa polyethylenimine (PEI) is considered as a gold standard in gene delivery (Patnaik & Gupta, Citation2013). However, high gene transfection efficiency of 25 kDa PEI always accompanies with high cytotoxicity (Zhang et al., Citation2018). To accomplish more safe gene transfection, some researchers have applied modifications to 25 kDa PEI (Lei et al., Citation2013; Luo et al., Citation2017). PEGylation can decrease the cytotoxicity and immunogenicity of PEI, improve stability, prevent aggregation, and assist long circulation (Guan et al., Citation2017). Although the poly(ethylene glycol)-disulfide bond-polyethylenimine (PSP) nanoparticles have high gene delivery transfection in vitro, but it lacks of targeting ligands and it is significant challenges for gene delivery to across biological membranes in vivo. Ultrasound-targeted microbubble destruction (UTMD) provides a novel strategy for gene delivery due to controlled release spatiotemporally, non-invasiveness, and high tissue-penetrating ability. Recently, one study (Chen et al., Citation2020) has reviewed that the targeted engineering nanoparticle-loaded bacteria for treating cancer. Some studies (De Cock et al., Citation2016; Fan et al., Citation2017; Roovers et al., Citation2019b) have showed that ultrasound combined with nanoparticles-loaded microbubble (MB) could improve the drug delivery, but the nanoparticles mixed with MBs did not enhance the drug delivery efficiency. Primary radiation force can produce displacement of the nanoparticle-loaded MBs away from the transducer toward the ultrasonic beam. The secondary radiation force can generate a reversible attraction between nanoparticles and accumulate nanoparticles onto the cell membrane. These processes are termed ‘sonoprinting’. Ultrasound has a unique potential to enhance gene delivery efficiency due to ultrasonic biophysical mechanisms: opening inter-endothelial junctions, sonoporation, enhanced-endocytosis, and sonoprinting. Unique ultrasound-cell membrane biophysical effects provide a spatiotemporal controlled release and reversible time-window for the gene delivery across biological membranes and endothelial barriers.
We aimed to construct a safe, efficient, acoustic responsive, and glutathione (GSH)-sensitive vector, polyethylene glycol-disulfide bond-polyethylenimine loaded microbubble (PSP@MB). PSP@MB is consisted of two major parts, including PEGylation polyethyleneimine nanoparticles linked with disulfide bond (S–S), and lipid MBs, conjugated with biotin–avidin bridge. The PSP@MB gene delivery vector possesses the advantages as follow. The first part is GSH responsive PSP nanoparticles. (i) The high transfection efficiency of 25 kDa PEI is because it has superb complexing gene capability and proton sponge effect. (ii) Modifying PEI with PEG via disulfide bond shields the positive charge, reduces toxicity and nonspecific interactions with serum proteins. Hence PEGylation can prolong the circulation time of nanoparticles (Patnaik & Gupta, Citation2013). (iii) The disulfide bond would be cracked because of high concentrations of GSH as soon as arriving at the tumor (Lei et al., Citation2013; Luo et al., Citation2017). Then, PEGylation shielding would rapidly disappear and release PEI/DNA (Liu et al., Citation2017). The second part is ultrasound-triggering lipid MBs. The biophysical mechanisms generated by UTMD would promote PSP/plasmid DNA (pDNA) to across the biophysical membranes. The biophysical mechanisms are including sonoporation, enhanced-endocytosis, and sonoprinting. (iv) Sonoporation promotes the gene delivery, because small molecules go through the sonoporation pores into OCSCs. (v) Enhanced-endocytosis is stimulating the gene uptake for OCSCs, due to acoustic microfluids deforming the cell membrane and rearranging the cytoskeleton (Lentacker et al., Citation2014). (vi) Sonoprinting is described that nanoparticles were deposited in patches onto cell membranes by ultrasound and nanoparticle-loaded MBs. Roovers et al. also showed that ultrasound-trigged nanoparticle-loaded MBs deposited the nanoparticles onto the outer layers of three-dimensional tumor spheroids due to sonoprinting (Roovers et al., Citation2019a).
In this article, we synthesized PSP@MB successfully. The morphology and characterization of PSP@MB were investigated. Cellular uptake experiments were conducted on OCSCs and A2780 cells. Ultrasound combined with PSP@MB promoted aldehyde dehydrogenase 1 (ALDH1) short hairpin RNA (shRNA) plasmids to target OCSCs and induced apoptosis of OCSCs in vitro. The gene transfection rate and apoptosis rate were analyzed by flow cytometry. The biophysical mechanisms, such as sonoporation and enhanced-endocytosis, were confirmed by scanning electron microscopy (SEM) and confocal laser scanning microscope (CLSM). These results are conducive to spatiotemporally controlled gene delivery.
Materials and methods
Materials
1,2-Distearoyl-sn-glycero-3-phosphoethanolamine (DSPE)-N-biotinyl polyethylene glycol (PEG)2000 (DSPE-PEG2000-Biotin) and Biotin-PEG2000-SS-NHS were provided by Xi'an Ruixi Biological Technology Co. (Xi'an, China). Dipalmitoyl-trimethylammonium-propane (DPTAP) and dipalmitoyl phosphatidylcholine (DPPC) were provided by Avanti Polar Lipids Inc. (Alabaster, AL). Perfluoropropane (C3F8) was provided by Guangdong Special Gas Co. Ltd. (Foshan, China). Aldefluor kit was provided by StemCell Technologies (Vancouver, Canada). Image-iT™ LIVE Mitochondrial Transition Pore Assay Kit was provided by Molecular Probes (UK). Calcein-AM/propidium iodide (PI), fluorescein isothiocyanate (FITC)-Avidin, Lyso-Tracker Red were provided by Beijing Solarbio Science & Technology Co. (Beijing, China). BBcellProbe C11-Phallidin Assay Kit, Cell Cycle Assay Kit, and Annexin V-APC/PI Cell Apoptosis Assay Kit were provided by BestBio (Shanghai, China). The RNAprep Pure Cell Kit was provided by Tiangen Biotech Co. (Beijing, China). One Step RT-qPCR Kit was provided by Sangon Biotech Co. (Shanghai, China). The human OC A2780 cell lines were provided by the American Type Culture Collection (Manassas, VA).
Preparation and characterization of PSP nanoparticles and PSP@MB
The biotinylated PSP nanoparticles were prepared by the 25 kDa PEI and the biotin-PEG2000-SS-NHS (mass ratio: 1/1.25). Then, the biotinylated PSP nanoparticles were purified with dialysis membrane (MW = 3500 Da) for 24 h. The biotinylated MBs were prepared with lipid shells (DPPC, DSPE-PEG2000-Biotin, and DPTAP) and the C3F8 gas core by the thin-film hydration method. The PSP@MB was prepared with the biotinylated PSP and biotinylated MB by the biotin–avidin method (patent number 202010056549.8). The zeta-potential and diameter of the PSP nanoparticles and PSP@MB were measured with Malvern (Malvern, UK) and BECKMAN COULTER (Brea, CA). The PSP@MB was verified via the fluorescence microscope and transmission electron microscope (TEM). We analyzed the DNA binding of PSP nanoparticles via the gel retardation. The experimental protocols referred to our previous works (Liufu et al., Citation2019).
Aldefluor assay and fluorescence-activated cell sorting
The OCSCs spheroid was derived from A2780 cells. A2780 cells were cultured with serum-free culture medium. ALDH1+ OCSCs were sorted with the aldefluor assay and fluorescence-activated cell sorting. Female BALB/c-nu/nu mice (4–5 weeks old) were provided by Guangdong Experimental Animal Center (SCXK (Guangdong) 2018-0002, Guangzhou, China). The animal research was approved by the Institutional Animal Care and Use Committee of Guangzhou Medical University. The colony formation assay in vitro and xenograft establishment in vivo with the ALDH1+ OCSCs and the ALDH1– cells were performed as described in our previous works (patent number 202010056543.0) (Liufu et al., Citation2019).
Gene expression analysis of OCSCs spheroids and A2780 monolayers
We analyzed the PubMed Gene Expression Omnibus (GEO) datasets (GSE53759) on OC cell lines A2780 and primary OC cells derived from malignant ascites. The GSE53759 datasets include nine samples: A2780 monolayer, OCSCs spheroids, and OCSCs spheroids to monolayer cultures (n = 3). Samples were submitted to Laboratory of Molecular Technology and analyzed.
Transfection protocol using ultrasound and PSP@MB
The OCSCs were harvested using TrypLE™ Express and resuspended in 300 μL PBS at a concentration of 1.5 × 10⁶ cells/mL. The 1.0 × 10⁷ PSP@MB in 50 μL PBS and 30 μg ALDH1 shRNA plasmid in 50 μL PBS were mixed and added into the OCSCs suspension. Before ultrasonic exposure, each cultural dish was briefly vortexed. The influences of ultrasonic parameters were studied with varied acoustic intensity and treatment time. The OCSCs were exposed with frequency of 1 MHz and duty cycle of 20%. The varied ranges for acoustic intensity and treatment time were 0.4–1 W/cm2, 30 s and 60 s, respectively. Control groups were treated with the same as other groups, but were only naked ALDH1 shRNA plasmid. There were three groups: Control group, PSP@MB group, and ultrasound (US)+PSP@MB group. Each group was repeated three times.
After ultrasound exposure, the OCSCs were incubated at 37 °C and 5% CO2 atmosphere. The OCSCs were centrifuged at 1000 rpm for 5 min and collected. For the SEM analysis, OCSCs were immediately resuspended, immobilized, coated, and analyzed. For the cell viability, GFP expression and flow cytometry assessment, the OCSCs were centrifuged at 1000 rpm for 5 min and resuspended with fresh serum free medium after ultrasound exposed 4 h. The OCSCs were cultured in the 24-cell plate, incubated 24 h in serum free medium at 37 °C and 5% CO2 atmosphere.
Flow cytometry assay of gene transfection and apoptosis
After 24 h incubation in the 24-well plate, the OCSCs were harvested using TrypLE™ Express and washed twice in PBS. The OCSCs were centrifuged at 1000 rpm for 5 min at 4 °C and resuspended with PBS at a concentration of 1 × 10⁶ cells/mL. The percentage of enhanced green fluorescence protein (EGFP) expressing was determined via the flow cytometry at an excitation wavelength of 488 nm.
For apoptosis assay, after 24 hours incubation in the 24-cell plate, the OCSCs were centrifuged at 1000 rpm for 5 min at 4 °C and resuspended with PBS at a concentration of 106 cells/mL. The OCSCs were stained with 5 μL Annexin V-APC for 15 min and 5 μL PI for 5 min (Annexin V-APC/PI Cell Apoptosis Assay Kit) at 4 °C. Then, OCSCs were analyzed using the flow cytometry. We analyzed the data with FlowJo™ software.
Sonoporation and resealing with scanning electron microscopy
To observe cell sonoporation and pore recover effects on cell membranes, the ultrasound combined with PSP@MB was employed to irradiate the OCSCs and A2780 cells. The ultrasonic parameters were 0.8 W/cm2, 20%, 1 min, and 1 MHz. After ultrasound exposure, the pore and resealing morphology of cell membranes were observed by SEM at varied time (0 min, 30 min, and 60 min), which were abbreviated to US + PSP@MB0, US + PSP@MB30, and US + PSP@MB60. There were six groups: (a) Control group, (b) PSP@MB group, (c) US0 group, (d) US + PSP@MB0 group, (e) US + PSP@MB30 group, and (f) US + PSP@MB60 group. For the SEM investigation, after ultrasonic exposure, the OCSCs and A2780 cells were fixed with 3% glutaraldehyde for 30 min, and centrifuged at 1000 rpm for 5 min. The harvested cells were dehydrated with different concentrations of ethanol (50, 70, 90, 95, and 100% for 20 min, respectively) and dried by a freeze dryer. The fixed and dehydrated cells were coated on a metal substrate, sprayed with gold and dried, and observed with SEM (HITACHI S-3700N, Tokyo, Japan) at an accelerating voltage of 20 kV at room temperature.
Investigation on sonoporation with calcein/propidium iodide
To observe sonoporation, we chose calcein/PI staining via CLSM. The live cells with sonoporation could be double stained with calcein/PI due to membrane pore. The OCSCs and A2780 cells were irradiated via the ultrasound and PSP@MB. The ultrasonic parameters were 0.8 W/cm2, 20%, 1 min, and 1 MHz. There were four groups: (A) Control group, (B) PSP@MB group, (C) US group, and (D) US + PSP@MB group. After ultrasound exposure, the 10 μM calcein and 15 μM PI were added to the OCSCs and A2780 cells, respectively. The sonoporation phenomenon was observed with CLSM.
Enhanced-endocytosis of pDNA by OCSCs via PSP@MB and ultrasound
OCSCs (1 × 10⁵ cells/well) were seeded on coverslip in 24-well plate, and then incubated with 10 μL PSP@MB and 30 μg CY5-labeled pDNA for 5 min at 37 °C. The OCSCs were exposed by ultrasound with parameters (0.8 W/cm2, 1 MHz, 20% duty cycle, and 1 min). There were four groups: Control group, PSP@MB group, US group, and US + PSP@MB group. After ultrasound exposure, the OCSCs were fixed with 4% paraformaldehyde for 30 min at varied time (10 min, 1 h, 4 h, and 24 h). The nucleus was stained with 1 mg/mL DAPI for 5 min and washed three times with PBS. The fluorescent images were observed with CLSM.
Enhanced-endocytosis of dextran by A2780 cells via varied acoustic intensity
To observe enhanced-endocytosis, the A2780 cells were seeded in 24-well plate, and then incubated with 10 μL PSP@MB and 155 kDa FITC-labeled dextran with final concentration of 5 mg/mL for 5 min at 37 °C. In each case, the A2780 cells were exposed with a frequency of 1 MHz and duty cycle of 20%. The varied ranges for acoustic intensity were 0.2–1 W/cm2. There were eight groups: (a) Control group, (b) PSP@MB group, (c) US group, (d) US + PSP@MB 0.2 W/cm2 group, (e) US + PSP@MB 0.4 W/cm2 group, (f) US + PSP@MB 0.6 W/cm2 group, (g) US + PSP@MB 0.8 W/cm2 group, and (h) US + PSP@MB 1.0 W/cm2 group. Ten minutes after ultrasound exposure, the A2780 cells were washed twice with PBS. The fluorescent images were observed with fluorescence microscope. The data were analyzed using ImageJ software (NIH, Bethesda, MD).
Endosomal escape of PSP@MB/pDNA
To observe endosomal escape, the OCSCs were seeded in the 35 mm cell culture plate (Thermo Scientific™ Nunc™ EasYDish™, Waltham, MA), and then incubated with 10 μL PSP@MB and 10 μg FITC-labeled pDNA for 1 min at 37 °C. The OCSCs were exposed by ultrasound with parameters (0.8 W/cm2, 20%, 1 min, and 1 MHz). There were four groups: (A) Control group, (B) PSP@MB group, (C) US group, and (D) US + PSP@MB group. After ultrasound exposure, the OCSCs were incubated with rhodamine-labeled Lyso Tracker with final concentration of 1:15,000 for 8 h at 37 °C. The nucleus was stained with 1 mg/mL DAPI for 5 min. The fluorescent images were observed with CLSM.
Cytoskeleton arrangement by ultrasound combined with PSP@MB
To observe the cytoskeletal depolymerization, the A2780 cells were seeded in the 35 mm cell culture plate, and then incubated with 10 μL PSP@MB for 1 min at 37 °C. The A2780 cells were exposed with parameters (0.8 W/cm2, 20%, 1 min, and 1 MHz). There were four groups: (A) Control group, (B) PSP@MB group, (C) US group, and (D) US + PSP@MB group. After ultrasound exposure, the A2780 cells were fixed with 4% paraformaldehyde for 5 min and permeabilized with 0.1% Triton-X100 for 5 min. Actin filaments were stained with FITC-labeled phalloidin (BBcellProbeTM C11-Phalloidin) for 1 h. The nucleus was stained with 1 mg/mL DAPI for 5 min. The fluorescent images were observed with CLSM.
Mitochondrial permeability transition pore (mPTP) opening by ultrasound combined with PSP@MB
To observe the mPTP opening, the OCSCs were seeded in the 35 mm cell culture plate, and then incubated with 10 μL PSP@MB for 1 min. The OCSCs were exposed by ultrasound with parameters (0.8 W/cm2, 20%, 1 min, and 1 MHz). There were four groups: (A) Control group, (B) PSP@MB group, (C) US group, and (D) US + PSP@MB group. The mPTP opening was assayed using the Image-iT LIVE Mitochondrial Transition Pore Assay Kit. After ultrasound exposure, the OCSCs were incubated with final concentration of 1.0 μM Calcein AM, 200 nM Mito Tracker Red CMXRos, and 1.0 mM CoCl2 for 15 min at 37 °C. Then, the OCSCs were washed three times with HBSS buffer. The nucleus was stained with 1 mg/mL DAPI for 5 min. The fluorescent images were observed with CLSM.
Statistical analysis
For statistical analyses of experiments, CLSM images were semi-quantitatively analyzed via ImageJ software (NIH, Bethesda, MD). Student’s t test or one-way analysis of variance (ANOVA) was used to analyze the comparisons. GraphPad Prism 6.0 (GraphPad Software, La Jolla, CA) was used to analyze statistics. Results were shown as means ± SEM. Significant differences were designated at *p < 0.05, **p < 0.01, and ***p < 0.001.
Results and discussion
Ultrasound mediated MB-assisted gene delivery is a promising tool for localized tumor therapy. Recently, ultrasound combined with nanoparticle-loaded MBs can effectively promote the gene delivery to target tissue via ultrasonic biophysical effects. Some studies (Underwood, Citation2015; Fan et al., Citation2017; Yang et al., Citation2019) have reported UTMD was conducive for opening the blood–brain barrier in the treatment of brain tumors and Parkinson's disease. In the present study, we have shown an efficient gene delivery system (ultrasound with PSP@MB) to enhance apoptosis of OCSCs in vitro (). The ultrasonic biophysical effects generated by ultrasound and PSP@MB could also explain the mechanisms of the efficient gene delivery system. Ultrasound combined with MBs exhibited that ultrasonic bioeffects (e.g. sonoporation, enhanced-endocytosis, and sonoprinting) promote gene transfection and induce tumor apoptosis. The spatiotemporally controlled delivery of plasmid encoded with ALDH1 shRNA are mediated with the ultrasound-triggered and GSH-responses of PSP@MB.
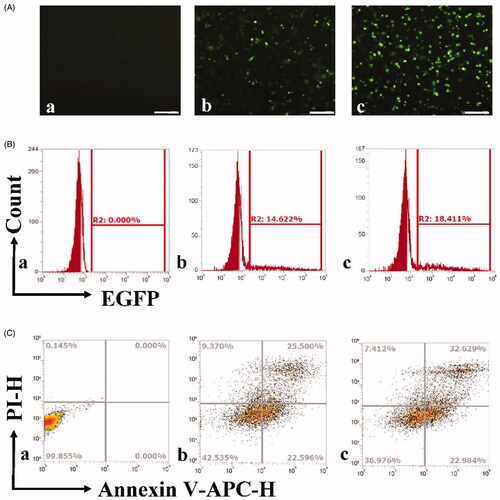
Figure 1. Gene transfection and apoptosis of OCSCs by ultrasound combined with PSP@MB delivery of ALDH1 shRNA. (A) Fluorescent images of OCSC exposed to plasmid-containing encoded ALDH1 shRNA of different reagents: (a) Control group, (b) Lipofectamine 2000 group, (c) US + PSP@MB group. The ultrasound parameters were (0.8 W/cm2, 1 MHz, 20% duty cycle, 30 s), (scale bar = 100 μm). (B) Transfection efficiency rate was evaluated by flow cytometry and represented as histograms. The transfection efficiency rate was 18.41% in the US + PSP@MB group, higher than Lipofectamine 2000 group (14.62%). (C) Apoptosis rate was evaluated by flow cytometry and represented as histograms. The apoptosis rate was 32.62% in the US + PSP@MB group, higher than Lipofectamine 2000 group (25.5%).
Synthesis and characteristics of PSP NPs and PSP + GSH
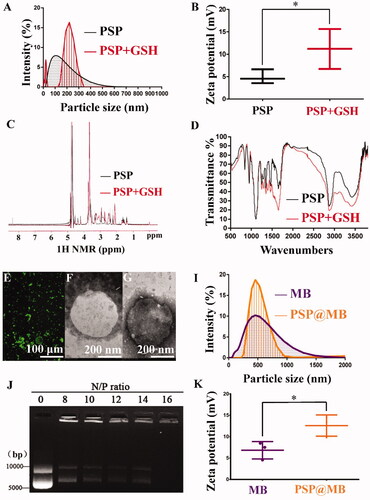
The diameters of the PSP were approximately 100 nm with the dynamic light scattering (DLS) measurement. To evaluate the reduction sensitivity of PSP NPs, after the incubation with 10 mM GSH for 2 h, the average diameters PSP NPs were 210 ± 101 nm (as shown in ). The zeta potential of PSP NPs was 4 ± 2.5 mV due to the PEGylation, and after GSH treatment the zeta potential of PSP NPs was 12 ± 4.3 mV due to the dePEGylation (as exhibited in ). The successful synthesis of PSP and dePEGylation of PSP with GSH treatment was confirmed by 1H NMR spectra of PSP in D2O. In the presence of GSH, the disulfide bond was cleaved, accompanying with the shift of chemical shift from 2.68–2.94 to 2.45 ppm (as presented in ). The successful synthesis of PSP and dePEGylation of PSP with GSH treatment was confirmed by infrared spectroscopy of PSP (as displayed in ).
Figure 2. Characteristics of the PSP, MB, and PSP@MB. (A) The average diameters of the PSP NPs were approximately 100 nm with the dynamic light scattering (DLS) measurement. To evaluate the reduction sensitivity of PSP NPs, after the incubation with 10 mM GSH for 2 h, the average diameters of the PSP NPs were 210 ± 101 nm. (B) The zeta potential of PSP NPs was 4 ± 2.5 mV due to the PEGylation, and after GSH treatment the zeta potential of PSP NPs was 12 ± 4.3 mV due to the dePEGylation (p < .05). (C) The successful dePEGylation of PSP with GSH treatment confirmed by 1H NMR spectra in D2O. In the presence of GSH, the disulfide bond was cleaved, accompanying with the shift of chemical shift from 2.68–2.94 to 2.45 ppm. (D) The successful dePEGylation of PSP with GSH treatment was verified by Fourier transform infrared (FT-IR). (E) FITC-streptavidin was conjugated with MB. Successful connection of PSP NPs loaded MBs was confirmed by fluorescence microscope. Transmission electron microscope (TEM) images of MB (F) and PSP@MB (G) showed the similar particle size with DLS. (I) The DLS measurement showed that the average diameters of the MBs and PSP@MB were approximately 495 ± 132 nm and 502 ± 75 nm, and (K) zeta potential were 7 ± 3.6 mV and 13 ± 4.4 mV (p < .05). (J) To confirm the pDNA binding ability of PSP NPs, we checked the retardation of pDNA mobility in agarose-gel electrophoresis. The pDNA condensation ability of PSP NPs was tested with various N/P ratios (0, 8, 10, 11, 12, 14, and 16). PSP showed beneficial complexation of pDNA. When the N/P ratio is 16, no free DNA could be observed on the gel, which indicated that the PSP can condense the pDNA entirely. However, the optimized concentration proportion between PSP@MB and pDNA is more important for gene transfection.
Preparation and characterization of MB and PSP@MB
PSP@MB was synthesized with biotin–PSP, biotin–MB, and biotin–avidin bridge. The fluorescence microscope was used to confirm the PSP loaded MB (as proved in ). The DLS measurement and TEM images displayed that the diameter size of the MB and PSP@MB was approximately 500 nm ()). The zeta potential of the PSP@MB was 13 ± 4.4 mV (). The DNA binding ability of PSP was confirmed via the gel retardation. When the N/P ratio is 16, the pDNA migration could not be observed in agarose-gel electrophoresis (as shown in ).
Formation and characterization of OCSCs spheres
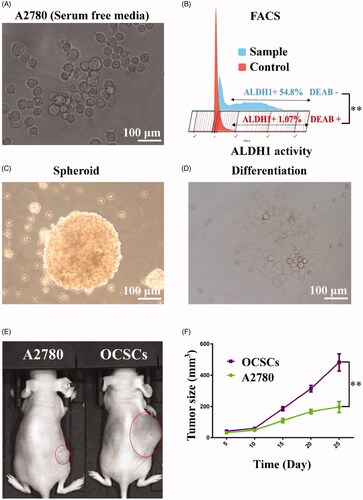
The microscope image of irregular spheroids was derived from the A2780 cells with serum free culture for three weeks (as shown in ). The spheroids were sorted with FACS analyses of ALDH activity with ALDEFLOUR staining in the presence or absence 5 μL of diethylaminobenzaldehyde (DEAB) reagent, which was the ALDH1 inhibitor. The ALDH1+ (54.8%) was sorted by flow cytometry and compared with Control groups (DEAB+) (as depicted in ). After sorting, the ALDH1+ OCSCs and ALDH1– A2780 cells were cultured with serum-free culture. One month later, ALDH1+ OCSC spheroids were full and globular (as presented in ). The ALDH1+ OCSC spheroids changed into monolayers with serum culture medium for 48 h (scale bar = 100 μm) (as displayed in ). Compared with ALDH1– A2780 cells, the ALDH1+ OCSC spheroids had higher tumorigenesis abilities in vivo (as exhibited in ).
Figure 3. OCSCs spheroids were obtained with ALDEFLUOR assay and FACS. (A) The microscope image of irregular spheroids derived with the A2780 cells with serum free culture for three weeks. (B) The spheroids were sorted with FACS analyses of ALDH activity with ALDEFLOUR staining in the presence or absence 5 μL of diethylaminobenzaldehyde (DEAB) reagent, which was the ALDH1 inhibitor. The ALDH1+ (54.8%) was sorted by flow cytometry compared with Control groups (1.07%) (p< .01). After sorting, the ALDH1+ OCSCs and ALDH1– A2780 cells were cultured with serum-free culture. (C) One month later, ALDH1+ OCSC spheroids were full and globular. (D) The ALDH1+ OCSC spheroids changed into monolayers with serum culture medium for 48 h (scale bar = 100 μm). (E, F) Compared with ALDH1– A2780 cells, the ALDH1+ OCSC spheroids had higher tumorigenesis abilities in vivo (p< .01).
Gene transfection and apoptosis of OCSCs by ultrasound combined with PSP@MB delivery of ALDH1 shRNA
The flow cytometry was used to quantitatively analyze the gene transfection rate and the apoptosis rate after delivery of ALDH1 shRNA plasmids to OCSCs. The fluorescent images of OCSC were exposed to different reagents: (a) Control group, (b) Lipofectamine 2000 group, and (c) US + PSP@MB group, after 24 h (scale bar = 100 μm) (as shown in ). Compared with Lipofectamine 2000 group (14.62%), the transfection rate was higher (18.41%) in the US + PSP@MB group (as displayed in ). We also evaluated the apoptosis rate by flow cytometry. The apoptosis rate was 32.62% in the US + PSP@MB group, higher than Lipofectamine 2000 group (25.5%) (as depicted in ).
Sonoporation and pore resealing via ultrasound and PSP@MB
OCSCs were sonicated with ultrasound combined with PSP@MB. The ultrasonic parameters were 0.8 W/cm2, 20%, 1 min, and 1 MHz. There were six groups: (a) Control group, (b) PSP@MB group, (c) US0 group, (d) US + PSP@MB0 group, (e) US + PSP@MB30 group, and (f) US + PSP@MB60 group. The time-varying pore morphology and resealing of the OCSCs membrane were determined by SEM. The numbers of pores were characterized as decreasing with a half-life close to 30 min and 60 min after sonoporation. Most OCSCs showed full recovery of their native membrane integrity (as shown in ). The A2780 cells model is as shown in Figure S2-A.
Figure 4. Spatiotemporal characteristics of sonoporation and resealing of OCSCs. (A) OCSCs were sonicated with ultrasound combined with PSP@MB. The ultrasonic parameters were 0.8 W/cm2, 20%, 1 min, 1 MHz. There were six groups: (a) Control group, (b) PSP@MB group, (c) US0 group, (d) US + PSP@MB0 group, (e) US + PSP@MB30 group, and (f) US + PSP@MB60 group. The time-varying pore morphology and resealing of the OCSCs membrane were determined by scanning electron microscopy (SEM). The numbers of pores were characterized as decreasing with a half-life close to 30 min and 60 min after sonoporation. Most OCSCs showed full recovery of their native membrane integrity. (B) Representative confocal microscopy images of Calcein (green) and PI (red) in OCSCs 30 min after sonication. (a) Control group, (b) PSP@MB group, (c) US group, (d) US + PSP@MB group, (e) enlarged figure from Control group, and (f) enlarged figure from US + PSP@MB group. The green arrow indicates live cells and the red arrow indicates dead cells. The yellow arrow exhibits that co-localization of Calcein and PI inside cells due to the sonoporation generated by ultrasound combined PSP@MB.
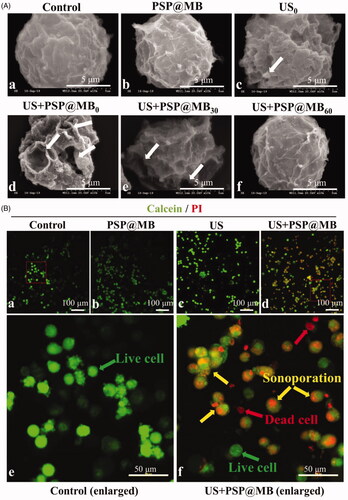
Representative confocal microscopy images of Calcein (green) and PI (red) in OCSCs 30 min after sonication. There were following groups: (a) Control group, (b) PSP@MB group, (c) US group, (d) US + PSP@MB group, (e) enlarged figure from Control group, and (f) enlarged figure from US + PSP@MB group. The green arrow indicates live cells and the red arrow indicates dead cells. The yellow arrow exhibits that co-localization of calcein and PI inside cells due to the sonoporation generated by ultrasound combined PSP@MB (as presented in ). The A2780 cells model is as shown in Figure S2-B.
Sonoporation is the most important ultrasonic biophysical effect. Some studies (Fan et al., Citation2010, Citation2012; Qiu et al., Citation2012; Delalande et al., Citation2015; Leow et al., Citation2015; Helfield et al., Citation2016; Abdalkader et al., Citation2017) have exhibited that sonoporation was generated as small temporal and recoverable pores on the cell membrane by cavitation. Different acoustic potentials of ultrasound triggered PSP@MB can generate different sizes of the sonoporation pores in OCSCs and OC A2780 cell membranes. In an optimized ultrasound exposure parameter, the recovery of sonoporation pores were scanned by SEM at 60 min after sonication, as shown in and Figure S2-A. Second, confocal microscopy has exhibited the co-localization images of calcein and PI inside OCSCs and A2780 cells to verify sonoporation ultrasonic bioeffect phenomena ( and .Figure S2-B). Sonoporation can boost the delivery of the therapeutic genes to the OCSCs as well as the tumor. However, the cell regulation potential is limited; the cell will die if the pores are too large compared to the cell regulation, hence optimizing the gene delivery system parameters (e.g. acoustic intensity, frequency, exposure time, duty cycle, PSP@MB concentration, cell counts) is vital to gene translation and RNAi therapy. Another study (De Cock et al., Citation2015) has shown that the stable cavitation generated by low acoustic intensity can enhance the endocytosis of large therapeutic molecules such as nanoparticles, drugs, and plasmids.
Enhanced endocytosis of gene/drug via ultrasound and PSP@MB
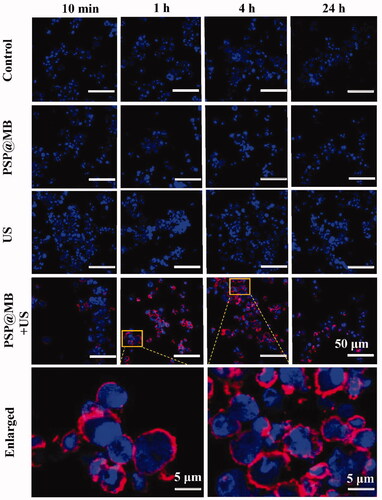
Ultrasound combined with PSP@MB promotes OCSCs endocytosis of CY5-labeled-pDNA. There were four groups: Control group (CY5-labeled DNA), PSP@MB group, US group, and US + PSP@MB group. US + PSP@MB group for 1 h and 4 h was enlarged. After ultrasound exposure, we chose four point-in-time (10 min, 1 h, 4 h, and 24 h) to observe the endocytosis of OCSCs. The CLSM results showed that more endocytosis CY5-labeled pDNA in the PSP@MB + US group compared with other groups. The time of higher intracellular pDNA was 1–4 h (as shown in ).
Figure 5. Enhancing endocytosis of gene by ultrasound and PSP@MB. Ultrasound combined with PSP@MB to promote OCSCs endocytosis of CY5-pDNA. There were four groups: Control group, PSP@MB group, US group, and US + PSP@MB group. US + PSP@MB group for 1 h and 4 h was enlarged. CLSM images of OCSCs transfected with PSP@MB combined ultrasound for 10 min, 1 h, 4 h, and 24 h. There were more CY5-pDNA (red) in OCSCs in the PSP@MB + US group compared to PSP@MB group or P(CY5-pDNA) group. It showed that PSP@MB + US could efficiently deliver pDNA to OCSCs with enhancing endocytosis. The time of higher intracellular pDNA was 1–4 h.
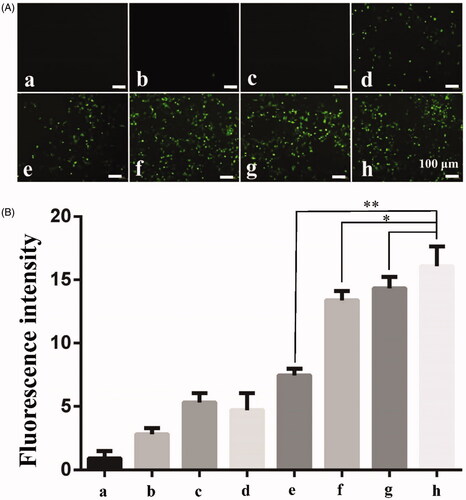
Ultrasound is combined with PSP@MB to promote endocytosis of 155 kDa FITC-dextran into A2780 cells. The experimental groups were: (a) Control group, (b) PSP@MB group, (c) US group, (d) US + PSP@MB 0.2 W/cm2 group, (e) US + PSP@MB 0.4 W/cm2 group, (f) US + PSP@MB 0.6 W/cm2 group, (g) US + PSP@MB 0.8 W/cm2 group, and (h) US + PSP@MB 1.0 W/cm2 group. The result showed that fluorescence intensity increased following the acoustic intensity increased (as displayed in ). Fluorescence intensity was represented as histograms (as displayed in ). The relative fluorescence intensity was (16.87 ± 2.73) in the (h) group, higher than (e) group (7.53 ± 1.42) and (f) group (13.22 ± 1.85). Compared with the relative fluorescence intensity between (h) group and (g) group (14.82 ± 2.14), the difference was not statistically significant.
Figure 6. Ultrasound combined with PSP@MB to promote endocytosis of 155 kDa FITC-dextran into A2780 cells. (A) Fluorescent images of 155 kDa FITC-dextran into A2780 exposed via ultrasound and PSP@MB. The experimental groups were: (a) Control group, (b) PSP@MB group, (c) US group, (d) US + PSP@MB 0.2 W/cm2 group, (e) US + PSP@MB 0.4 W/cm2 group, (f) US + PSP@MB 0.6 W/cm2 group, (g) US + PSP@MB 0.8 W/cm2 group, and (h) US + PSP@MB 1.0 W/cm2 group. The ultrasonic parameters were (1 MHz, 20% duty cycle, 1 min). (B) Fluorescence intensity was represented as histograms. Fluorescence intensity increased following the acoustic intensity increase. The relative fluorescence intensity was (16.87 ± 2.73) in the (h) group, higher than (e) group (7.53 ± 1.42) and (f) group (13.22 ± 1.85). Compared with the relative fluorescence intensity between (h) group and (g) group (14.82 ± 2.14), the difference was not statistically significant. *p < .05, **p < .01.
Enhanced-endocytosis is another important ultrasonic biophysical effect generated by ultrasound and PSP@MB. Some studies (Ferreira & Boucrot, Citation2018; Kaksonen & Roux, Citation2018; Mettlen et al., Citation2018; Patel et al., Citation2019) have researched the relation between the enhanced-endocytosis and the parameters of ultrasound. Meijering et al. (Citation2009) reported that UMTD triggered endocytosis and evoked endocytosis to promote cells uptake of the macromolecule. The experiment exhibited that 4 kDa dextran was small enough to pass the sonoporation pores and the nuclear pore, but the DNA often exceeded 500 kDa and was trapped in endosomes. The endocytosis was the key biophysical mechanism generated by UTMD to promote the macromolecule into the cells. Some studies (De Cock et al., Citation2015) have shown the collection between acoustic pressure and the route of drug uptake. Low acoustic pressure leads to uptake by mainly boosting endocytosis and high acoustic pressures enhanced uptake via sonoporation. Membrane deformation is linked to upregulated endocytosis. In this study, we have showed that the optimized time of enhanced-endocytosis was 1 h after sonication via CLSM (). Compared with the low acoustic intensity (0.4 W/cm2), high acoustic intensity (1 W/cm2) ultrasound combined with PSP@MB enhanced more endocytosis to OCSCs (). The biophysical effect of enhanced-endocytosis is related to microstreaming, which is the fluid flow generated by the rapid expansion and contraction of an MB under insonation. Microstreaming does not just break the integral biolipid cell membrane, but also the disaggregates the cytoskeleton and the interendothelial junction opening due to the oscillation and cavitation generated by ultrasound combined PSP@MB (). In addition, the minus positive zeta potential of PSP nanoparticle will be helpful to promote endocytosis by electrostatic interaction with negative zeta potential cell membranes. Sonoprinting generated by ultrasonic acoustic radiation has been proven by many studies (Lentacker et al., Citation2014; De Cock et al., Citation2016).
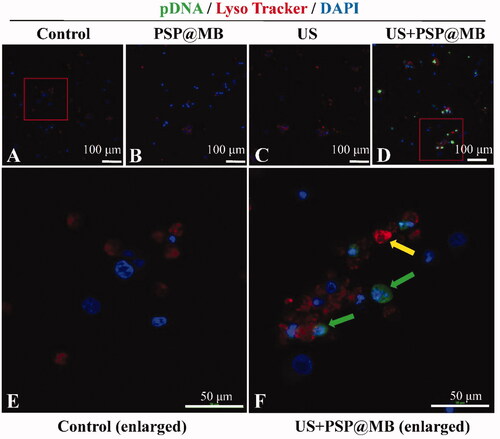
Figure 7. Gene intracellular delivery and endosomal escape effect of ultrasound combined with PSP@MB. Representative confocal microscopy images of FITC-labeled pDNA (green) and Lyso Tracker labeled lysosomes (red) in OCSCs 8 h after sonication. (A) Control group, (B) PSP group, (C) PSP@MB group, (D) US + PSP@MB group, (E) enlarged figure from Control group, and (F) enlarged figure from US + PSP@MB group. The yellow arrow indicates co-localization of pDNA and lysosomes. The green arrow showed that ultrasound combined PSP@MB promoted pDNA endosomal escape.
Sonoprinting is the key mechanism to understand the ultrasonic bioeffects of ultrasound triggered nanoparticle-loaded MBs (De Cock et al., Citation2016; Roovers et al., Citation2019a,Citationb). When PSP@MB is exposed in the ultrasonic field, PSP@MB not only has cavitation, but also acoustic radiation. Acoustic radiation can be divided into primary acoustic radiation and secondary acoustic radiation. Sonoprinting is another strong piece of evidence to explain the mechanism of ultrasonic-triggered PSP@MB mediated gene delivery of OCSCs in vitro and in vivo. A good gene delivery system also includes stable blood circulation translation, gene protection, and controllable gene release, hence PSP@MB as a gene delivery carrier was prepared and characterized ().
Endosomal escape of PSP@MB/pDNA
The fluorescence images of FITC-labeled pDNA and Lyso Tracker labeled lysosomes of OCSCs were taken at 8 h after sonication with CLSM. There were four groups: (A) Control group, (B) PSP group, (C) PSP@MB group, (D) US + PSP@MB group, (E) enlarged figure from Control group, and (F) enlarged figure from US + PSP@MB group. The yellow arrow indicates co-localization of pDNA and lysosomes. The green arrow showed that ultrasound combined PSP@MB promoted pDNA endosomal escape (as shown in ). Some studies (Degors et al., Citation2019; Kargaard et al., Citation2019) have showed that the endocytosis and endosomal escape were the key mechanisms for nanomedicine to deliver gene for tumor therapy. Other studies (Lei et al., Citation2013; Guan et al., Citation2017; Zhang et al., Citation2018; Liufu et al., Citation2019) have exhibited that modified PEI was the fantastic gene vector due to its special endosomal escape.
Cytoskeletal changes by ultrasound combined with PSP@MB
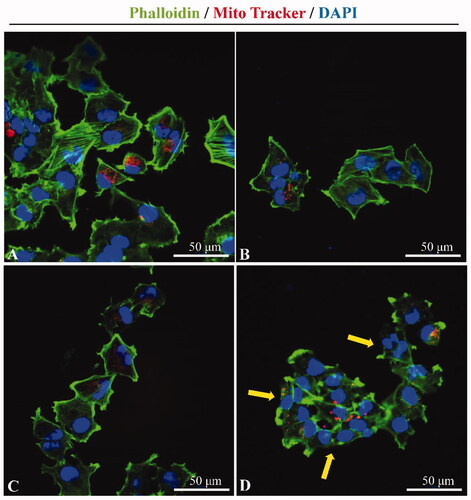
Representative confocal microscopy images of Phalloidin labeled F-actin and Mito Tracker labeled mitochondria in A2780 cells after ultrasound exposure. There were following groups: (A) Control group, (B) PSP@MB group, (C) US group, and (D) US + PSP@MB group. The yellow arrow showed that the cytoskeletal disaggregation and the interendothelial junction opening was due to the cavitation generated by ultrasound combined with PSP@MB (as displayed in ). Some studies (De Cock et al., Citation2015; Qin et al., Citation2018) have shown that ultrasound and MBs could promote gene/drug delivery into cells. The biophysical mechanisms were involved with sonoporation, endocytosis, interendothelial junction opening, and sonoprinting. The cytoskeletal disaggregation was in favor of endocytosis and interendothelial junction opening due to the ultrasonic mechanical stimulation.
Figure 8. Cytoskeletal changes by ultrasound combined with PSP@MB. Representative confocal microscopy images of Phalloidin (green) labeled F-actin and Mito Tracker (red) labeled mitochondria in A2780 cells after ultrasound exposure. (A) Control group, (B) PSP@MB group, (C) US group, and (D) US + PSP@MB group. The yellow arrow showed that the cytoskeletal disaggregation and the interendothelial junction opening were due to the cavitation generated by ultrasound combined with PSP@MB.
The mPTP opening via ultrasound combined with PSP@MB
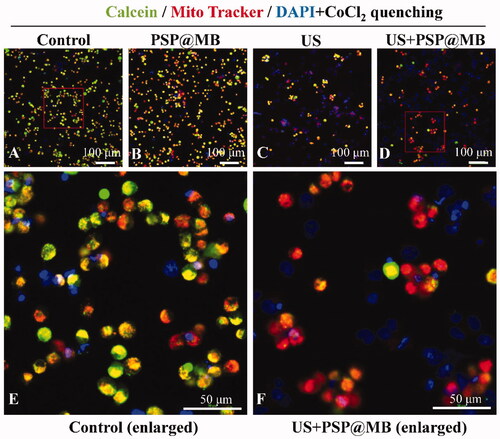
Representative confocal microscopy images of Mito Tracker Red CMXRos and Calcein in the OCSCs after ultrasound exposure. There were following groups: (A) Control group, (B) PSP@MB group, (C) US group, (D) US + PSP@MB group, (E) Control group (enlarged), and (F) US + PSP@MB group (enlarged). The cytosolic calcein fluorescence was quenched by adding CoCl2. When there is mPTP opening, the CoCl2 could enter the mitochondria and therefore also quench the mitochondrial calcein fluorescence in the US + PSP@MB group (as shown in ).
Figure 9. The mPTP opening via ultrasound combined with PSP@MB. (A) Control group, (B) PSP@MB group, (C) US group, (D) US + PSP@MB group, (E) Control group (enlarged), and (F) US + PSP@MB group (enlarged). The OCSCs were stained with Mito Tracker Red CMXRos and Calcein. The cytosolic calcein fluorescence was quenched by adding CoCl2. When there is mPTP opening, the CoCl2 could enter the mitochondria and therefore also quench the mitochondrial calcein fluorescence in the US + PSP@MB group.
Gene delivery carriers with integrated design are vital to solid tumor focused gene delivery, due to the fact the physiological barriers (reticuloendothelial phagocytosis, nuclease degradation, interendothelial junctions) in vivo and the microenvironment of tumors (high interstitial pressure, hypoxia, acid, and high reducing) exist. To achieve an efficient gene transfection, the PSP@MB combined with ultrasound promotes to break through the physiological barriers. The controlled gene delivery system using functionalized ultrasound-triggered and GSH-sensitive PSP@MB facilitates gene delivery. PSP@MB as an integrated gene delivery carrier was prepared and characterized successfully. From our previous study, we proved that ultrasound combined with MB and 25 kDa PEI could promote gene transfection in vitro, but the cytotoxicity of 25 kDa PEI had limited its use in vivo (Chen et al., Citation2010). Herein, we derived the concept of PSP@MB (Liufu et al., Citation2019). PSP@MB combines with the advantages that are high transfection of 25 kDa PEI, long circulation time of PEGylation, and GSH-responsive disulfide bond. In addition, PSP@MB as a theranostic gene delivery carrier is successfully triggered by ultrasound. The lipid MB is excellent for contrast-enhanced ultrasonography and triggers biophysical mechanism with ultrasound, while the GSH-sensitive PSP nanoparticles serve as a high loading and releasing gene vector. PEG is a good shield of PEI for prolonged circulation time and improving tumor accumulation. The disulfide bond cleavage of PSP by GSH would enhance ALDH1 shRNA plasmid to release into the cytoplasm. In this study, we have confirmed that the GSH-sensitive disulfide bond cleavable properties of PSP by 1H NMR spectra and infrared spectroscopy (as shown in ). Then, PEGylation shielding would rapidly disappear and release PEI/DNA. The PEI would generate endosome escape to promote gene delivery via proton sponge effect (as shown in ).
UTMD combined with RNAi technology promotes apoptosis of OCSCs. The gene transfection and apoptosis rates of the ALDH1 shRNA plasmids were quantified with the flow cytometry. Compared with Control group, the gene transfection rates and apoptosis rates of the ultrasound combined with PSP@MB group were 18 and 32 times higher in vitro, respectively (). Some studies (Bonora & Pinton, Citation2014) reported that mitochondria played a vital role in the processes of apoptotic cell death. The mPTP is a nonspecific channel formed by components from the inner and outer mitochondrial membranes, and appears to be involved in the release of mitochondrial components during cell apoptosis. We verified the mPTP opening of OCSCs via ultrasound combined PSP@MB with CLSM (). Some studies (Zhou et al., Citation2017) have shown that the mPTP opening was involved with activation of mitochondrial-dependent apoptosis pathways. Some studies (Whelan et al., Citation2012; Zhou et al., Citation2017) exhibited that the triggering event in primary apoptosis was early opening of the inner membrane mPTP. There would be synergistic effect via ultrasound combined PSP@MB delivering ALDH1 shRNA to promote apoptosis of OCSCs via the mPTP opening.
Conclusions
In this study, we focused on the most challenging components of OC (OCSCs and high reductive microenvironment). First, ultrasonic biophysical effects (e.g. sonoporation, enhanced-endocytosis, and opening interendothelial junctions) have proven to be an efficient gene delivery system. Second, a two-in-one carrier PSP@MB was constructed and designed for high reductive microenvironment of tumor. Third, ultrasonic biophysical effects combined with PSP@MB to deliver ALDH1 shRNA could promote apoptosis of OCSCs. In conclusion, this study showed that ultrasound triggering and GSH responsive PSP@MB might provide a novel strategy for OCSCs treatment via sonoporation and enhanced-endocytosis.
Supplemental Material
Download ()Disclosure statement
No potential conflict of interest was reported by the author(s).
Additional information
Funding
References
- Abdalkader R, Kawakami S, Unga J, et al. (2017). The development of mechanically formed stable nanobubbles intended for sonoporation-mediated gene transfection. Drug Deliv 24:320–7.
- Bonora M, Pinton P. (2014). The mitochondrial permeability transition pore and cancer: molecular mechanisms involved in cell death. Front Oncol 4:302.
- Bray F, Ferlay J, Soerjomataram I, et al. (2018). Global cancer statistics 2018: GLOBOCAN estimates of incidence and mortality worldwide for 36 cancers in 185 countries. CA Cancer J Clin 68:394–424.
- Chen Y, Du M, Yu J, et al. (2020). Nanobiohybrids: a synergistic integration of bacteria and nanomaterials in cancer therapy. BIO Integration 1:25–36.
- Chen Z-Y, Liang K, Qiu R-X. (2010). Targeted gene delivery in tumor xenografts by the combination of ultrasound-targeted microbubble destruction and polyethylenimine to inhibit survivin gene expression and induce apoptosis. J Exp Clin Cancer Res 29:152.
- De Cock I, Zagato E, Braeckmans K, et al. (2015). Ultrasound and microbubble mediated drug delivery: acoustic pressure as determinant for uptake via membrane pores or endocytosis. J Control Release 197:20–8.
- De Cock I, Lajoinie G, Versluis M, et al. (2016). Sonoprinting and the importance of microbubble loading for the ultrasound mediated cellular delivery of nanoparticles. Biomaterials 83:294–307.
- Degors IMS, Wang C, Rehman ZU, Zuhorn IS. (2019). Carriers break barriers in drug delivery: endocytosis and endosomal escape of gene delivery vectors. Acc Chem Res 52:1750–60.
- Delalande A, Leduc C, Midoux P, et al. (2015). Efficient gene delivery by sonoporation is associated with microbubble entry into cells and the clathrin-dependent endocytosis pathway. Ultrasound Med Biol 41:1913–26.
- Fan C-H, Lin C-Y, Liu H-L, Yeh C-K. (2017). Ultrasound targeted CNS gene delivery for Parkinson's disease treatment. J Control Release 261:246–62.
- Fan Z, Liu H, Mayer M, Deng CX. (2012). Spatiotemporally controlled single cell sonoporation. Proc Natl Acad Sci USA 109:16486–91.
- Fan Z, Kumon RE, Park J, Deng CX. (2010). Intracellular delivery and calcium transients generated in sonoporation facilitated by microbubbles. J Control Release 142:31–9.
- Ferreira APA, Boucrot E. (2018). Mechanisms of carrier formation during clathrin-independent endocytosis. Trends Cell Biol 28:188–200.
- Foldvari M, Chen DW, Nafissi N, et al. (2016). Non-viral gene therapy: gains and challenges of non-invasive administration methods. J Control Release 240:165–90.
- Guan X, Guo Z, Wang T, et al. (2017). A pH-responsive detachable PEG shielding strategy for gene delivery system in cancer therapy. Biomacromolecules 18:1342–49.
- Helfield B, Chen X, Watkins SC, Villanueva FS. (2016). Biophysical insight into mechanisms of sonoporation. Proc Natl Acad Sci USA 113:9983–8.
- Kaksonen M, Roux A. (2018). Mechanisms of clathrin-mediated endocytosis. Nat Rev Mol Cell Biol 19:313–26.
- Kargaard A, Sluijter JPG, Klumperman B. (2019). Polymeric siRNA gene delivery – transfection efficiency versus cytotoxicity. J Control Release 316:263–91.
- Lei Y, Wang J, Xie C, et al. (2013). Glutathione-sensitive RGD-poly(ethylene glycol)-SS-polyethylenimine for intracranial glioblastoma targeted gene delivery. J Gene Med 15:291–305.
- Lentacker I, De Cock I, Deckers R, et al. (2014). Understanding ultrasound induced sonoporation: definitions and underlying mechanisms. Adv Drug Deliv Rev 72:49–64.
- Leow RS, Wan JMF, Yu ACH. (2015). Membrane blebbing as a recovery manoeuvre in site-specific sonoporation mediated by targeted microbubbles. J R Soc Interface 12:20150029.
- Lheureux S, Gourley C, Vergote I, Oza AM. (2019). Epithelial ovarian cancer. Lancet (London, England) 393:1240–53.
- Li J, Condello S, Thomes-Pepin J, et al. (2017). Lipid desaturation is a metabolic marker and therapeutic target of ovarian cancer stem cells. Cell Stem Cell 20:303–14.e305.
- Liu Y, Xu C-F, Iqbal S, et al. (2017). Responsive nanocarriers as an emerging platform for cascaded delivery of nucleic acids to cancer. Adv Drug Deliv Rev 115:98–114.
- Liufu C, Li Y, Tu J, et al. (2019). Echogenic PEGylated PEI-loaded microbubble as efficient gene delivery system. Int J Nanomedicine 14:8923–41.
- Luo X, Peng X, Hou J, et al. (2017). Folic acid-functionalized polyethylenimine superparamagnetic iron oxide nanoparticles as theranostic agents for magnetic resonance imaging and PD-L1 siRNA delivery for gastric cancer. Int J Nanomedicine 12:5331–43.
- Meijering BDM, Juffermans LJM, van Wamel A, et al. (2009). Ultrasound and microbubble-targeted delivery of macromolecules is regulated by induction of endocytosis and pore formation. Circ Res 104:679–87.
- Mettlen M, Chen P-H, Srinivasan S, et al. (2018). Regulation of clathrin-mediated endocytosis. Annu Rev Biochem 87:871–96.
- Patel S, Kim J, Herrera M, et al. (2019). Brief update on endocytosis of nanomedicines. Adv Drug Deliv Rev 144:90–111.
- Patnaik S, Gupta KC. (2013). Novel polyethylenimine-derived nanoparticles for in vivo gene delivery. Expert Opin Drug Deliv 10:215–28.
- Qin P, Han T, Yu ACH, Xu L. (2018). Mechanistic understanding the bioeffects of ultrasound-driven microbubbles to enhance macromolecule delivery. J Control Release 272:169–81.
- Qiu Y, Zhang C, Tu J, Zhang D. (2012). Microbubble-induced sonoporation involved in ultrasound-mediated DNA transfection in vitro at low acoustic pressures. J Biomech 45:1339–45.
- Reid BM, Permuth JB, Sellers TA. (2017). Epidemiology of ovarian cancer: a review. Cancer Biol Med 14:9–32.
- Riley MK, Vermerris W. (2017). Recent advances in nanomaterials for gene delivery—a review. Nanomaterials (Basel, Switzerland) 7:94.
- Roovers S, Lajoinie G, De Cock I, et al. (2019b). Sonoprinting of nanoparticle-loaded microbubbles: unraveling the multi-timescale mechanism. Biomaterials 217:119250.
- Roovers S, Deprez J, Priwitaningrum D, et al. (2019a). Sonoprinting liposomes on tumor spheroids by microbubbles and ultrasound. J Control Release 316:79–92.
- Seo EJ, Kwon YW, Jang IH, et al. (2016). Autotaxin regulates maintenance of ovarian cancer stem cells through lysophosphatidic acid-mediated autocrine mechanism. Stem Cells 34:551–64.
- Silva IA, Bai S, McLean K, et al. (2011). Aldehyde dehydrogenase in combination with CD133 defines angiogenic ovarian cancer stem cells that portend poor patient survival. Cancer Res 71:3991–4001.
- Sotiropoulou PA, Christodoulou MS, Silvani A, et al. (2014). Chemical approaches to targeting drug resistance in cancer stem cells. Drug Discov Today 19:1547–62.
- Underwood E. (2015). Neuroscience. Can sound open the brain for therapies? Science 347:1186–7.
- Wang S, Wang Z, Yu G, et al. (2019a). Tumor-specific drug release and reactive oxygen species generation for cancer chemo/chemodynamic combination therapy. Adv Sci (Weinh) 6:1801986.
- Wang S, Zhou Z, Wang Z, et al. (2019b). Gadolinium metallofullerene-based activatable contrast agent for tumor signal amplification and monitoring of drug release. Small 15:e1900691.
- Whelan RS, Konstantinidis K, Wei A-C, et al. (2012). Bax regulates primary necrosis through mitochondrial dynamics. Proc Natl Acad Sci USA 109:6566–71.
- Yang C, Du M, Yan F, Chen Z. (2019). Focused ultrasound improves NK-92MI cells infiltration into tumors. Front Pharmacol 10:326.
- Zhang H, Chen Z, Du M, et al. (2018). Enhanced gene transfection efficiency by low-dose 25 kDa polyethylenimine by the assistance of 1.8 kDa polyethylenimine. Drug Deliv 25:1740–5.
- Zhou H, Hu S, Jin Q, et al. (2017). Mff-dependent mitochondrial fission contributes to the pathogenesis of cardiac microvasculature ischemia/reperfusion injury via induction of mROS-mediated cardiolipin oxidation and HK2/VDAC1 disassociation-involved mPTP opening. J Am Heart Assoc 6:e005328.
- Zong X, Nephew KP. (2019). Ovarian cancer stem cells: role in metastasis and opportunity for therapeutic targeting. Cancers 11:934.