
Abstract
This first analysis of aggregated data from the Kahoot! game-based player response system demonstrates that it can provide assessments of overall US student polar knowledge and identifies differences in polar knowledge across several states. A kahoot online quiz on polar topics recorded over 25,000 United States teacher-hosted classroom players (mostly middle-high school students) run by 1,167 unique teacher hosts within nine months (09/2018 through 06/2019). This high volume of teacher-initiated kahoots shows that many US teachers are motivated to include polar content in their teaching. We selected a subset of questions for analysis to compare with external data from a 2016 survey assessing polar knowledge of the US adult public. On three directly comparable questions kahoot student accuracy averaged just 30%, well below the 49% average accuracy observed on the nationwide survey of adults. Our geographic analysis focused on 13 states that had greater than 100 players for all questions analyzed. Among these, students in Rhode Island, Oregon, Arizona, and Washington exhibit the highest scores overall, while responses from Ohio and Illinois students appeared no better than guessing. Although widespread US teacher interest in polar content is indicated by the many who chose to use the polar kahoot in their classroom, students’ polar knowledge proves to be very low. These findings reinforce a need to include more polar and Earth system content in curricula, as well as to crowdsource benchmarked suites of knowledge questions appropriate for assessment of educational interventions.
Keywords:
Purpose and learning goals
General public surveys in the US have indicated a low level of polar knowledge (Hamilton, Citation2012, Citation2015, Citation2016; Hamilton et al., Citation2012, Citation2017). These surveys only include adults because it is challenging to survey large numbers of students under the age of 18 due to institutional review board requirements. Therefore, we do not have an assessment of polar knowledge within the US student population.
In September 2018, we launched a polar quiz (see , , https://tinyurl.com/PolarClimateKahoot) on a popular internet and app-based platform, Kahoot!. Originally designed for education and engagement, our goal with this paper is to use the extensive and spatially distributed data from player responses to the quiz to gain preliminary insights about the aggregated polar knowledge of US students. Note that "Kahoot!" refers to the digital resource platform while "kahoot" is synonymous with a quiz game within the resource.
Figure 1. Screenshot of the first 4 questions in the polar kahoot of the Climate Challenge (Turrin et al., Citation2019). Each question has an accompanying image. Sometimes the image provides information relevant to answering the question. See notes in and complete suite of questions, answers and images in the Supplemental Materials.
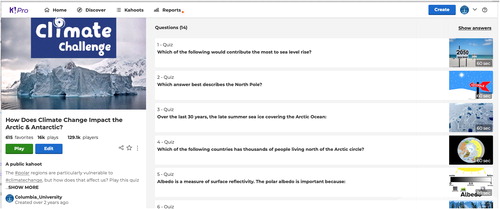
Table 1. Polar kahoot questions and answers for US teacher-hosted player responses.
In this paper we address: (a) validation of the use of Kahoot! data for aggregated knowledge assessment, in general; (b) evaluation of a 13-question benchmark of US student polar knowledge; and (c) analysis of aggregated US student responses compared with adult knowledge from other surveys (), as well as exploration of potential regional differences in polar knowledge.
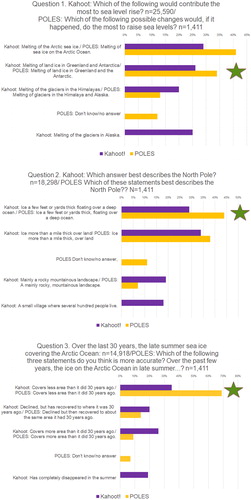
Figure 2. Comparison of US teacher-hosted student answers with POLES US general public answers (survey and questions described in Hamilton et al., Citation2017; Hamilton, Citation2018), for polar kahoot questions 1–3 sorted by frequency of correct adult responses. Stars indicate correct choices. Less differentiation between the answers, as well as a lower level of correct answers, indicates more guessing by students in a US teacher-hosted kahoot than adults in the US general public survey.
Literature context
The polar regions were literally “off the map” when many of us went to school because projections flattened the globe distorting the shape and size of the polar regions, pushing them to the very edges of the map. Even today polar stereographic map projections are rarely introduced in K12 instruction, and yet the polar regions are now front and center in many critical issues facing the world. From melting Arctic ice as the harbinger of changes caused by global warming to the polar vortex bringing cold snaps as well as snow days (Francis & Vavrus, Citation2012), understanding these warming and therefore increasingly ice-free and accessible regions provides context for understanding local and global environmental, social, and economic concerns (e.g., Newton et al., Citation2016; Shabudin et al., Citation2016). As Xavier et al. (Citation2016) state “It has become clear that the polar regions provide a litmus test and the insight to help society as a whole recognize the planetary limits of our behavior” (p. 44). As indicated by this quote, understanding polar change is important to connect our actions with global impacts.
The IPCC Report 2007 (Chapter 15) identified the polar regions as barometers of the health of our planet, critical in their locations connecting Earth’s processes globally (Anisimov et al., Citation2007). Recognizing this importance, during the International Polar Year of 2007–2009, the international scientific and education community mounted a major effort to raise polar literacy. The National Research Council noted in the International Polar Year legacy report that a US priority objective was outreach and communication of science results to the public (National Research Council, Citation2012). Each project had to include outreach and education activities as a condition of endorsement. A key conclusion from Provencher et al.’s (Citation2011) analysis of how the International Polar Year contributed to the future of education, outreach, and communication was that “formative evaluation needs to become integrated into science outreach programmes” (p. 4). Xavier et al. (Citation2016) further recommended embedding robust technology-enhanced evaluation within polar education practices. This raises the questions of what are polar educational goals? What are anticipated knowledge baselines in different contexts? In response, McDonnell et al. (Citation2020) identified a suite of Polar Literacy Principles.
More broadly, the geoscience education and research community has developed a series of frameworks including Earth Science, Atmospheric, Climate, Ocean, and Energy Literacy that were designed to assist educators in implementing the National Science Education Standards. However, we currently do not have nationally benchmarked assessment tools to accompany these community-based literacy efforts. The National Assessment of Educational Progress (NAEP), developed in 1969, is currently the only US-based nationwide continual assessment of student knowledge (U.S. Department of Education, Citation2001). While this assessment is useful to understand trends in selected topic areas, it cannot be tailored by teachers or researchers to incorporate other topics.
To address the need for flexible and adaptable, community-based knowledge assessments, Grinias (Citation2017) recommended developing question banks using the Kahoot! platform. Nearly 50% of all US teachers use Kahoot! and more than 50% of US students play at least one kahoot game per month within the academic calendar year (Kahoot!, Citation2018). The 2018 EdTech Top 40 Products report examined real-time usage data across hundreds of US schools, districts, and higher education institutions from July 2017 through June 2018 (EdTech, 2018). This analysis found that Kahoot! was unique as the leading digital tool used for assessment purposes. The fact that kahoots are widely used in United States middle and high schools as assessment tools, indicates that teachers have confidence in their value for knowledge assessment. However, aggregated kahoot data have not been used before for general knowledge assessment. While other studies have assessed the Kahoot! user experience, this represents the first exploratory analysis of content information obtained through the Kahoot! game-based player response system as a foundation for development of community-based assessment tools for polar as well as other content areas.
Setting and study population
Because a kahoot is not a traditional analytical resource, we set the context for our exploration of a polar kahoot dataset through a description of the platform. The Kahoot! platform facilitates free use and development of quiz games, primarily by US middle and high school teachers and their students. Teachers can both create their own quizzes as well as access the more than 30 million public quiz games available on the Kahoot! website and Kahoot! mobile app.
Organizations can also sponsor topical campaigns where they work with Kahoot! to develop suites of quizzes that are then featured on the Kahoot! website and within the Kahoot! mobile app. For example, National Geographic (Citation2019) and the American Museum of Natural History (Citation2019) have sponsored multiple campaigns, reaching millions of participating players across the globe. This study reports on results from one quiz with polar content that was embedded in a Climate Challenges campaign developed and sponsored by Columbia University and the National Oceanographic and Atmospheric Administration (Turrin et al., Citation2019, Citation2020; https://tinyurl.com/ClimateChallengeKahoot).
There are five types of Kahoot! users who use quizzes for various reasons on both the platform and the app: (a) teachers (mostly elementary, middle, and high school, but does include some higher education), for education; (b) students (age 13 and above), for education; (c) young students (under the age of 13 in the US), for education; (d) social, for parties or gatherings; and (e) business, for training. Note that Kahoot! website includes this language: “If you are under the age of 13 (for U.S. users) or 16 (for non-U.S. users), we have special safeguards we’ll place on your account until you come of age.” The safeguards are protections on their privacy and different countries designate protections at different ages.
In the sample analyzed here, for Question 1 of the polar quiz, we had 25,880 US players, mostly middle and high school students, participating in live games hosted by teachers from the platform (referred to subsequently as teacher-hosted players); 15,512 US students on the app; and 803 US young students on the app. We focus on data obtained from US teacher-hosted games from the platform. We chose to use the teacher-hosted sessions for several reasons: (a) the vast majority of kahoots are launched in classrooms by teachers so there was the most data; (b) teacher-hosted kahoots are played in the controlled setting of a classroom with connections to curriculum, while kahoots launched by students and young students can be launched and played for homework or as fun, single-player learning games; (c) kahoot games launched in a teacher-led experience are often handled as a pre-post- or interim- educational assessment (EdTech, 2018); and (d) this focused setting makes the insights gathered more relevant for other educators.
The kahoot polar quiz was not originally designed to assess knowledge, so the data represent a convenience sample. It was nonrandomized because the use of Kahoot! in the classroom setting is optional, meaning that all teacher-hosted players are led by teachers who actively decide to incorporate them in their teaching. The teachers who integrated the polar kahoot in their teaching chose it knowing that it was on a polar topic. Therefore, they were a biased sample because they were interested in polar content. Although our sample is not random, and its representativeness unknown, the size of this data resource (with thousands of responses) provides a unique opportunity for educators to better understand student knowledge, and to provide a benchmark for assessment of future educational interventions.
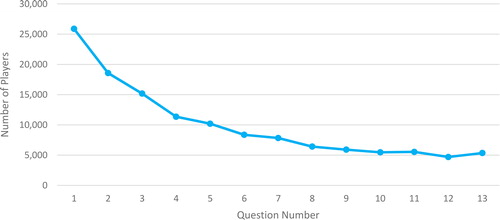
There was substantial player attrition within the polar quiz (see and ). The decrease in number of respondents from Question 1 to Question 8 was 75%. Of the nine quizzes within the overall Climate Challenge, the polar quiz had the second highest drop-off rate.
Figure 3. Number of US teacher-hosted players vs. question order shows a steep decline in the number of players from Question 1: 25,880 to Question 13: 4,694. Questions 1–5, 7–8 were analyzed in this study.
Materials and implementation
The Climate Challenge campaign (Turrin et al., Citation2019) consisted of nine quizzes plus a survey based on the Yale survey of US opinions on climate change (Howe et al., Citation2015). One of the quizzes in the campaign focused on polar topics. While all of the questions in the polar quiz were related to climate because that was the focus of the Climate Challenge campaign, they also addressed many of the subsequently released Polar Literacy Principles (McDonnell et al., Citation2020). Polar kahoot questions ranged from causes of sea level rise to sea ice loss and Arctic geography (see ).
Question design and development
The polar kahoot had thirteen questions (see and Supplementary Materials). Kahoot questions are always accompanied by an image, short film, diagram, or graph that sometimes include information that helps to answer the question (see , annotations, and Supplemental Materials). Polar kahoot Questions 1–3 were adapted from the Polar, Environment, and Science (POLES) survey, a 2016 nationwide telephone survey that assessed polar knowledge among a representative sample of more than 1,400 US adults (Hamilton, Citation2016, Citation2018; Hamilton et al., Citation2017). The wording of the telephone survey questions required changes to fit requirements of the Kahoot! platform (for the original POLES survey wording see Hamilton, Citation2015 and ). The Kahoot! platform has character limits for answer options. Additionally, the company provides a suggested structure for the questions and responses in order to make them work within the time constraints and make them more accessible to the youth population. We did not include the ‘don’t know/no answer’ option as was done on the adult survey because a kahoot gameplay experience is a scored game design, intended to make students consider and choose among options. Including “I don’t know” options among the choices weakens the incentive to use partial knowledge or logic to answer questions (Carriveau, Citation2016). The games are competitive in the classroom setting and there is no way to score non answers.
Questions 4–13 were original questions developed to address other key polar concepts from several different science disciplines, such as biology, physical and Earth science, as well as current events so that the quiz would be of interest to teachers leading a wide range of classes (see individual question notes in ). For example, the question and answers on ‘drunken trees’ was a lighthearted way of connecting to the thawing of permafrost, which is discussed in news and many science classes due to its link to climate change, population impacts and methane release. Adélie penguins have also been in the news with their dramatic population reductions resulting from warming weather in Antarctica. This question has relevance to environmental science and biology classes as a demonstration of how changes in the environment that have caused the Adélie to decline have opened a niche for the Gentoo penguin to expand its range. The walrus question was included as a fun fact but links to the physical and biological systems through changes in sea ice cover and the walrus high consumption rates and potential impact on the food web with their loss of mobility on the ice. Because an original goal of the polar kahoot was education, we included graphics with answers to questions 4, 7, and 11. Questions 4 on albedo and 7 on feedbacks were more complex system-based questions requiring careful reading and a graphic illustration was designed to scaffold the player. Questions 4, 5, and 7 are important polar concepts, but they used some scientific terminology (albedo, permafrost and positive feedback loop) which could have been unfamiliar to the students (see ).
The structure of the questions partly followed the guidance of Rodriguez and Haladyna (Citation2013), for assessment questions. These authors suggest using brief stems with positive wording and keeping the length of the answers the same. While the Kahoot! format permits the research-recommended three answer choices (Rodriguez & Haladyna, Citation2013) rather than the four that we used, most kahoots are structured with either two (in true/false question structure) or four answers (in multiple choice question structure) because these better fit the screen layout. Two or four answers were also a requested design element by our Kahoot! collaborators. In addition, because kahoot players expect a game-like experience and in order to meet our engagement goals, we varied the format of the stems between question and completion formats and we included some humorous answers.
To design questions appropriate for the anticipated age range of the kahoot players, the polar quiz was piloted with approximately 50 students by running and observing several teacher-hosted live platform games prior to the quiz release. Teachers and students were advised that the quiz was under development and feedback was welcome. The students included one fifth grade group (an accelerated academy school), two groups of middle school students, and one high school group. The pilot tests revealed that students were engaged in the kahoots with a lot of energy and excitement exhibited by the responders as they posted responses and waited to see results on the question post. After each question response was posted we held a quick discussion with the students. Overall the questions were understandable to the student groups, although some wording was adjusted after the pilot testing to improve comprehension and readability. Kahoot! staff also worked closely with us, reviewing and advising us on question clarity and design based on their extensive experience. We had expected that the scores might differ significantly with grade, as the question content did vary in complexity, however this did not appear to be the case. According to Kahoot! management, teachers typically review kahoots prior to playing them with their class and only use ones that they think will work for their students. Therefore, teacher hosts serve as an additional screen for age appropriateness of questions.
Implementation
Regarding implementation, while not every teacher launches and manages kahoots in exactly the same way, there is a general format. The following is a synthesis of standard instructional use of a kahoot based on descriptions by others (e.g., Wang & Lieberoth, Citation2016), our own experience, feedback from other teachers, and discussion with Kahoot! management. We (MT and SP) led or observed approximately 20 sessions of kahoots in classrooms, mostly in New York State. In addition, MT has attended several teacher workshops where Kahoot! was discussed as an instruction and assessment tool.
Teachers use kahoots in a variety of ways (Kahoot!, Citation2020) that will affect the accuracy of student responses. Each kahoot contains multiple questions, usually in the form of multiple choice or true/false, and is used by teachers in classrooms somewhat like a “clicker.” While some use it for pre-assessment, others use it for post-assessment, or both. Teachers often launch kahoots at the beginning of a class to introduce a topic and as a pre-assessment to find out what students know, and then follow-up the quiz with related instruction. Another way that teachers use kahoots is at the end of a class, sometimes for a post-assessment and sometimes on a topic not related to class material for a fun concluding experience. Plump and LaRosa (Citation2017) noted:
In our classrooms, we have used graded and ungraded quizzes to assess knowledge, comprehension, and retention (1) after completion of reading assignments, (2) following lectures, and (3) to review material from several units. (p. 154)
This means that teachers provide variable contextual information, which is an important caveat in interpretation of kahoot gameplay data for student knowledge assessment.
Teachers host Kahoot! quiz games for their students to foster a competitive and fun learning opportunity within the classroom. Maximum points are won by students who answer quiz questions accurately within the least amount of time. When teachers host a kahoot game, they typically launch it from the Kahoot! platform and project it and its unique game PIN onto a large screen in front of the class. The teacher can launch the game for the students to respond in teams or as individuals and there is an option for Kahoot! hosts to randomize the order of questions when the kahoot is played in live experiences. Using a wifi-enabled computer, tablet, or smartphone, teams or individual students log into the game via the game PIN and enter their name or a team nickname, which then appears on the large screen. Once all players are logged in, the teacher hosts the game and proceeds through the questions and answer options sequentially. Each question has a time limit for completion. After each question, a screen appears showing the distribution of answer responses offered by the players, as you would see with standard clicker results. Teachers can stop to discuss the question and review the reasons for the right and wrong answers, should they choose to do so.
Players do not have to answer all questions. If the question clock runs out of time before the player has submitted an answer, the player response system will not register an answer for that player. Therefore, players may skip questions that they deem hard because of unfamiliar content or complex wording. See, for example, the smaller number of responses to Question 10 versus 11 and 12 versus 13 (see ). Also, true/false questions, like Question 13, are likely to have more responses because the 50:50 odds of getting it right make it more attractive to answer.
Points are awarded within a kahoot gameplay experience based on answer accuracy and speed, and the next screen portrays the top 5 players’ nicknames. In addition to the top 5 players shown on the leader board, players may also see their nickname on the screen if they have answered several sequential questions correctly – known as an “answer streak.” After completion of the kahoot, the top three player nicknames appear in rank order. Teachers can access and download a dashboard with information on how the group did as a whole, by individual player/team, and for each question.
Beyond the live full-classroom engagement, teachers also assign homework challenges which are played on the Kahoot! mobile app as student-hosted games. Students then play them on their own in a less competitive environment.
Evaluation
Overall design and strategy
Validation of use of Kahoot! aggregated data for knowledge assessment
Aggregated data from kahoot game play have not been used before for knowledge assessment partly because data obtained through player responses to kahoot quizzes differ substantially from a survey of a population. The nature of the Kahoot! data limits the scope of analysis of aggregated knowledge. In order to protect anonymity, Kahoot! collects no background information such as age or gender of the teacher-hosted student players. Responses in the game-based player response system are identified only by question, type of user, geographic location, answer, and correct or incorrect. Therefore it is not possible to track responses by one individual from question to question. To demonstrate that information on aggregated student knowledge can be obtained from this unique data set, we analyzed results for validity and reliability by using measures such as internal consistency, face validity, and content validity (see below for further explanation).
Benchmark of US student polar knowledge
Currently there is no established set of questions for student polar knowledge assessment. The large bank of responses reported on here is a contribution for future work in this field. The thirteen questions included in the polar kahoot were analyzed to identify strengths and weaknesses in their wording to inform recommendations for benchmarking US student polar knowledge, and to guide educator development of additional questions for assessment.
Aggregated kahoot! responses as indicators of polar knowledge among US students
We used responses to Questions 1, 2, and 3 as indications of US student polar knowledge in comparison with general-public survey responses (from Hamilton et al., Citation2017) on three comparable questions.
We also explored differences in student responses by selected states to assess whether there are systematic differences in student polar knowledge. The data set used for evaluation of potential regional differences included responses to Questions 1, 2, 3, 4, 5, 7, and 8, as explained below.
Data sources
We present here the complete 13-question set of responses (see and Supplemental Material), along with an analysis of responses to a subset 7 of the 13 questions in the original polar kahoot. Three questions had the correct choice of “All answer choices are accurate” to achieve our original educational goals of supporting learning through game play. We did not analyze these questions, #6 on Penguins, #9 on Walrus, and #12 on the Antarctic Circumpolar Current, because it is not clear how to evaluate partially right answers (see , Rodriguez & Haladyna, Citation2013). We also did not include in this analysis Question 13, which was True/False. Questions 10 and 11 were not included because they were toward the end of the quiz and had fewer responses. Therefore, this analysis was confined to polar quiz questions 1–5 and 7–8. Each of these questions had four possible answers (see ).
Data collection
The polar kahoot was launched within the Climate Challenge campaign at the beginning of September 2018 and data were collected through the end of June 2019. Kahoot! featured our Climate Challenge quizzes on their website for the first six weeks and intermittently thereafter. Kahoot! has an active and engaged user base. Apart from Kahoot! featuring our quizzes, including them as part of their ‘Back to school’ campaign and promoting them through NOAA’s Climate Program Office and Columbia University, we did not do anything special to advertise or recruit participants.
Validity and reliability
There are two aspects to validity and reliability of the aggregated student responses. First, we do not know how the polar kahoot was used in classrooms across the United States. When used as pre-assessments, student answers will reflect their foundational knowledge. When used as post-assessments, student answers will reflect the classroom intervention. This means that the aggregated data set will include students who are provided with polar instruction, as well as those who are not. Because there is no a priori reason as to why there would be systematic differences in classroom setting, we consider this as causing a variation around a mean knowledge base or causing random errors (these errors fluctuate, but generally cluster around the true value). To reduce these types of errors, it has been recommended to increase the number of different classrooms tested/sample size (e.g., McGaw et al., Citation1972) and not assume subject independence within and across educational settings – even within randomized experimental design studies (e.g., Theobald & Dolan, Citation2018).
Second, traditional methods of assessing validity and reliability may not apply in game-based assessments. As opposed to, for example, a Likert-type survey, in this game-based assessment there were no individual-level identifiers for comparing repeated plays by the same students, should they occur. Nor could we combine multiple responses into an overall “polar knowledges” score for each student. These represent the two most common applications addressed by psychometric calculations such as reliability coefficients and split-half reliability tests (e.g., Cho, Citation2016; Santos-Beneit et al., Citation2015), but are impossible with kahoot data.
Regarding validity, as noted above Kahoot! does not collect demographic information such as student age or test scores, and the answers are not labeled by individual respondent in order to correlate with other variables that we would expect them to correlate with. This makes it impossible to test for criterion validity. Some indirect evidence for validity comes from the consistency of question difficulty rankings from state to state. Further, during pilot testing face validity and content validity, which are typically not assessed quantitatively, were also indirectly assessed. In any event, our primary interests here are in exploring what students do and do not know, in order to highlight opportunities and gaps.
Geographic data analysis
To explore the question of potential geographical patterns in polar knowledge, we analyzed teacher-hosted student player responses by state. Because there was substantial attrition of players (see , ), only 13 states had > 100 teacher-hosted players for all questions. We used 100 players as a round-number cutoff for minimum sample size in these comparisons. Below that size, 95% confidence intervals exceed plus or minus 10 points (roughly, ±100/sqrt(n)), making comparisons too imprecise.
Mean accuracy data showed that states varied in student knowledge. One-way analysis of variance (ANOVA) supported that these differences in mean response accuracy between states were significant.
For a more nuanced division of states according to accuracy patterns, we employed a cluster analysis (Everitt et al., Citation2001; software described in Hamilton, Citation2013). This family of statistical methods seeks empirical typologies by systematically grouping observations (here, states) into clusters that appear similar across a range of different variables (here, accuracy on 7 kahoot polar questions). Cluster analysis begins by calculating a numerical dissimilarity index between each pair of states. Two states with identical patterns of accuracy would have a dissimilarity index of 0 and two states with maximally different patterns would have a dissimilarity of 100. Dissimilarity for this analysis is defined from the Euclidian distance (square root of sum of squared differences) between states. The average-linkage technique we employed extends this idea to group states, then clusters of states, according to average dissimilarity between clusters. Simulation studies report that this clustering technique works well for many situations and is reasonably robust (Everitt et al., Citation2001; software described in Hamilton, Citation2013).
Results
Looking at just the US teacher-hosted data, there were 1,167 unique teacher hosts (based on the number of unique IP addresses) of the polar kahoot, with at least three teacher hosts in each of the 50 US states and Washington, DC (see ). On average, each unique teacher host ran 3.7 sessions with a standard deviation of 2.4. The average number of players per unique teacher host was 20.2 with a large standard deviation of 20.2 indicating that some teachers only launched the game to review it for themselves, while others launched it to variously sized classrooms.
Table 2. State inventory showing number of unique teacher hosts, number of sessions, number of players for question 1, average accuracy for analyzed questions 1–5, 7–8, and standard deviation.
If students guessed completely at random, we would expect about 25% to choose correctly. By standard formula, the 95% confidence intervals for percentages based on large samples (10,000+) are narrower than plus or minus 1 point. Thus, substantially fewer than 25% choosing a correct answer implies significant misperceptions or misinformation on that topic, not just randomly bad guessing. Conversely, substantially more than 25% choosing a correct answer suggests better information, beyond lucky guessing.
Polar kahoot analysis by state
All 50 US states and Washington, DC had at least three teacher-hosted players in the polar quiz (see ). States that were most engaged, ranking highest in terms of numbers of teacher-hosted players for Question #1 relative to their state student population, were: New Hampshire, Vermont, Delaware, Massachusetts, Rhode Island, Oklahoma, Nevada, and South Carolina. The states with the lowest relative engagement were: New Mexico, Iowa, Connecticut, West Virginia, Louisiana, North Dakota, Wyoming, and Idaho, with North Dakota, Wyoming, and Idaho having just 3–5 teacher hosts.
Investigation of the 13 states with >100 teacher-hosted players for all questions analyzed (see , ), shows that Rhode Island, Oregon, Arizona, and Washington had the highest polar knowledge, with average accuracies for questions 1–5, 7–8 ranging from 53–50% (Rhode Island to Washington), SD 0.13–0.09. States with intermediate accuracies ranging from 45–41%, SD 0.12–0.05 included New York, Florida, Arkansas, Michigan, Texas, and Indiana. Many states had an overall trend toward increasing accuracy in the question bank (see ). To assess this trend, we removed responses to Question 3 (see Discussion) and calculated coefficients of determination (R2): Oregon 0.93, Arizona 0.81, Texas 0.77, Washington 0.74, Michigan 0.68. Increasing accuracies of student responses would be expected in association with the high attrition rate observed within the polar kahoot: as noted below, it is likely that more knowledgeable students persisted. California had an average accuracy of 35% and a variable response pattern reflected in the highest standard deviation of the 13 states analyzed at 0.16 (see ).
Figure 4. Mean % correct by question for 13 states with >100 teacher-hosted players for polar kahoot questions 1–5, 7–8, in ranked order. Thick lines for Rhode Island, Oregon, Arizona, and Washington indicate highest overall polar literacy. Dashed lines for New York, Florida, Arkansas, Texas, Michigan, and Indiana represent states with intermediate literacy. Profiles for Illinois and Ohio are consistent with guessing throughout. California is the outlier, with the most variability.
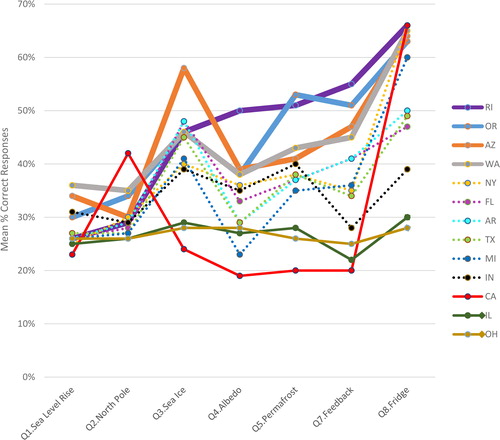
The pattern of responses for Ohio and Illinois with the lowest average accuracies of 27 and 28% and lowest standard deviations of 0.01 and 0.02, respectively, appear to reflect a high degree of guessing. Both correct as well as incorrect answers ranged between 18–32% indicating no strongly preferred right or wrong answer. The one question where a wrong answer was chosen slightly more frequently than the correct answer for both states was Question 2-Which answer best describes the North Pole?: ice more than a mile thick over land (Illinois 32% vs. 26% for the correct answer and Ohio 28% vs. 26% for the correct answer).
One-way analysis of variance (ANOVA) found significant differences among mean state levels of accuracy. For instance, the ANOVA indicated a statistically significant difference between Oregon (n = 4259; highest average knowledge-tied with Arizona) and Michigan (n = 3580; lowest average percent knowledge in the intermediate group), F(1, 5633) = 53.98, p < .001, and between Michigan and Ohio (n = 4259; lowest average percent knowledge-tied with Illinois), F(1, 7837) = 36.50, p < .001.
To further explore state-to-state variation, we used cluster analysis to see how they grouped into “types.” visualizes our cluster analysis results for the 13 states with at least 100 players for each question analyzed. Illinois and Ohio students, for example, exhibit quite similar accuracy patterns (dissimilarity about 6), so those two states are the first to merge. At a dissimilarity index around 13, Illinois and Ohio merge with Texas, to form one of four roughly distinct clusters having average dissimilarities below 20: (1) Arkansas, Arizona, Indiana, Florida, Michigan, New York; (2) California by itself; (3) Illinois, Ohio, Texas; and (4) Oregon, Washington, Rhode Island.
Figure 5. Results from cluster analysis grouping 13 states according to similarities in patterns of accuracy across questions 1–5, and 7–8. The vertical axis represents the average dissimilarity distinguishing states or groups of states: 0 would be identical patterns, and 100 would indicate maximum dissimilarity.
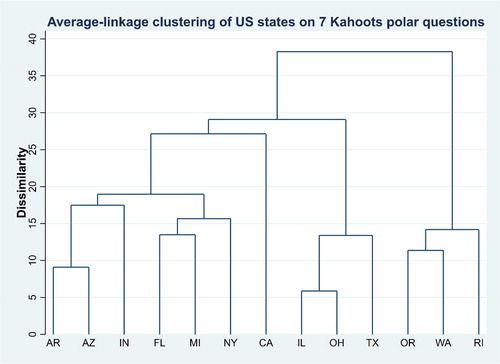
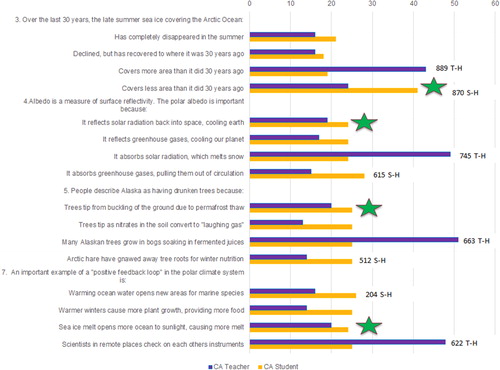
The fact that California stays in a cluster by itself, unlike any other state, relates to high variability in performance from question to question: from worse-than-guessing percentages on questions 3, 4, 5, 7, up to the very good value of 67% accuracy on question 8. This variability is noteworthy given the large number of unique California teacher hosts: 131 (see ). Further analysis of the four analyzed questions where California teacher-hosted performance was below guessing (see ), showed a strongly preferred wrong answer by California teacher-hosted players. Because there was also a large number of student-hosted players in California (for example 870 responses to Question #1), we present their responses for comparison with the teacher-hosted classroom results. For most questions, the California student-hosted data revealed a response pattern of ca. 25% for each answer, which we might expect from purely random guessing on these four-response items. For question 3, the student-hosted responses were actually higher for the correct answer, than the teacher-hosted classroom responses (see ).
Figure 6. Answer-level analysis of CA teacher-hosted vs. student-hosted responses for the four questions where teacher-hosted performance was well below student-hosted performance, and additionally was below the guessing rate of 25% (see ). Stars indicate correct answers. Labels indicate number of players for most frequently chosen teacher-hosted (T-H) and student-hosted (S-H) answers.
Discussion
Our first question in this exploratory analysis is whether or not aggregated results from kahoot gameplay data truly measure student knowledge. There are several factors that can influence the accuracy of kahoot responses, including question design, players not doing their best, variable content provided within the classroom, and changes in the population during the quiz. Regarding question design, all questions were pilot tested with an appropriate age range of students, were reviewed by Kahoot! staff who have extensive experience with developing questions suitable for their participants, and were selected by the teacher hosts who have a first-hand perspective on which questions are appropriate for their classroom.
In comparison with conventional testing, research on Kahoot! as well as other game-based assessments indicates greater student engagement and motivation, as well as lower anxiety, which are all associated with better performance (Bicen & Kocakoyun, Citation2017; Cameron & Bizo, Citation2019; Chang et al., Citation2012; Mavridis & Tsiatsos, Citation2016; Tan et al., Citation2018; Turan & Meral, Citation2018; Wang, Citation2008; Wang & Lieberoth, Citation2016; Wang et al., Citation2016; Wichadee & Pattanapichet, Citation2018; Zarzycka-Piskorz, Citation2016). Students receive kahoot scores based on speed as well as accuracy, and there is no obvious incentive to answer incorrectly. Often teachers use the Kahoot! platform for assessment purposes (EdTech, 2018), with many recording student results which provides an incentive for students to do their best.
On the other hand, the percent correct on a kahoot quiz could underestimate knowledge for several reasons. It is possible that students may try to speed through and not attempt to do their best if teachers are not recording their answers. The Wang and Lieberoth (Citation2016) study examining the impact of variations in the use of audio (kahoot quizzes include a game-like music track when questions are launched) and points found that 23% of respondents playing a full kahoot agreed with the statement “I did not try very hard to do well on the quiz.” They found this to be due, at least in part, to the fact that the audio made it feel less like a formal test. However, this was not our experience with playing kahoots in classrooms or a concern raised in other studies. For example, Tan et al.’s (Citation2018) analysis of motivation and learning, found that all students surveyed slightly to strongly agreed that they “respond as accurately as possible to each item or question in each Kahoot! session” (p. 575). The time constraint to answer a kahoot question (maximum value of 120 seconds) was set to 60 seconds for all polar kahoot questions following the recommendation of the Kahoot! staff. This limited time to answer each question is another issue that has been identified as a potential drawback (Grinias, Citation2017; Jamil et al., Citation2018). Studies show that while the majority of students enjoy the use of Kahoot! (Grinias, Citation2017; Tan et al., Citation2018), one study found that a small minority of students may find kahoots stressful (Zarzycka-Piskorz, Citation2016). The stress could be due to their timed and competitive framing, or due to the music that plays during the response time which most students enjoy (Wang & Lieberoth, Citation2016) but some find distracting, as noted above. As is the case with most assessment instruments, Leung and Pluskwik (Citation2018) observed that students who spent more time reading and thinking about kahoot questions, tended to get more answers correct.
With respect to differential classroom contexts, it is clear that teachers are likely to select kahoots of interest to them and that support their instructional content. We would therefore expect that many teachers would provide supplementary polar context in the classroom. If this contextual information was provided before the students played the kahoot, the scores represented by teacher-hosted players would overestimate foundational student knowledge. A limitation of this analysis is that there was no way for us to find out with certainty when teachers provided contextual information vs. when teachers did not. The comparison of California teacher-hosted vs. student-hosted players is a step in that direction. However, it requires very large numbers of players to be able to do this type of comparative analysis and such numbers are generally only reached over a long period of time.
Another issue that needs to be considered when interpreting data from the Kahoot! game-based player response system is the change in population from question to question within a quiz. As noted above, the polar quiz had a large attrition rate: 75% from the first question to the eighth. Based on our experience and discussions with colleagues, we believe this attrition rate likely reflects several factors: teachers who had not previewed the quiz and realized that it was not a good fit partway through, disengagement of players who were not interested in the material, attrition by players who were unfamiliar with the information and therefore were getting many questions wrong, teachers running out of time for the activity, and technology issues. Some teachers use Kahoot! at the end of a class, to conclude with a fun activity, and may stop in mid-kahoot if the class period ends. Also classroom technology can be an issue and may account for some of the kahoots being started but not finished (ÇETİN, Citation2018; Tan et al., Citation2018). When viewed within the context of the overall upward trend in polar quiz accuracy by question observed for many states (see ), we hypothesize that the polar kahoot attrition partly represents frustrated teachers/students dropping off, while knowledgeable teachers/students persist. Therefore, when there is substantial attrition within a kahoot quiz, there is likely to be an increase in mean percent correct for the later questions because the students who are unsuccessful or unfamiliar with the material stop participating.
Reliability
Regarding the reliability of state-level conclusions, a typical measure of internal consistency is a statistical correlation analysis, which was not possible with this data. A look at the polar kahoot player results from states that have sufficient players (at least 100 for all questions), may offer an informal measure of internal consistency in several ways. First, student players in most states found the same questions easier (questions 3 and 8) as well as harder (questions 1, 2, 4) (see ). Second, in keeping with the exposure-selection of model of Niemi and Junn (Citation1998) discussed below, states with similar demographic (Silver, Citation2008), educational, and/or environmental settings have similar polar kahoot results. For example, the adjacent states of Oregon and Washington had a response pattern that was similar to each other (see and ). Third, most states – other than California – maintained a similar ranking in average percent correct from question to question (see ). This stability in the question rankings across states suggests that the ranks give a valid indicator of question difficulty, or polar knowledge, across a range of educational systems.
US student vs. adult content knowledge findings
The nationwide 2016 POLES survey assessed polar knowledge among a representative sample (N = 1,411) of US adults (Hamilton, Citation2018; Hamilton et al., Citation2017). Independent replications asking the same questions on a series of statewide New Hampshire surveys between 2014 and 2018 obtained results similar to POLES in terms of both response distributions and their correlates. Those results support the reliability and validity of these questions (see item-by-item comparisons in Hamilton, Citation2016, Citation2018). The average kahoot player accuracy of 30% (SD = .06) on the three similar polar knowledge questions (see ) shows that US students demonstrated a low level of polar knowledge, lower than observed in this prior survey of US adults (average accuracy 49%, SD = .18). These low values clearly include a substantial proportion of the student Kahoot! players were guessing (see , ).
In terms of assessing specific content knowledge, there was widespread confusion regarding the important role of the two ice sheets (Greenland & Antarctica) in sea level rise (Question 1, 26% responded correctly). Regarding what type of ice melt would contribute most to sea level rise (Question 1, see ), 41% of adult survey respondents chose the wrong answer: Arctic sea ice. The lack of differentiation in student responses to this question during teacher-hosted games from the platform indicates that they were guessing to a much greater degree: Arctic sea ice 29%, Greenland/Antarctic land ice 26% (correct answer), Alaskan glaciers 25%, and Himalayan glaciers 20%.
When asked to describe the North Pole, 44% of adults and 29% of students chose the correct answer: ice a few feet or yards thick, floating over a deep ocean (Question 2, see ). Similar percentages of adults (38%) and students (34%) chose the incorrect option of thick ice over land.
Students responses tended to improve on Question 3 on Arctic sea ice loss (35% of players chose the correct response) which is often in the news. In comparison, most adults (69%) correctly answered that ice on the Arctic Ocean in late summer covers a smaller area than it did 30 years ago (Question 3, see ). An additional 19% of students incorrectly believed or guessed that summer sea ice covering the Arctic Ocean has completely disappeared. The POLES survey did not have this answer option. Even if the two answer options regarding diminished ice are summed for the students (19% + 35% = 54%), fewer students chose this response than the 69% of adults. Twenty-six percent of students compared with only 9% of adults believed or guessed that Arctic sea ice covers more area than it did 30 years ago.
Responses to this question on Arctic change may be influenced by other factors. Detailed analyses of adult surveys with similar questions conducted in the US show that many people respond to the question about Arctic sea ice as if they had been asked for their opinion about climate change (Hamilton, Citation2012, Citation2015, Citation2018, Citation2020; Hamilton et al., Citation2017; Hamilton & Fogg, Citation2019). Consequently, results cannot be unambiguously interpreted. The North Pole (Question 1) and sea level rise questions (Question 2), on the other hand, do not share this property. These two questions provide belief-neutral indicators for knowledge, usable for constructing polar-knowledge scores (Hamilton, Citation2018; Hamilton & Fogg, Citation2019).
Student responses to Question 8, identifying the poles as the planet’s refrigerators, was one of the most accurate (52% of players chose the correct response). For questions 4, 5 and 7 the scientific terminology used might have negatively affected student responses by assessing their understanding of the terminology rather than their understanding of the scientific process. Specifically, student responses for Question 5 on permafrost thaw, may have suffered from a lack of understanding of what permafrost was (32 % of players chose the correct response). For Question 7 on positive feedback loop the answer was in the graphic, however the phrase is not intuitive (see ) and may have caused some confusion (31% of players chose the correct response). Additionally, the terminology and somewhat complex wording of question 4 on albedo (28% of players chose the correct response) may also have affected response accuracy.
US student content knowledge variations by state
Our exploratory results finding state-to-state differences give preliminary indications that polar knowledge varies regionally in the US. A formal assessment of geographic (or educational-system) differences in polar knowledge requires a more extensive data set with representation from all regions of interest, along with analyses of classroom context. This research might find the theoretical framework developed by Niemi and Junn (1998) useful. Their exposure-selection model was developed to understand student learning of civics. Both civics and polar knowledge are likely to be accrued outside of the classroom as well as inside, and are influenced by current events (Hamilton & Keim, Citation2009, Hamilton & Lemcke-Stampone, Citation2014) which is less the case for other subjects such as physics and chemistry. Also both civics and polar knowledge are often, but not always, associated with politics (see for example Hamilton Citation2012, Citation2015, Citation2016, Citation2020 on politization of polar knowledge). The Niemi and Junn (1998) exposure-selection model has three elements: exposure to relevant content (both inside and outside of the classroom), as well as selection and retention (which facts are remembered) and coverage, emphasis, and importance. Factors that influence exposure, selection and coverage could include coastal connections with sea level rise, exposure to the polar vortex, local changes in winter snow and ice, and if teachers included climate instruction.
Implications
Validation of the use of kahoot! campaign data for knowledge assessment
Beyond the polar knowledge findings that are the main focus of this study, this first content assessment of aggregated Kahoot! player response data from a large-scale campaign showed that data from kahoot quizzes can be used to learn something about player knowledge. The ability to assess overall knowledge of respondents by comparing from state to state, offers a window into curriculum and instructional differences across different regions.
However, along with player knowledge, classroom context differs and this affects student responses to kahoot quizzes. The comparison of California teacher-hosted vs. student-hosted players showed that students answered differently in the classroom than when they were on their own. Additionally, there may have been differences in student responses from students who played in teams versus individually. In a team play situation individual knowledge may not be reflected; however the opportunity for students to discuss their response in a team prior to answering may actually improve learning. Future smaller scale studies could build from this exploratory analysis by working with specific teachers to find out in what context the teachers use Kahoot!. How many use it as an engagement exercise or pre-assessment to understand what their students already know about the topic? How many deploy it as a post-assessment to determine the effectiveness of their instruction? Do any teachers use Kahoot! as both a pre- and post- assessment? Do they use it for individual assessment versus teams hosting short discussions and then responding? Why is there a drop off in student participation during quizzes? Do teachers see students in their classrooms not continuing when they are getting low scores? Note that if researchers work directly with teachers, researchers would collect the conditions under which the Kahoot! was launched, and could track the class as a whole, as well as individual students, to determine student engagement, baseline understanding, and overall learning gains through using the teacher dashboard tool. Also, specific questions of interest could be co-developed between the teacher and researcher.
In addition to assessing differences between states, there is also the possibility to assess US respondents against students around the world. As of December 2020, the Climate Challenges campaign has had more than 2 million players in 178 countries showing the extremely broad reach of the Kahoot! platform. This proof of concept analysis demonstrates that educators can use aggregated kahoot data to assess differences in knowledge on a wide variety of topics, including potentially differences by country. On a topic of such global importance there is real value in being able to look across different countries to assess the level of polar climate literacy in their students.
Benchmark of polar knowledge assessment
Through this contribution, the community now has a set of polar knowledge questions (see and Supplemental Materials), with limitations identified, and data from thousands of US student responses to each of these questions to use as a benchmark for their own data collection of their educational endeavors. There have been several calls for crowdsourcing assessment question sets for specific fields, such as a kahoot Chemistry set based on user-generated open-source quizzes (Grinias, Citation2017). Here we propose that, building from the questions reported on here, we could also crowdsource a suite of polar knowledge kahoot questions through an existing Kahoot! game creator feature called question bank, and use these for pre- and post-assessment as recommended by Grinias (Citation2017). The newly developed Polar Literacy Principles (McDonnell et al., Citation2020) would provide an excellent structure for designing a more extensive question bank. Scientists as well as formal and informal educators could then select from the polar questions to test the efficacy of their interventions within different contexts, as well as to track polar knowledge over time.
However, as discussed above, the specific suite of polar questions that we used were not ideal for assessment, because that was not their original goal. To crowd-source question Kahoot! banks for knowledge assessment, future question designers should follow the best practices in assessment question design outlined by Rodriguez and Haladyna (Citation2013), as well as others. For example, people wanting to use Kahoot! for assessment purposes should include three answer options, neutral graphics, and not use True/False or “All answer choices are accurate.”
Low level of US student polar knowledge
This first assessment of a low level of US student polar knowledge in comparison with that of adults, indicates that there is a real need for professional learning experiences for teachers to explicitly address polar issues. The popularity of the polar kahoot indicates that there is interest in teaching polar content, suggesting an investment in this type of professional learning would be worthwhile. Polar knowledge is important in a wide range of coursework from the physical sciences to the social sciences. Schloesser and Gold (Citation2020) found that 81% of teachers who responded to a polar education survey, and therefore were presumably interested in teaching about the poles, had not received professional training on polar topics.
In turn, as noted by Xavier et al. (Citation2016), “Polar examples can be an excellent way to transmit basic concepts about a wide range of STEM (science, technology, engineering, and mathematics) disciplines” (p. 46). This means that polar topics have relevance for inclusion in a wide variety of classrooms, including geography and Earth systems instruction, biology, and current events (Schroeter et al., Citation2015, Shabudin, et al. Citation2016). Several polar education focused projects including the PoLAR Climate Change Education Partnership (https://thepolarhub.org/database/), Polar ICE (https://polar-ice.org/focus-areas/polar-data-stories/), Byrd Polar and Climate Research Center (https://byrd.osu.edu/educator/lessons), and PolarTREC (https://www.polartrec.com/resources/search) have developed robust archives of examples of educational resources that support polar knowledge for both teachers and students.
We have the resources to increase student polar knowledge, but lack the structure to effectively train teachers in this area. Until teachers are comfortable teaching about the polar regions, and including polar concepts throughout their course materials, we will not effectively address this challenge.
Disclosure statement
One author works for Kahoot!, which is a for-profit company.
Additional information
Funding
References
- American Museum of Natural History. (2019). Retrieved from https://create.kahoot.it/profile/AMNH_Official
- Anisimov, O. A., Vaughan, D. G., Callaghan, T. V., Furgal, C., Marchant, H., Prowse, T. D., Vilhjálmsson, H., & Walsh, J. E. (2007). Polar regions (Arctic and Antarctic). In M. L. Parry, O. F. Canziani, J. P. Palutikof, P. J. van der Linden, and C. E. Hanson (Eds.), Climate Change 2007: Impacts, Adaptation and Vulnerability. Contribution of Working Group II to the Fourth Assessment Report of the Intergovernmental Panel on Climate Change (pp. 653–685). Cambridge University Press.
- Bicen, H., & Kocakoyun, S. (2017). Determination of University students' most preferred mobile application for gamification. World Journal on Educational Technology: Current Issues, 9(1), 18–23. https://doi.org/10.18844/wjet.v9i1.641
- Cameron, K. E., & Bizo, L. A. (2019). Use of the game-based learning platform KAHOOT! To facilitate learner engagement in Animal Science students. Research in Learning Technology, 27, 1–14. https://doi.org/10.25304/rlt.v27.2225
- Carriveau, R. (2016). Connecting the dots: Developing student learning outcomes and outcomes-based assessments (2nd ed.). Stylus Publishing.
- Çetin, H. S. (2018). Implementation of the digital assessment tool kahoot in elementary school. International Technology and Education Journal, 2(1), 9–20.
- Chang, K. E., Wu, L. J., Weng, S. E., & Sung, Y. T. (2012). Embedding game-based problem-solving phase into problem-posing system for mathematics learning. Computers & Education, 58(2), 775–786.
- Cho, E. (2016). Making reliability reliable: A systematic approach to reliability coefficients. Organizational Research Methods, 19(4), 651–682. https://doi.org/10.1177/1094428116656239
- EdTech. (2018). EdTech Top 40. Retrieved from https://learnplatform.com/edtech-top-40
- Everitt, B. S., Landau, S., & Leese, M. (2001). Cluster analysis (4th ed.). Arnold.
- Francis, J. A., & Vavrus, S. J. (2012). Evidence linking Arctic amplification to extreme weather in mid-latitudes. Geophysical Research Letters, 39(6), L06801. https://doi.org/10.1029/2012GL051000
- Grinias, J. P. (2017). Making a game out of it: Using web-based competitive quizzes for quantitative analysis content review. Journal of Chemical Education, 949, 1363–1366.
- Hamilton, L. C. (2012). Did the Arctic ice recover? Demographics of true and false climate facts. Weather, Climate, and Society, 4(4), 236–249. https://doi.org/10.1175/WCAS-D-12-00008.1
- Hamilton, L. C. (2013). Statistics with Stata (version 12). Cengage.
- Hamilton, L. C. (2015). Polar facts in the age of polarization. Polar Geography, 38(2), 89–106. https://doi.org/10.1080/1088937X.2015.1051158
- Hamilton, L. C. (2016). Where is the North Pole? An election-year survey on global change. Durham, NH: Carsey School of Public Policy. http://scholars.unh.edu/carsey/285/
- Hamilton, L. C. (2018). Self-assessed understanding of climate change. Climatic Change, 151(2), 349–362. https://doi.org/10.1007/s10584-018-2305-0
- Hamilton, L. C. (2020). Two kinds of polar knowledge. Journal of Geoscience Education, 1–7. doi:10.1080/10899995.2020.1838849.
- Hamilton, L. C., Cutler, M. J., & Schaefer, A. (2012). Public knowledge and concern about polar-region warming. Polar Geography, 35(2), 155–168. https://doi.org/10.1080/1088937X.2012.684155
- Hamilton, L. C., & Fogg, L. M. (2019). Physical-world knowledge and public views on climate change. University of New Hampshire Scholars Repository. https://scholars.unh.edu/faculty_pubs/648/
- Hamilton, L. C., & Keim, B. D. (2009). Regional variation in perceptions about climate change. International Journal of Climatology, 29(15), 2348–2352. https://doi.org/10.1002/joc.1930
- Hamilton, L. C., & Lemcke-Stampone, M. (2014). Arctic warming and your weather: Public belief in the connection. International Journal of Climatology, 34(5), 1723–1728. https://doi.org/10.1002/joc.3796
- Hamilton, L. C., Wirsing, J., Brunacini, J., & Pfirman, S. (2017). Arctic knowledge of the US. Witness the Arctic. https://www.arcus.org/witness-the-arctic/2017/5/highlight/2
- Howe, P. D., Mildenberger, M., Marlon, J., & Leiserowitz, A. (2015). Geographic variation in opinions on climate change at state and local scales in the USA. Nature Climate Change, 5(6), 596–603. https://doi.org/10.1038/nclimate2583
- Jamil, Z., Fatima, S. S., & Saeed, A. A. (2018). Preclinical medical students' perspective on technology enhanced assessment for learning. JPMA, 68, 898–903.
- Kahoot! (2018). Company presentation, December 17, 2018. https://kahoot.com/files/2018/12/Kahoot_Company_Presentation_17_Dec2018.pdf
- Kahoot! (2020). Kahoot! for schools ways to play. https://kahoot.com/schools/ways-to-play/
- Leung, E., & Pluskwik, E. (2018). Effectiveness of gamification activities in a project-based learning classroom. Paper presented at ASEE Annual Conference & Exposition. Paper ID #22413.
- Mavridis, A., & Tsiatsos, T. (2016). Game-based assessment: Investigating the impact on test anxiety and exam performance. Journal of Computer Assisted Learning, 33(2), 1–14. https://doi.org/10.1111/jcal.12170
- McDonnell, J., Hotaling, L., Schofield, O., & Kohut, J. (2020). Key concepts in polar science: Coming to consensus on the essential polar literacy principles. Current: The Journal of Marine Education, 34(1), 2–8. https://doi.org/10.5334/cjme.42
- McGaw, B., Wardrop, J. L., & Bunda, M. A. (1972). Classroom observation schemes: Where are the errors? American Educational Research Journal, 9(1), 13–27. Retrieved from http://www.jstor.com/stable/1162047NationalAssociationofGeoscienceTeachers.(2019).Geoscienceliteracies. Retrieved from https://nagt.org/nagt/teaching_resources/literacies.html https://doi.org/10.3102/00028312009001013
- National Geographic. (2019). Retrieved from https://create.kahoot.it/pages/NationalGeographic/12623069-dd17-40db-ae6b-098d323d3877
- National Research Council. (2012). Lessons and legacies of international polar year 2007–2008. The National Academies Press.
- Newton, R., Pfirman, S., Schlosser, P., Tremblay, B., Murray, M., & Pomerance, R. (2016). White Arctic vs. Blue Arctic: A case study of diverging stakeholder responses to environmental change. Earth's Future. 44(8), 396–405. https://doi.org/10.1002/2016EF000356
- Niemi, R. G., & Junn, J. (1998). Civic education: What makes students learn. Yale University Press.
- Plump, C. M., & LaRosa, J. (2017). Using Kahoot! in the classroom to create engagement and active learning: A game-based technology solution for eLearning novices. Management Teaching Review, 2(2), 151–158. https://doi.org/10.1177/2379298116689783
- Provencher, J., Baeseman, J., Carlson, D., Badhe, R., Bellman, J., Hik, D., Huffman, L., Legg, J., Pauls, M., Pit, M., Shan, S., Timm, K., Ulstein, K., & Zicus, S. (2011). Polar research education, outreach and communication during the fourth IPY: How the 2007–2008 international polar year has contributed to the future of education, outreach and communication. International Council for Science (ICSU). Retrieved from https://munin.uit.no/bitstream/handle/10037/3730/article.pdf?sequence=1
- Rodriguez, M. C., & Haladyna, T. M. (2013). Writing selected-response items for classroom assessment. In SAGE handbook of research on classroom assessment (pp. 293–312). SAGE Publications Inc.
- Santos-Beneit, G., Sotos-Prieto, M., Bodega, P., Rodríguez, C., Orrit, X., Pérez-Escoda, N., Bisquerra, R., Fuster, V., Peñalvo, J. L. (2015). Development and validation of a questionnaire to evaluate lifestyle-related behaviors in elementary school children. BMC Public Health, 15, 1–7. https://doi.org/10.1186/s12889-015-2248-6
- Schloesser, K. A., & Gold, A. U. (2020). Bringing polar topics into the classroom: Teacher knowledge, practices, and needs. Journal of Geoscience Education, https://doi.org/10.1080/10899995.2020.1729076
- Schroeter, S., Lowther, N., Kelman, E., & Arnold, M. (2015). Overcoming challenges to communicating Antarctic climate science. The Polar Journal, 5(1), 59–81. https://doi.org/10.1080/2154896X.2015.1040257
- Shabudin, A. F. A., Rahim, R. A., & Ng, T. F. (2016). Strengthening scientific literacy on polar regions through education, outreach and communication (EOC). International Journal of Environmental & Science Education, 11(12), 5498–5515.
- Silver, N. (2008). State similarity scores. FiveThirtyEight, July 7, 2008. https://fivethirtyeight.com/features/state-similarity-scores/
- Tan, D., Ganapathy, M., Kaur, M. (2018). Kahoot! it: Gamification in higher education. Pertanika Journal of Social Sciences & Humanities, 26(1), 565–582.
- Theobald, E., & Dolan, E. L. (2018). Students are rarely independent: When, why, and how to use random effects in discipline-based education research. CBE Life Sciences Education, 17(3), 1–12.10.1187/cbe.17-12-0280
- Turan, Z., & Meral, E. (2018). Game-based versus to non-game-based: The impact of student response systems on students' achievements, engagements and test anxieties. Informatics in Education, 17(1), 105–116. https://doi.org/10.15388/infedu.2018.07
- Turrin, M., Zaima, L., Keen, C., Pfirman, S. (2019). Climate challenge Kahoot! campaign. https://create.kahoot.it/profile/Columbia_University
- Turrin, M., Pfirman, S., & Hamilton, L. (2020). Polar Fun and Games. Current: The Journal of Marine Education, 34(1), 9–14. https://doi.org/10.5334/cjme.43
- U.S. Department of Education, National Center for Education Statistics. (2001). A Comparison of the National Assessment of Educational Progress (NAEP), the Third International Mathematics and Science Study Repeat (TIMSS-R), and the Programme for International Student Assessment (PISA), NCES 2001-07, by David Nohara. Arnold A. Goldstein, project officer. U.S. Department of Education, National Center for Education Statistics.
- Wang, T. H. (2008). Web-based quiz-game-like formative assessment: Development and evaluation. Computers & Education, 51, 1247–1263.
- Wang, A. I., & Lieberoth, A. (2016, October). The effect of points and audio on concentration, engagement, enjoyment, learning, motivation, and classroom dynamics using Kahoot. In European Conference on Games Based Learning (Vol. 20). Academic Conferences International Limited.
- Wang, A. I., Zhu, M., & Saetre, R. (2016). The effect of digitizing and gamifying quizzing in classrooms. Academic Conferences and Publishing International. 10th European Conference on Game Based Learning (ECGBL 2016), At Paisley, Scotland.
- Wichadee, S., & Pattanapichet, F. (2018). Enhancement of performance and motivation through application of digital games in an English language class. Teaching English with Technology, 18(1), 77–92.
- Xavier, J. C., Fugmann, G., Beck, I., Huffman, L., & Jensen, E. (2016). Education on biodiversity in the polar regions. In Biodiversity and education for sustainable development (pp. 43–56). Springer.
- Zarzycka-Piskorz, E. (2016). Kahoot it or not? Can games be motivating in learning grammar? Teaching English with Technology, 16(3), 17–36.