Abstract
Understanding the differences in delivery by feeders as affected by the powder properties is important for control but not much is written about this in the scientific literature. A regression analysis was undertaken to determine how to quantitatively integrate the effects of powder physicochemical properties on delivery through a twin-screw feeder. There was a linear relationship between powder delivery and screw speed over the entire operating range of the commercial twin-screw feeder test platform with the slope varying with the material delivered. Apparent particle density and particle size represented by both D50 and mode of a volume weighted particle size distribution (PSD) were found to have the most influence on delivery rate. Their effects could be quantitatively accounted for through a multiple regression equation for predicting the slope of the linear powder delivery curves.
INTRODUCTION
The food industry is producing an increasing variety and quantity of powders and granular material either as final processed food products or as ingredients in further processed foods. Handling and such other process unit operations as formulation and mixing are keys in efficiently and effectively blending and utilizing those ingredients to make healthful and nutritious foods.
As consumers have become more health conscious, there has been greater emphasis on improving the nutritional profile of foods[Citation1,Citation2] or being able to deliver other health benefits through foods. For example, extruded snack foods, which are mostly starch-based foods that have high levels of carbohydrates, lipids, and salt and low levels of proteins and minerals, have been implicated as contributing toward the higher incidence of obesity and diabetes in the U.S. Recent scientific developments make it possible to improve the nutritional profile of these products through fortification with whey protein.[Citation3–7] Successful incorporation of whey protein into extruded snack products will improve the nutrient density of these snacks by increasing protein content and presents an alternative avenue for higher value utilization of whey proteins. This potentially increases the utilization of whey products in foods, which is still below 50% of total production [Citation8].
In automated blending or mixing operations, the feed powder delivery system is a critical component in the production of uniform formulations. It is used to provide raw material to a mixer, or even an extruder, in the correct ratio and concentration. When properly selected, the feed system provides reliable, predictable, and controllable solids flow to other downstream food processes. The feed system controls the flow of bulk solids from a storage/holding bin and is the heart of the feed system. A feeder, usually rated by manufacturers based on volume capacity, must be selected to suit a particular bulk solid and the range of feed rates required. To work in unison with the bin, the feeder must suit the material flow properties, withdraw the material uniformly across the outlet's cross-sectional area, minimize the load the material applies to the feeder, and accurately control the discharge or delivery rate.[Citation9] Oftentimes, however, there is already a feeder in place and its operation has to be controlled with respect to the type of powder to be delivered. Screw feeders are quite useful in producing uniform feed rates for a variety of bulk solids and they use very simple components. As a result, they are widely used in the food industry. Twin-screw feeders, in particular, are used to handle more difficult materials like sticky materials, pigments, fiber and fiberglass, and bridging or flooding powders.
The need for the specification and accurate prediction of powder behavior in handling and processing equipment is certainly becoming more compelling in a market environment with greater health concerns[Citation10] and quality expectations. Thus, understanding the differences in delivery produced by the flow promotion device as affected by the powder properties will be valuable as little information is available about this in the scientific literature. Researchers have focused on evaluating the flowability or flow properties of powders as an intrinsic property of the powder[Citation11–14] independent of the flow promotion device. One of the few studies is by Hoffmann et al.[Citation15] who related the behavior of powders in a handling apparatus with fundamental properties of the constituent particles of the powders. Working with a precision powder filler employing the auger principle, they found that for the range of powders they investigated the filling capacity for a given powder could be predicted directly from two equations involving particle diameter, voidage fraction, and particle shape as represented by the square of the circularity of the projection of the particle. Information, even if specific to a particular flow promotion device, will certainly be of great practical value because it can serve as a reference basis for equipment selection or adjustment of equipment operational settings by engineers and technicians. As such, the objectives of this research were:
-
To measure and quantify the delivery of different types of food powders in a twin-screw feeder at increasing feeder settings.
-
To analyze the effect of the nature of food powders and their physicochemical properties on powder delivery by this mechanized conveying system.
MATERIALS AND METHODS
Powders
It was the premise of the study that the nature of food powders affects their delivery by a feeder system. In this regard, different categories of food powders were tested. Several powders within each category were selected in order to test whether the delivery of powders by a twin-screw feeder could be generalized according to the fundamental nature of the food powders or according to types within each category. The food powders studied fell into three broad categories: 1) cereal powders, 2) milk powders, and 3) whey powders. All 14 products tested were procured commercially in the USA. The cereal powders included corn meal (Agricor, Inc., Marion, Ind.); corn starch (Tate & Lyle North America, Decatur, Ill.); corn flour (Agricor, Inc., Marion, Ind.), malted barley flour (ConAgra Foods, Omaha, Neb.), oat flour (ConAgra Foods, Omaha, Neb.), soy flour (Cargill Soy Protein Solutions, Cedar Rapids, Iowa), and whole wheat flour (ConAgra Mills, Omaha, Neb.). Whey powders consisted of sweet whey (Dairy Farmers of America, Inc., Kansas City, Mo.), whey protein concentrates (WPC34 - Dairy Farmers of America, Inc., Kansas City, Mo.; WPC75 – CALPRO Ingredients, Corona, Calif.; WPC80 – Davisco Foods International, Inc., Eden Prairie, Minn.), and whey protein isolates (WPI190, WPI192 – Glanbia Nutritionals, Monroe, Wis.).
Flour is a fine powder made from starchy food sources (e.g., wheat, rice, potato). Whole grain flours are produced by grinding whole grains (including bran, germ, and endosperm) and nothing is separated nor lost in the process of making flour. Malted barley flour is the product of grinding barley grains that have been allowed to germinate then quickly dried before the plant develops and is therefore a whole flour. Soy flour is produced by fine grinding soy flakes from the oil extraction process. Oat flour is made from oats that have been cleaned, toasted, and hulled. Corn flour is obtained by finely grinding corn meal. Corn meal is a coarser, somewhat granular preparation, rather than a fine powder, produced from what remains of corn kernels after the hull and germ have been removed. Cornstarch is the material made by pulverizing ground, dried residue of corn grains after preparatory soaking and removal of the embryo and the pericarp.
Nonfat dry milk (NFDM), also known as Dried Skim Milk (DSM), is the product resulting from the removal of fat and water from pasteurized, fresh cow's milk and contains lactose, milk proteins, and milk minerals in the same relative proportions as in fresh milk from which it is made. It contains not over 5% by weight of moisture. The fat content is not over 1.5% by weight unless otherwise indicated.
Sweet whey is obtained by drying fresh whey (derived during the manufacture of cheeses such as Cheddar and Swiss) that has been pasteurized and to which nothing has been added as a preservative. In the cheese making process there is insignificant conversion of lactose to lactic acid. Whey protein concentrate (WPC) is the substance obtained by the removal of sufficient non-protein constituents from pasteurized whey so that the finished dry product contains more than 34% protein. Whey protein concentrate is produced by physical separation techniques such as precipitation, filtration, or dialysis. Whey protein isolate (WPI) is the substance obtained by the removal of sufficient non-protein constituents from whey so that the finished product contains not less than 90% protein on an air-dry basis. WPI192 is an agglomerated version of WPI190.
Powder Physicochemical Properties
Considering that in a very simplistic sense powder flow dynamics of non-cohesive is affected by powder properties as represented by the relationship:
Some physical and chemical properties of the powders were measured to provide an understanding of the effect of their variation on powder delivery through a feeder system. Property measurements were made in triplicate except for the bulk densities, which were measured from eight independent samples.
Moisture and Fat Content
Moisture and fat are chemical components of powders and granular materials that can cause cohesion between powder particles and are therefore related to flow behavior. Both these powder compositional components were determined using AOAC standard methods [Citation16]. Moisture content was determined by drying under vacuum for 4 hr at 102°C. Fat content was determined by first placing a 1-g sample in an Erlenmeyer flask and adding 1 mL of sulfuric acid and 4 mL of water. The contents were then mixed gently. After 60 min., the contents of the flask were transferred to a 60 mL separatory funnel using 25 mL of dichloromethane:methanol solution (1:1). After another 15 min., the bottom layer, which contains the lipid, was drained into a weighing pan and the solvent evaporated. The amount of fat was then calculated as a percent of the original sample weight.
Density Determination
Both loose and tap bulk density of the test materials were determined. The loose bulk density of all test materials was determined by dividing the weight of powder delivered freely by gravity into a 200-mL stainless steel cylinder by its volume.[Citation17] Tap bulk densities were calculated from the weight of powder contained in the cylinder after being hand tapped 100 times at roughly 60 taps per minute. The foregoing test cylinder had a removable extension that was carefully removed after the tapping, leaving a 100-mL volume for tap density calculation. In both cases excess powder was scraped from the top of the fixed volume container by sliding a wooden straight edge in a zigzag fashion across the container rim so that the material surface was flush with the container rim. Care was taken so as not to disturb or compact the settled powder. All bulk density measurements were made in triplicate. Compaction of the powders was described by the “Hausner ratio,” the ratio of the tap bulk density to the loose bulk density. The Hausner ratio is frequently used as a relative flowability index. Apparent particle density was determined with an air pycnometer (Model VM-100, Horiba Inc., Irvine, Calif., USA). Apparent particle density, simply referred to, as particle density in this report, is the mass of a particle divided by its volume, excluding only the open pores.
Particle Size Distribution
Particle size distribution (PSD) was determined for the test materials using an Accusizer Optical Particle Sizer Model 770 (Particle Sizing Systems, Santa Barbara, Calif., USA). Samples were fed using a vibratory feeder and number weighted as well as volume weighted measures of central tendency (mean, median, mode) for the differential particle size frequency distribution were determined. The volume weighted PSD emphasizes the large particles while the number weighted PSD emphasizes the fines. Results of the particle size analysis for each powder were also expressed graphically as an undersized cumulative frequency curve and, based on that, particle diameters representing the cutoff particle diameter for 25, 50, and 75% of the particles (D numbers), respectively, were determined.
Angle of Repose
Angle of repose was measured by the pouring method.[Citation18] Fayed and Otten[Citation19] defined angle of repose in general as “the angle formed between the horizontal plane and a slope line extending along the face of a heap formed by pouring material onto a horizontal surface.” Powder was allowed to flow through a conical funnel having a spout diameter of 20 mm. The angle of repose was calculated from the base angle formed by the heap of powder.[Citation13] According to Wouters and Geldart,[Citation20] the angle of repose can provide the process engineer quickly with valuable information. Therefore, since the tests can be performed in the plant, the angle of repose is taken as a predictor of possible flow difficulties later in industrial applications. Barbosa-Canovas et al.[Citation21] also forwarded that the angle of repose can be used as a rough flowability indicator. In fact, they noted that it is the actual measurement applied by food industry quality control in order to evaluate flowability.
Feeder Delivery
Tests on feeder delivery at different device settings were thus undertaken using a twin-screw volumetric feeder rated at 22.7 kg h−1 as the test platform. The feeder was equipped with twin concave profile 35 mm screws designed to deliver particles with a maximum diameter of 1.52 mm. The feeder hopper was loaded with 10 kg of material and, as best possible, a consistent head of material was maintained. Feeder delivery could be adjusted by varying its motor speed. The maximum motor speed setting for the test platform was 2000 rpm. Samples were collected at 100 rpm increments of motor speed between 100 rpm and 2000 rpm. After each speed adjustment the feeder was run for 5 min. to allow the flow rate to stabilize before throughput samples were collected for flow rate determination. All samples were collected over 2 min., except in the case of WPIs which were collected over 1 min. only and weights were recorded in grams. Powder delivery tests over the range of selected feeder settings were replicated three times. Using the final gear ratio of the test feeder, motor speed was converted to actual screw speed in order to obtain data analysis results that are generalized for similarly configured feeders. Screw speed was converted from rev min.−1 to rev s−1 so that the slope of feeder delivery-screw speed plot is in kg rev−1.
Statistical Analysis
Regression analysis was conducted using the REG procedure in SAS® v9.1.3 (SAS Institute, Inc., Cary, N.C., USA) to model the relationship between powder delivery and feeder setting. Regression analysis was undertaken to first determine the appropriateness of a linear model to represent variation in powder delivery with increasing feeder screw speed. Secondly, regression analysis was used to compare the delivery rate linear relationships among the 14 powders examined in the study and, more specifically, to determine if the linear slopes varied with the nature and type of material delivered. Differences in the linear models for the different test powders were further investigated through an analysis of variance using the MIXED procedure in SAS implementing orthogonal polynomial contrasts. Effects of powder properties on the linear slopes of the powder delivery-screw speed relationships were then explored though multiple regression.
RESULTS AND DISCUSSION
Powder Characterization
The powder physical and chemical properties were measured to provide an understanding of their delivery through a screw feeder and also to define the test materials.[Citation11] They were grouped as chemical properties (MC, fat: ), particle physical properties (particle density; D25; D50; D75 from a particle size cumulative frequency distribution; mean, median, and mode of a number weighted particle size differential frequency distribution; mean, median, and mode of a volume weighted particle size differential frequency distribution: and ), and bulk properties (loose bulk density, tap bulk density, Hausner ratio, and angle of repose: ). A quick survey of the literature showed these results to be comparable. For data analysis, the test powders were broadly grouped as cereal powders or dairy powders at the highest level of integration. Within cereal powders there were the starches, flours, and meals while within dairy powders there were the whey powders (WPIs, WPCs) and milk powders [dry whole whey (sweet whey), dry milk (NFDM)]. Graphical presentation of significant measured cereal or dairy powder properties was sequenced according to estimations of increasing particle size ().
Table 1 Fat and oil content of powders and meals
Table 2 Particle size (μm) statistical parameters from differential frequency distributions
Table 3 Particle density and particle size parameters from a cumulative particle size frequency distribution
Table 4 Test material bulk properties
Figure 1 Physicochemical properties of the different food powder types tested.
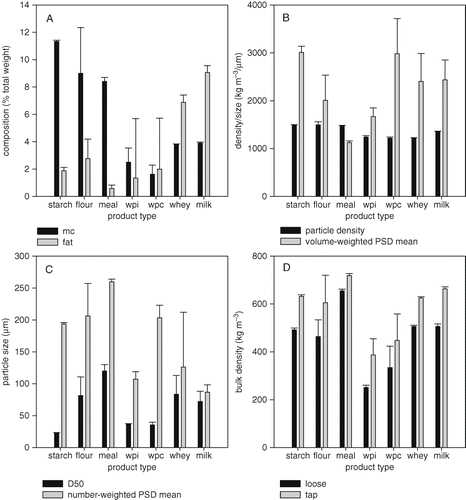
The cereal powders (cornstarch, cereal flours, and corn meal) were higher in moisture followed in turn by dry milk and sweet whey then whey protein powders (concentrates and isolates). With moisture content levels greater than 8%, the cereal powders were relatively wetter with respect to the dairy powders with moistures less than 4%. Sweet whey and NFDM were distinctly higher in fat content than all other product types.
Particle density and particle size relate to give mass of the powder. These measurements are shown in . Interestingly, the particle densities shown in of product types within the broad groupings are not markedly different despite the products differing in composition. The cereal powders had an average particle density of 1493.3 kg m−3 while milk and the whey powders had average particle densities of 1362.3 and 1227.8 kg m−3, respectively. The particle size results for dairy powders presented in and show a generally consistent increase in particle size from milk to whey to WPC with the results for WPI falling below the results for both WPC and whey. For the cereal powders, both the D50 and the number weighted PSD mean tended to increase from starch to meal while the opposite trend was observed for the volume weighted PSD mean. The latter result for cereal powders is a further indication that the cereal products tested had a fairly wider size distribution.
The salient information shown in is that there appears to be a consistent difference between loose and tap bulk density for all powder types (113.7–157.0 kg m−3) except for meal, which had a difference of 63.0 kg m−3.
Powder Delivery Rate
Delivery rates for the different tested powders through a twin-screw feeder over progressive incremental feeder settings (feeder motor speed) are shown in in terms of feeder screw speed. There was linear relationship between powder delivery by the twin-screw feeder and screw speed with the flow rate varying with the material conveyed. These two observations were confirmed statistically through the advanced regression techniques: lack of fit (P < 0.001) and dummy regression (P < 0.001), respectively. The linear relationship is consistent with all other studies[Citation22] especially for well designed devices with excellent metering characteristics. Thus, powder delivery by a twin-screw feeder can be represented by the relationship:
Figure 2 Powder delivery of different food powders at increasing screw speeds twin-.
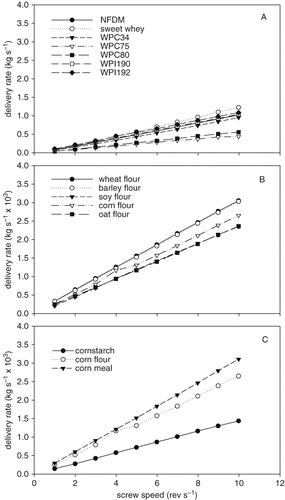
where screw speed is the actual angular velocity of the feeder screws at a given feeder setting and the slope b depends on the material delivered. Linear regression parameters relating feed rate to screw speed for each of the test powders are listed in . The results presented show that the y-intercept can essentially be taken as zero (0). Feeder setting, which in most practical situations is drive motor speed, is an operational variable that the operator can adjust in modern feeders; hence an analysis involving feeder setting can be more readily implemented. Such an analysis was presented by Pordesimo et al.[Citation23]
Table 5 Powder delivery-screw speed linear regression parameters
A fundamental issue that needs to be addressed is how to directly integrate material properties into this relationship or, at least, develop an algorithm to account for powder property effects. To do this, it would have been necessary to measure powder delivery at increasing feeder settings and then compare that to the theoretical volumetric capacity of the feeder based on its dimension/specifications and the assumed plug flow delivery of an incompressible powder. Such a study would have isolated the effect of material type on delivery rate. However, considering that core diameters, screw diameters, and screw pitch interact intimately with such material properties as coefficient of friction on the screw and housing material, calculation of theoretical capacity is not simplistic. As a first step, it would have involved specifying some kind of “ideal” powder or reference material. In this regard, Rautenbach and Schumacher[Citation22] noted that although screw feeders have been employed for many years in industry, dependable, theory-based design equations for calculation of delivery and power consumption do not exist. A survey of the scientific literature on twin-screw extruders—which are operationally analogous to twin-screw feeders—revealed no closed-form, theory-based equations for material delivery that could be adapted. Actually, simulation and modeling have been the principal methods used to develop an understanding of transport phenomena in twin-screw extruders, but these require long term studies and complex computation methods.[Citation24,Citation25] Twin-screw extruder geometry as well as material-material and material-machine interactions within the extruder are so complex that even in the synthetic polymer field the working of twin-screw extruders is not fully understood.[Citation24] For these reasons, the study was limited to be purely experimental in nature similar to the earlier work of Burkhardt[Citation26] with screw conveyors.
Material Influences on Powder Delivery
Trend analysis using orthogonal polynomial contrasts indicated that the delivery rate of cereal powders by the twin-screw feeder was greater than the delivery of milk powders (P < 0.001) over the feeder settings. Among dairy powders, the linear regression relationship between delivery rate and feeder setting was different among NFDM, sweet whey, WPC, and WPI (P < 0.001). Among cereal powders, the linear regression relationship between delivery rate and feeder setting was different among starches, flours, and meals (P < 0.001). This result further demonstrates that the nature of the food powders affects delivery rates.
Sixteen physicochemical properties were measured to characterize the powders and to understand their mechanical flow rate. Multiple regression was used to determine which of the measured properties had greater effects on the measured delivery rates. Specifically, the relationship between powder properties and the slopes of the linear equations relating delivery rate for each powder at different screw speeds was investigated using the RSQUARE method. The RSQUARE method finds subsets of independent variables that best predict a dependent variable by linear regression in the given sample. The subset models selected by the RSQUARE method are optimal in terms of R-square for the given sample.[Citation27] A 3-variable model involving particle density (ρp), D50, and the mode of the volume weighted PSD (MO V ) had an R-square of 93.86%. The change in the R-square from a 3-variable model to a 4-variable model with mean particle size from a number weighted PSD as an added variable was only 1.7%, so the 3-variable model was deemed the better alternative expressing the observed trends in screw feeder-delivery rate trends because of simplicity. Therefore, in this study, among the powder properties measured, particle density and particle size adequately accounted for the influence of material differences on powder delivery by a screw feeder:
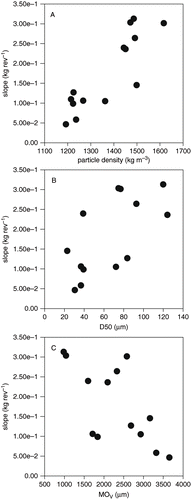
It is illustrated in that this equation predicts the slopes of the twin-screw feeder delivery curves for the different test materials () quite well. The multiple regression results also revealed that particle density alone accounted for 74.4% of the variation in the linear regression slopes while D50 and the mode of a volume weighted PSD individually accounted for 43.0% and 44.6% of the variability, respectively. The nature of the relationship between these properties and the linear slopes is shown in the scatter plots of . There appears to be a direct relationship between the regression slopes and particle density, but an inverse relationship with the mean of the volume weighted PSD. These two particle properties affect space filling. For a given particle density, coarse particles occupy more space while fine particles tend to be more dense[Citation28]. Considering that a screw feeder essentially delivers a fixed volume of material, it logically follows that a denser granular mass will result in a higher delivery rate expressed on mass per unit time basis. Although bulk density actually accounts for these two particle properties together, it did not significantly contribute to explaining the differences in powder delivery by the twin-screw feeder according to the multiple regression analysis (3.9%). It is possible then that there were errors in measuring bulk density. Bulk density measurement required much more manual manipulation to accomplish than the instrumented measurements of specific particle properties. In consequence, bulk density measurement is likely to be much more prone to human error, which was also a statement by Wong[Citation29] in his study characterizing powders.
Figure 3 Correlation between measured and predicted slopes of the linear powder delivery curves.
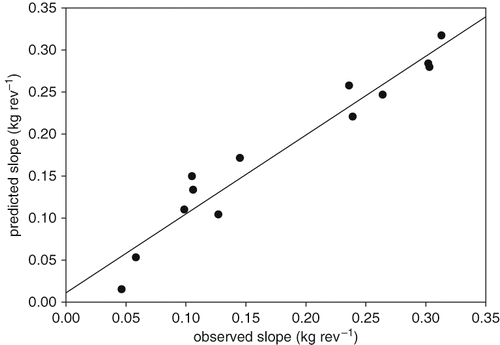
Figure 4 Relationship of particle density and particle size to the linear slopes of the powder delivery-screw speed relationships.
Material influences on powder delivery by the twin-screw feeder can be accounted as component terms in the prediction of the slope (EquationEq. 3). Having measured the three influential powder particle properties, the slope of the linear relationship of powder delivery to the twin-screw speed (EquationEq. 2) can be calculated using EquationEq. (3). Screw speed to give the desired delivery rate for a process can then be simply calculated by back substitution into EquationEq. (2). The feeder setting (motor speed) for a particular device can be later calculated from screw speed using the feeder gearing specifications. The results are valuable as a reference basis for equipment selection or adjustment of equipment operational settings by engineers and technicians, but are limited in addressing delivery of pure powders only and not mixtures.
As shown in and confirmed by trend analysis within the analysis of variance, there was no difference in the powder deliver-feeder setting relationships between barley and wheat flour and between oat flour and soy flour. These were comparisons set a priori based on the compositional makeup of these flours resulting from how and from what they were produced. Both wheat and barley flour are whole flours while oat and soy flour are produced from what remains of the grain after the removal of the hull. Scanning through the particle density measurements and particle size parameters, this finding appears to be more in line with the general trends observed for the product type groupings. For instance, barley and wheat flours had particle densities of 1616.7 and 1472.0 m−3, respectively, compared to the relatively lower 1450.7 kg m−3 for oat flour and 1443.3 kg m−3 for soy flour. D75 for barley flour was 191.2 μm compared to 171.4 μm for wheat flour while the D75 for oat flour and soy flour were higher at 393.8 μm and 203.0 μm, respectively. There was also a close comparison among the bulk density measurements for these product pairs ().
CONCLUSIONS
For well-designed devices with excellent metering characteristics, like the test platform used, this study reaffirms that there is a direct proportionality between delivery rates for different non-consolidated, non-cohesive powders over progressive increments of feeder screw speed. In this study, there was a clear linearity between powder deliveries by the twin-screw feeder over its entire operating range with the rate varying with the material delivered. Out of the 16 powder physicochemical properties measured, apparent particle density and particle size represented by both D50 and the mode of the volume weighted PSD accounted for the difference in the linear slopes of the delivery rate-screw speed relationships. Effects of these powder properties on delivery by the twin-screw feeder can be accounted for as component terms in the prediction of the slope of the delivery rate-screw speed linear relationship (EquationEq. 3).
ACKNOWLEDGMENTS
The advice and assistance of Dr. John Philips, USDA-ARS-ERRC, on statistical analysis is gratefully appreciated.
Notes
Mention of trade names or commercial products is solely for the purpose of providing specific information and does not imply endorsement by the U.S. Department of Agriculture over others of similar nature not mentioned.
Related Research Data
REFERENCES
- Jvotsna , R. , Manohar , R.S. , Indrani , D. and Rao , G.V. 2007 . Effect of whey protein concentrate on the rheological and baking properties of eggless cake . Int. J. Food Prop. , 10 ( 3 ) : 599 – 606 .
- Sharif , K. and Butt , M.S. 2006 . Preparation of fiber and mineral pan bread by using defatted rice bran . Int. J. Food Prop. , 9 ( 4 ) : 623 – 636 .
- Onwulata , C.I. , Konstance , R.P. , Smith , P.W. and Holsinger , V.H. 2001 . Incorporation of whey products in extruded corn, potato or rice snacks . Food Res. Int. , 34 : 679 – 687 .
- Onwulata , C.I. , Konstance , R.P. , Smith , P.W. and Holsinger , V.H. 2001 . Co-extrusion of dietary fiber and milk proteins in expanded corn products . Lebensm. -Wiss. Technol. , 34 : 424 – 429 .
- Singh , R.K. , Nielsen , S.S. , Chambers , J.V. , Martinez-Serna , M. and Villota , R. 1991 . Selected characteristic of extruded blends of milk protein raffinate of nonfat dry milk with corn flour . J. Food Proc. and Preserv. , 15 : 285 – 302 .
- Onwulata , C.I. , Konstance , R.P. , Smith , P.W. and Holsinger , V.H. 1998 . Physical properties of extruded products as affected by cheese whey . J. Food Sci. , 63 ( 5 ) : 814 – 818 .
- Matthey , F.P. and Hanna , M.A. 1997 . Physical and functional properties of twin-screw extruded whey protein concentrate-corn starch blends. Lebens. -Wiss . Technol. , 30 ( 4 ) : 359 – 366 .
- American Dairy Products Institute . 2005 . Dairy Products: Utilization and Production Trends 2004 , Elmhurst, IL : American Dairy Products Institute .
- Marinelli , J. 1996 . Choosing a feeder that works in unison with your bin. Powder . Bulk Eng. , 10 ( 12 ) : 43 – 57 .
- O'Donnell , J.A. and O'Donnell , C.D. 2006 . Building better foods and supplements . Prepared Foods , 175 ( 7 ) NS3–NS4,NS6, NS8,NS10–NS11
- Teunou , E. , Fitzpatrick , J.J. and Synnott , E.C. 1999 . Characterization of food powder flowability . J. Food Eng. , 39 : 31 – 37 .
- Teunou , E. and Fitzpatrick , J.J. 1999 . Effect of relative humidity and temperature on food powder flowability . J. Food Eng. , 42 : 109 – 116 .
- Sjollema , A. 1963 . Some investigations on the free-flowing properties and porosity of milk powders . Neth. Milk Dairy J. , 17 ( 3 ) : 245 – 259 .
- Peleg , M. , Mannheim , C.H. and Passy , N. 1973 . Flow properties of some food powders . J. Food Sci. , 38 ( 6 ) : 959 – 964 .
- Hoffmann , A.C. , Finkers , H.J. and Seegers , J.A. 1996 . Relationship between particle properties and bulk behaviour for some industrial powders . Part. Part. Syst, Charact. , 13 : 354 – 361 .
- Association of Official Analytical Chemists . 2000 . Official Methods of Analysis , 14th , Washington, D.C : AOAC .
- Svarovsky , L. 1987 . Powder Testing Guide: Methods of Measuring the Physical Properties of Bulk Powders , London : Elsevier Applied Science .
- Teunou , E. , Vasseur , J. and Krawczyk , M. 1995 . Measurement and interpretation of bulk solids angle of repose for industrial process design . Powder Handling Process. , 7 ( 3 ) : 21 – 27 .
- Fayed , M.E. and Otten , L. 1984 . Handbook of Powder Science and Technology , New York : Van Nostrand Reinhold Company Inc .
- Wouters , I.M.F. and Geldart , D. 1996 . Characterising semi-cohesive powders using angle of repose . Part. Part. Syst. Charact. , 13 : 254 – 259 .
- Barbosa-Canovas , G.V. , Ortega-Rivas , E. , Juliano , P. and Yan , H. 2005 . Food Powders: Physical Properties, Processing, and Functionality , New York : Kluwer Academic/Plenum Publishers .
- Rautenbach , R. and Schumacher , W. 1987 . Theoretical and experimental analysis of screw feeders . Bulk Solids Handling , 7 ( 5 ) : 675 – 680 .
- Pordesimo , L.O. , Onwulata , C.I. , Carvalho , C.I. and C.W.P . 2007 . Effect of food powder physico-chemical properties on delivery through a feeder system , St. Joseph, Mich : Paper No. 076189.; ASABE .
- Tayeb , J. , Della Valle , G. , Barres , C. and Vergnes , B. 1992 . “ Simulation of transport phenomena in twin-screw extruders ” . In Food Extrusion Science and Technology , Edited by: Kokini , J.L. , Ho , C. and Karwe , M.V. New York : Marcel Dekker Inc .
- Sastrohartono , T. , Karwe , M.V. , Jaluria , Y. and Kwon , T.H. 1992 . “ Numerical simulation of fluid flow and heat transfer in a twin-screw extruder ” . In Food Extrusion Science and Technology , Edited by: Kokini , J.L. , Ho , C. and Karwe , M.V. New York : Marcel Dekker Inc .
- Burkhardt , G.J. 1967 . Effect of pitch, radial clearance, hopper exposure, and head on performance of screw feeders . Trans. ASAE , 10 : 685 – 690 .
- SAS Institute Inc . 2004 . SAS® v9.1.3 (2002-2004) , Cary, NC : SAS Institute, Inc .
- Barbosa-Canovas , G.V. , Malave-Lopez , J. and Peleg , M. 1987 . Density and compressibility of selected food powder mixtures . J. Food Process Eng. , 10 : 1 – 19 .
- Wong , A.C. 2002 . Use of angle of repose and bulk densities for powder characterization and the prediction of minimum fluidization and minimum bubbling velocities . Chem. Eng. Sci. , 57 : 2635 – 2640 .