
Abstract
Dough expansion during fermentation is caused by CO2 production by yeast, and its transfer from liquid state in the dough liquor to gaseous phase in the gas cells. The liquid-gas equilibrium is controlled by the solubility of CO2 in the dough and by the Henry coefficient. The solubility of CO2 in bread dough was measured for different temperatures with a specific device based on the evolution of the pressure during fermentation at constant volume. The measurements range from 15 to 40°C. Data obtained was extrapolated to 0 and 50°C. Values were found between 1.6 × 10⁻⁵ and 5 × 10⁻⁶ g CO2 kPa−1 g−1 LPD, at 0 and 50°C, respectively (LPD: Liquid Phase of Dough).
INTRODUCTION
The solubility of carbon dioxide (CO2) represents the total amount of carbonate species that can be dissolved in a solution.[Citation1] Two species of CO2 must be considered: aqueous CO2 (aq) which is a molecular form of dissolved CO2, and carbonic acid H2CO3 resulting on the dissociation of CO2 (Eq. 1).
However, the concentration of these species remains negligible in comparison with the total concentration of carbonated species in solution. Near the neutrality, the concentration in can be done using solubility measurements with Eq. (4) Where
is the total amount of carbonate species that can be dissolved in the solution, and
is the apparent constant of the dissociation of CO2 as presented in Eq. (2).
depends on the temperature T, the pressure P and the ionic power of the solution I. The dissociation as presented in Eq. (3) has a negligible role. Many authors studied the solubility of CO2 in water. presents the main studies on the subject. shows almost all studies on solubility of CO2 conducted at elevated pressures. CO2 solubility in NaCl solutions was extensively investigated in broad pressure and temperature ranges. shows experimental studies in literature on the solubility of CO2 in NaCl solutions. The higher the NaCl concentration, the lower the CO2 solubility.[Citation1] The presence of NaCl yields in a decrease of the partial pressure of water and results in a lower water vapor pressure in the gas phase.
TABLE 2 Experimental surveys carried out on aqueous solubility of CO2 in NaCl solutions[Citation1]
In an aqueous solution, the apparent CO2 concentration undergoes two successive dissociations (Eqs. 2 and 3). Their dissociations constants are given in Eqs. (5) and (6).
Patterson et al.[Citation31,Citation32] measured these constants in NaCl solution in a range of concentration from 0 to 5 mol L−1 and in a range of temperature from 0 to 300°C under variable total pressure from (water saturation pressure) to
. They used their measurements and data from literature for pure water and NaCl solutions (for
,[Citation23,Citation33–Citation35] for
.[Citation36–Citation38] Portier[Citation1] used these results and found the following equations by least square method:
Chiotellis et al.[Citation39–Citation40] showed the effect of temperature on the dissolved CO2 concentration in the liquid phase of bread dough. Bloksma[Citation41] suggested that in the first steps of fermentation, most of the gas produced is dissolved in the liquid phase, whereas the gas penetration speed is low. The gas production rate measured by Bloksma was 2.5 × 10⁻⁵ kmol s−1 m−3 LPD (m−3 Liquid Phase of Dough) for 2% of yeast at 27°C. At the same temperature, the saturation concentration of CO2 in the liquid phase is 4.3 × 10⁻² kmol m−3 LPD. It was estimated that the saturation is reached after 50 min of fermentation. Bloksma took into account the variations in the solubility of CO2 and water vapor pressure with temperature. The partial pressure of CO2 in gaseous phase is related to concentration in the dough by Henry’s law as proposed in Eq. (9), where XC is the concentration of CO2 in the aqueous dough and KH is Henry’s constant.
Solubility depends on temperature.[Citation42] The solubility of CO2 decreases when temperature increases; thus KH increases with temperature. It was assumed that the variation of KH with temperature follows the Arrhenius relationship (Eq. 10) as proposed by Fan et al.[Citation43]
In Eq. (10) ΔHc is the heat of solution of CO2 in dough, and R the universal gas constant. KH0 is the Henry’s law constant at the initial temperature T0. Hibberd and Parker[Citation44] have reported that the Henry’s law constant KH in a fermenting dough is 7.03 × 10⁷ Pa kg dough/kg CO2 at a temperature of 27°C. Beyond 27°C, Fan et al.[Citation43] assumed that the temperature dependence of KH in aqueous dough behaves in the same way as it did in water. They estimated the heat of solution of CO2 from the literature data on the solubility of CO2 in water;[Citation45] the value was 1.94 × 10⁴ J mol−1.[Citation43]
Carbon dioxide solubility is an important parameter needed for the understanding and the modelling of the fermentation of bread dough. During shaping and moulding, high pressure is applied on dough and an amount of CO2 is lost from the bubbles through the solution while the pressure is decreasing. Thus, moulding can not eliminate all gas and it remains a significant gas volume in the dough. It is also of interest to know the solubility of CO2 at baking temperature. During the baking step, temperature rises resulting in a vaporisation of the CO2 dissolved in the liquid phase of the dough. At the same time, increases quickly and the gas bubbles volume increases.[Citation41–Citation46] Fan et al.[Citation43] concluded that the solubility of CO2 in aqueous dough during baking is responsible for the early oven rise of dough whereas vapor makes a significant contribution to the later expansion. Alcoholic compounds produced during fermentation remain dissolved in the dough at lower temperature. They also contribute to the oven rise during baking. Finally, the crumb porosity can reach 0.79 and the crust porosity 0.71.[Citation46]
The objective of this work was to measure the solubility of CO2 in bread dough over a large temperature domain. One constrains lies in the fact that yeast activity is reduced at lower temperature and becomes very high at higher temperature. Therefore, experiments were carried out in a limited domain and results were extrapolated to a larger temperature domain using the Arrhenius model.
THEORY
Theoretical development proposed by Hibberd and Parker has been used to determine the solubility of CO2.[Citation44] Let’s consider unit mass of dough of total volume V, of which Vd is the volume of the continuous dough phase. The volume of the gas is therefore V – Vd. The gas in the bubbles is a mixture of carbon dioxide generated during fermentation, components of air entrained during mixing, and water vapor. The gas is considered to be in equilibrium with the gas dissolved in the continuous dough phase.
From the perfect gas law, the mass of CO2 in the gaseous phase, is given in terms of its partial pressure, Pc by Eq. (11),
where Mc is the molecular weight of CO2 in g mol−1. Assuming that the solubility of CO2 in the continuous dough phase follows Henry’s law, the mass of carbon dioxide dissolved in the dough, is given by Eq. (12):
where Kc is the solubility constant of the carbon dioxide in mass per unit mass of dough per unit pressure. The total mass, mc, of CO2 in unit mass of dough is therefore,
Vc may be considered as the equivalent volume of the carbon dioxide dissolved in unit mass of dough. Similar equations can be derived for each of the components of the entrapped air. During the first steps of fermentation, the dough becomes saturated in CO2. Then, the rate of production of CO2 will correspond either to an increase of the pressure in the gas cell in the case of constant volume or to an increase of volume in the case of constant pressure. The experimental setup was designed to perform experiments at constant volume. The time derivative of Eq. (14) gives:
The partial pressure of the carbon dioxide is equal to P, the total pressure in the bubbles decreased by the partial pressure of the dry air Pa and by the partial pressure of the water vapor Pv:
The bubbles volume and the quantity of dry air and of water vapor are constant, and thus the partial pressures of the dry air and of the water vapor, so that
The pressure in the bubbles P is the sum of the atmospheric pressure Patm, of the external pressure Pe exerted by the experimental device, and of the pressure exerted by the dough on the bubbles, Pd.
The atmospheric pressure is constant, and the pressure exerted by the dough changes slowly so that
Thus,
During proofing, is constant during a long time. If the volume V is changed from time to time (Vd remains constant), and that the pressure Pe is logged, as many points
are obtained than values of volume are chosen. Then Vc is got from the slope of the straight line define by Eq. (22), and Kc is deduced then from Eq. (15).
MATERIALS AND METHODS
Doughs were prepared base on the recipe proposed in . Ingredients were mixed in a Diosna SP24 laboratory mixer with 2 min slow speed and 7 min fast speed. Flour properties are indicated in (crop 2007 – Moulin Soufflet, Pornic, France). The dough was placed in a cylindrical flask (2.5-cm inner diameter) with a mobile piston. The piston was contacted on a force sensor to log the pressure that develops during fermentation in function of time.
TABLE 3 Dough formula
TABLE 4 Analysis results for the flour (Moulin Soufflet, Pornic, France)
The sample was 5 g of dough. It was placed in the cylinder which walls were previously lubricated with a film of sun flower oil. The installation of the sample must be done carefully to avoid the trapping of air between the dough and the walls of the cylinder. The piston is then pressed down firmly, forcing the air above the dough to escape through the upper exhaust hole ().
FIGURE 1 Schematic diagram of instrument used to make pressure-volume measurements on dough.
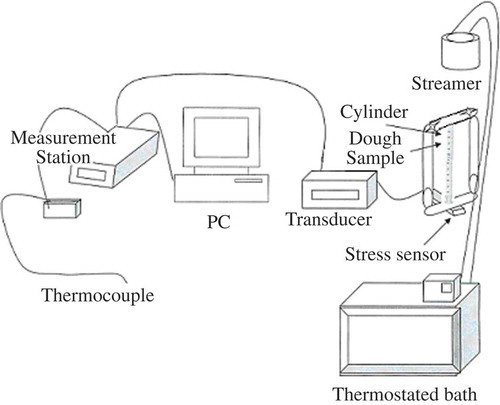
The cylinder containing the dough was then placed between a rigid plate and the force sensor. The distance between the plate and the sensor was fixed to a mechanical setup made of two plateau and two screws. During the experiment, volume of the dough sample varied by screwing the nuts more or less. Pressure rise of the dough was monitored for period of around 20 to 30 min. The nuts were unscrewed to reduce the pressure to zero resulting in an expansion of the dough. The dough is compressed again but to a volume greater than the previous one. A novel pressure rise was monitored with a new porosity of the dough. During an experiment, the pressure variation was recorded for 4 different volumes. With a least square method, Vc and its standard deviation are deduced from Eq. (12). Then with Eq. (12), Kc and its standard deviation are calculated.
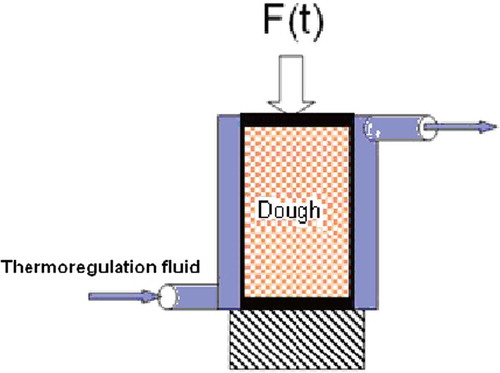
The temperature of the sample was controlled by circulating water from a thermostated bath through the jacket surrounding the cylinder (). The volume of the sample, as placed in the cylinder, includes gas bubbles entrained during mixing. Knowing the density of the degassed dough it was possible to determine the volume of gas from the effective density of a sample determined at the time of installation in the cylinder. The total volume of gas at any stage of fermentation was taken as the sum of the volume of these bubbles entrained during mixing and the change in volume as calculated from the change in height of the cylinder.
FIGURE 2 Scheme of the cell used to make the fermentation at constant volume.
RESULTS AND DISCUSSION
shows the evolution of pressure for different volumes Vi of the dough. Pressure increases in a uniform way in the first 30 min. The pressure increase for V1, V2, V3 and V4 is attributed to carbon dioxide, which diffuses from the liquid phase of the dough to bubbles. On , for selected temperatures, are placed the points , and the corresponding regression lines. The absolute values of the different slopes correspond to the equivalent volumes Vc (ml of CO2 g−1 of dough). Vc decreases with temperature because of the decrease of CO2 solubility. As
, one can deduce from values of Vc the values of Kc. Data of Kc in function of 1/T are shown in . Assuming that the solubility is following an Arrhenius model, a logarithm function should fit data obtained and presented in . This was indeed the case, as shown in . Equation (23) was obtained.
FIGURE 3 External pressure evolution for different dough density at 20°C for 30 g of dough.
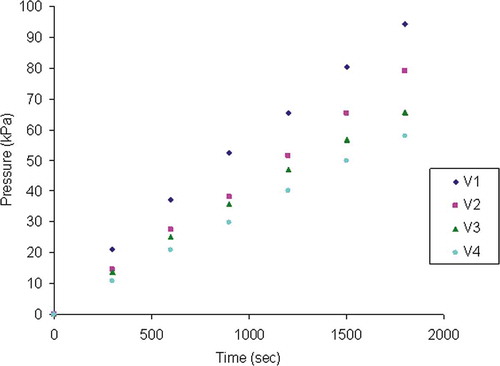
FIGURE 4 Evolution of vs.
during fermentation at constant volume for selected temperatures.
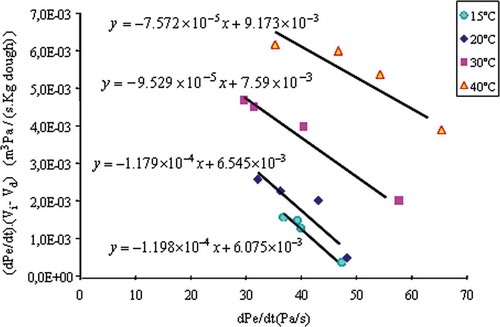
FIGURE 5 Experimental values and Arrhenius law modelling for Solubility constant of CO2 in bread dough.
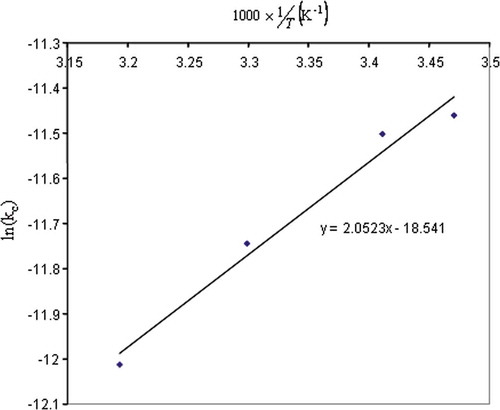
FIGURE 6 Solubility (Kc) of CO2 in bread dough using the Arrhenius model presented in Eq. (23) for temperature between 0 and 50°C.
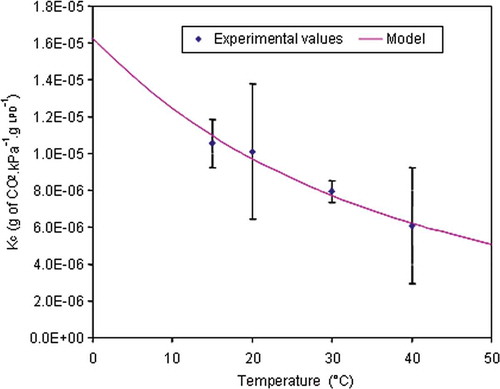
The values of solubility obtained are expressed as g of Liquid Phase of Dough (g LPD). Values were between 1.6 × 10⁻⁵ and 5 × 10⁻⁶ g CO2 kPa−1 g−1 LPD, at 0 and 50°C, respectively. The values of the solubility were expressed per g of liquid phase of dough rather than per g of dough as did by Hibberd and Parker,[Citation44] because the solubility of the CO2 depends principally of the liquid phase, and because the water content in bread dough vary with the manufacturer.[Citation47]
Hibberd and Parker found a solubility constant value equal to 1.45 × 10⁻⁵ g CO2 kPa−1 g−1 dough at 27°C.[Citation44] In the same units the value found in this work is equal to 1.64 × 10⁻⁶ g CO2 kPa−1 g−1 dough at 30°C, i.e., a ratio of about 10. The difference may be explained by the fact that data proposed by Hibberd on dough recipe and flour moisture were not very accurate. Also, the recipe they used contained shortening. Shortening may affect the size distribution of gas cells in the dough, which should be more numerous and smaller than without any shortening. Also, the water content of the dough of Hibberd and Parker is unknown, and it can be a major cause of difference. Another point is that considering the solubility per gram of liquid phase of dough is a first approach. Ideally, the solubility should be calculated per gram of free water (freezable water) in the dough, even though the fact that CO2 dissolved only in the free water phase may be discussed. In our case, specific experiments showed that for the recipe used, the amount of free water obtained by calorimetry was 60.5% (results not shown). Applying this factor to our results would make that the solubility at 30°C would be 2.76 × 10⁻⁶ g CO2 kPa−1 g−1 free water vs. 1.67 × 10⁻⁶ g CO2 kPa−1 g−1 LPD. In addition, one can observe that our data obtained at different temperatures show a great degree of coherence as expected by the Arrhenius model. No other explanation of observation can be proposed to explain the difference. There are very few data available in the literature to propose any further discussion on the results.
CONCLUSION
A method for measuring the CO2 solubility in bread dough during fermentation was developed. The solubility of CO2 was determined in the bread dough for temperatures between 15 and 35°C and data have been extrapolated from 0 to 50°C using an Arrhenius model. The model that has been obtained can be very useful to study the behaviour of bread dough in the case of fermentation at different temperature values or in the case of dough ripening at temperature for which the yeast is no more active. These results give a new insight in dough fermentation. Further studies such as studying the impact of recipe, degree of starch damage, dough hydration could be very useful in better understanding of the interaction between the dough liquor and the solubilisation of CO2 in this very specific liquid domain.
ACKNOWLEDGMENTS
Thanks to Christophe Couedel and Luc Guihard for technical support.
FUNDING
This study has been carried out with financial support from the Commission of the European Communities, FP6, Thematic Area “Food quality and safety,” FOOD-2006-36302 EU-FRESHBAKE. It does not necessarily reflect its views and in no way anticipates the Commission’s future policy in this area. Partial financial support has also been obtained from AISQAL national project (Région Pays de Loire).
NOMENCLATURE
| I | = | Ionic strength (mol L−1) |
| Kc | = | Solubility constant of carbon dioxide (g CO2 kPa−1 g−1 LPD) |
| KH | = | Henry’s law constant (Pa kg dough/kg CO2) |
| = | Dissociation constant for the first dissociation of CO2 | |
| = | Dissociation constant for the second dissociation of CO2 | |
| m | = | Mass (g) |
| M | = | Molar mass (g mol−1) |
| P | = | Pressure (Pa) |
| = | Saturation pressure of water (Pa) | |
| = | Total concentration of CO2 at saturation (mol L−1) | |
| R | = | Perfect gas constant = 8.314 J mol−1 K−1 |
| t | = | Time (s) |
| T | = | Temperature (K) |
| V | = | Volume (ml g−1 of dough) |
| ΔHc | = | Heat of solution of CO2 (J mol−1) |
| [] | = | Molarity (mol L−1) |
| Subscripts | = | |
| a | = | Air |
| atm | = | Atmosphere |
| c | = | Carbon dioxide |
| d | = | Dough |
| e | = | External |
| v | = | Vapor |
| 0 | = | Initial |
| = | Number of volume values during a proofing experiment |
Additional information
Funding
REFERENCES
- Portier, S. Solubilité de CO2 dans les saumures des bassins sédimentaires. Application au stockage de CO2 (gaz à effet de serre); PhD Thesis, Université Louis Pasteur: Strasbourg I, France, 2005.
- Usdowski, E. Reactions and equilibria in the systems CO2-H2O and CaCO3-CO2-H2O (0 – 50°C). A review. Neues Jahrbuch für Mineralogie Abhandlungen 1982, 144, 148–171.
- Weiss, R.F. Carbon dioxide in water and seawater: the solubility of a non-ideal gas. Marine Chemistry 1974, 2, 203–215.
- De Hemptinne, J.-C.; Dhima, A.; Shakir, S. In The Henry constant for 20 hydrocarbons, CO2 and H2S in water as a function of pressure and temperature. Proceedings of the 14th Symposium on Thermophysical Properties, Boulder, CO, June 2000, 25–30.
- Wiebe, R.; Gaddy, V.L. The solubility in water of carbon dioxide at 50°, 75° and 100° at pressures to 700 atm. Journal of the American Chemical Society 1939, 61 (2), 315–318.
- Wiebe, R.; Gaddy, V.L. The solubility of carbon dioxide in water at various temperatures from 12 to 40° and at pressures to 500 atm. Journal of the American Chemical Society 1940, 62 (4), 815–817.
- Wiebe, R.; Gaddy, V.L. Vapor phase composition of carbon dioxide – water mixtures at various temperatures and at pressures to 700 atmospheres. Journal of the American Chemical Society 1941, 63 (2), 475–477.
- Prutton, C.F.; Savage, R.L. The solubility of carbon dioxide in calcium chloride-water solutions at 75, 100, 120 °C and high pressures. Journal of the American Chemical Society 1945, 67 (9), 1550–1554.
- Takenouchi, S.; Kennedy, G.C. The binary system H2O-CO2 at high temperatures and pressures. American Journal of Science 1964, 262 (9), 1055–1074.
- Tödheide, K.; Franck, E.U. Das Zweiphasengebiet und die kritische kurve im system kohlendioxid-wasser bis zu drucken von 3500 bar. Zeitschrift für Physikalische Chemie 1963, 37 (5–6), 387–401.
- King Jr., A.D.; Coan, C.R. Solubility of water in compressed carbon dioxide, nitrous oxide, and ethane: evidence for hydration of carbon dioxide and nitrous oxide in the gas phase. Journal of the American Chemical Society 1971, 93 (8), 1857–1862.
- Zawisza, A.; Malesinska, B. Solubility of carbon dioxide in liquid water and of water in gaseous carbon dioxide in the range 0.2-5 MPa and at temperatures up to 473. Journal of Chemical & Engineering Data 1981, 26 (4).
- Gillespie, C.; Wilson, G.M. Vapor-Liquid and Liquid-Liquid Equilibria: Water-Methane; Water-Carbon Dioxide; Water-Hydrogen Sulfide; Water-n-pentane; Water-Methane-n-pentane. Rapport GPA, RR48, Provo, UT. 1982.
- Gillespie, P.C.; Owens, J.L.; Wilson, G.M. Sour water equilibria extended to high temperatures and with inerts present. Proceedings of the AIChE Winter Meeting, Paper 34-b, Atlanta, Georgia, USA, 1984.
- Müller, G.; Bender, E.; Maurer, G. Das Dampf-Flüssigkeitsgleichgewicht des ternären Systems Ammoniak-Kohlendioxid-Wasser bei hohen Wassergehalten im Bereich zwischen 373 und 473 Kelvin. Berichte der Bunsengesellschaft für physikalische Chemie 1988, 92 (2), 148–160.
- Nighswander, J.A.; Kalogerakis, N.; Mehrotra, A.K. Solubilities of carbon dioxide in water and 1 wt. % sodium chloride solution at pressures up to 10 MPa and temperatures from 80 to 200 °C. Journal of Chemical & Engineering Data 1989, 34 (3), 355–360.
- Sako, T.; Sugeta, T.; Nakazawa, N.; Okubo, T.; Sako, M.; Taguchi, T.; Hiaki, T. Phase-equilibrium study of extraction and concentration of furfural produced in reactor using supercritical carbon dioxide. Journal of Chemical Engineering of Japan 1991, 24 (4), 449–455.
- King, M.B.; Mubarak, A.; Kim, J.D.; Bott, T.R. The mutual solubilities of water with supercritical and liquid carbon dioxides. The Journal of Supercritical Fluids 1992, 5 (4), 296–302.
- Zheng, D.-Q.; Guo, T.-M.; Knapp, H. Experimental and modeling studies on the solubility of CO2, CHC1F2, CHF3, C2H2F4 and C2H4F2 in water and aqueous NaCl solutions under low pressures. Fluid Phase Equilibria 1997, 129 (1–2), 197–209.
- Dhima, A.; de Hemptinne, J.-C.; Moracchini, G. Solubility of light hydrocarbons and their mixtures in pure water under high pressure. Fluid Phase Equilibria 1998, 145 (1), 129–150.
- Drummond, S.E. Boiling and mixing of Hydrothermal fluids: Chemical effects on mineral precipitation; PhD Thesis, Pennsylvania State University 1981.
- Ellis, A.J.; Golding, R.M. The solubility of carbon dioxide above 100 degrees C in water and in sodium chloride solutions. American Journal of Science 1963, 261, 47–60.
- Harned, H.S.; Davis, R. The ionization constant of carbonic acid in water and the solubility of carbon dioxide in water and aqueous salt solutions from 0°C to 50°C. Journal of the American Chemical Society 1943, 65, 2030–2037.
- Malinin, S.D.; Kurovskaya, N.A. The solubility of CO2 in chloride solutions at elevated temperatures and CO2 pressures. Geochemistry International 1975, 12, 199–201.
- Malinin, S.D.; Savalyeva, N.I. The solubility of CO2 in NaCl and CaCl2 solutions at 25, 50 and 75 °C under elevated CO2 pressures. Geokhimiya 1972, 6, 643–653.
- Markham, A.E.; Kobe, K.A. The solubility of carbon dioxide and nitrous oxide in aqueous salt solutions. Journal of the American Chemical Society 1941, 63 (2), 449–454.
- Rumpf, B.; Nicolaisen, H.; Öcal, C.; Maurer, G. Solubility of carbon dioxide in aqueous solutions of sodium chloride: Experimental results and correlation. Journal of Solution Chemistry 1994, 23 (3), 431–448.
- Onda, K.; Sada, E.; Kobayashi, T.; Kito, S.; Ito, K. Salting-out parameters of gas solubility in aqueous salt solutions. Journal of Chemical Engineering of Japan 1970, 3 (1), 18–24.
- Takenouchi, S.; Kennedy, G.C. The solubility of carbon dioxide in NaCl solutions at high temperatures and pressures. American Journal of Science 1965, 263 (5), 445–454.
- Yasunishi, A.; Yoshida, F. Solubility of carbon dioxide in aqueous electrolyte solutions. Journal of Chemical & Engineering Data 1979, 24 (1), 11–15.
- Patterson, C.S.; Busey, R.H.; Mesmer, R.E. Second ionization of carbonic acid in NaCl media to 250°C. Journal of Solution Chemistry 1984, 13, 647–661.
- Patterson, C.S.; Slocum, G.H.; Busey, R.H.; Mesmer, R.E. Carbonate equilibria in hydrothermal systems: first ionization of carbonic acid in NaCl media to 300°C. Geochimica et Cosmochimica Acta 1982, 46, 1653–1663.
- Ellis, A.J. The solubility of calcite in carbon dioxide solutions. American Journal of Science 1959, 257, 354–365.
- Harned, H.S.; Bonner, F.T. The first ionization of carbonic acid in aqueous solutions of sodium chloride. Journal of the American Chemical Society 1945, 67, 1026–1031.
- Read, A.J. The first ionization constant of carbonic acid from 25 to 250°C and to 2000 bar. Journal of Solution Chemistry 1975, 4, 53–70.
- Dyrssen, D.; Hansson, I. Ionic medium effect in seawater – A comparison of acidity constants of carbonic acid and boric acid in sodium chloride and synthetic seawater. Marine Chemistry 1972–1973, 1, 137–149.
- Peiper, J.C.; Pitzer, K.S. Thermodynamics of aqueous carbonate solutions including mixtures of sodium carbonate, bicarbonate, and chloride. Journal of Chemical Thermodynamics 1982, 14, 613–638.
- Thurmond, V.; Millero, F.J. Ionization of carbonic acid in sodium chloride solutions at 25°C. Journal of Solution Chemistry 1982, 11, 447–456.
- Chiotellis, E.; Campbell, G.M. Proving of bread dough I. Modelling the Evolution of the Bubble Size Distribution. Transactions of the Institution of Chemical Engineers 2003, 81 (C), 194–206.
- Chiotellis, E.; Campbell, G.M. Proving of bread dough II. Measurement of gas production and retention. Transactions of the Institution of Chemical Engineers 2003, 81(C), 206–216.
- Bloksma, A.H. Rheology of the bread making process. Cereal Foods World. 1990, 35, 228–236 and 959–960.
- Selomulyo, V.O.; Zhou, W. Frozen bread dough: Effects of freezing storage and dough improvers. Journal of Cereal Science 2007, 45, 1–17.
- Fan, J.; Mitchell, J.R.; Blanchard, J.M.V. A model for the oven rise of dough during baking. Journal of Food Engineering 1999, 41 (2): 69–77.
- Hibberd, G.E.; Parker, N.S. Gas pressure-volume-time relationships in fermenting doughs. I. Rate of production and solubility of carbon dioxide in dough. Cereal Chemistry 1976, 53 (3), 338–346.
- Loomis, A.G. In International Critical Tables of Numerical Data, Physics, Chemistry and Technology; Washburn, E.W.; Ed.; Mcgraw-Hill: New York, 1928; 260.
- Boukouvalas, C.J.; Krokida, M.K.; Maroulis, Z.B.; Marinos-Kouris, D. Density and porosity: literature data compilation for foodstuffs. International Journal of Food Properties 2006, 9 (4), 1532–2386.
- Farahnaky, A.; Majzoobi, M. Physicochemical properties of partbaked breads. International Journal of Food Properties 2008, 11 (1), 186–195.