
Abstract
A gluten index test was recently introduced as a quicker method to measure wheat processing quality in comparison with the classical instrumental methods, such as a mixograph and farinograph. It is also a criterion defining whether the gluten quality is weak, normal, or strong. The gluten index test has gained wide acceptance as a method of determining gluten strength and is used in international trade specifications. The innovation of this work was to: (a) collect published data regarding the values of gluten index and form a database; (b) investigate the impact of variables, such as genotype, glutenin, and gliadins subunits, the level of nitrogen fertilization, irrigation, the protein content of flour, damages on crop and addition of enzymes, on the value of the gluten index aiming the comprehension of their interaction; (c) establish a relationship between gluten index and the two predictor variables, nitrogen fertilization level and protein content. The results suggested that the above variables have a contrary effect on the value of the gluten index, even for the same treatment of definite wheat genotype, which leads us to the conclusion that additional variables must account for defining the gluten index value. Out of all interactions between the experimental variables and gluten index, only nitrogen fertilization level and protein content were found to be significant, having a power law nonlinear relationship.
INTRODUCTION
Wheat (Triticum spp.) is one of world’s major food crops with an annual world production for 2009 of about 681.9 million metric tons.[Citation1] Wheat products are used for human consumption in many forms, such as bread, pasta, couscous, and other baked foods. Wheat gluten is used as a thickener in sauces, soups, and sweets. Durum wheat (Triticum turgidum L. subsp. durum) is the commodity of choice for production of high-quality pasta and couscous, while the common (Triticum aestivum L. subsp. aestivum) wheat is used mostly for bakery products.[Citation2] The process of wheat milling (grooved steel rollers) separates or flakes off the starchy endosperm from the bran and the embryo while the starchy endosperm is cracked.[Citation3] The separation should ideally occur at the level of the endosperm/aleurone layer interface if aleurone, which is high in ash content, is to be excluded from the semolina. The semolina is then ground into flour.[Citation4] In some cases, the milling process includes the entire wheat kernel (whole meal).
Wheat contains a complex mixture of proteins that have a unique property of being able to form a viscoelastic dough when flour is mixed with water. When the starch and the water soluble proteins are washed out of a dough, the residual viscoelastic mass that remains contains mainly water insoluble protein fractions called “gluten.” The composition of the “gluten” fractions of the wheat grain is essential for industrial quality. In practice, the term “gluten” refers to the proteins, because they play a key role in determining the unique baking quality of wheat by conferring water absorption capacity, cohesivity, viscosity, and elasticity on dough. Gluten index (GI) is a criterion defining whether the gluten quality is weak (GI < 30%), normal (GI = 30–80%), or strong (GI > 80%).[Citation5] Wheat with similar protein contents can be classified according to GI values. In other words, GI has been correlated with protein strength variables.[Citation6,Citation7] The main method applied in the measurement of GI is the AACC Int. 38-12A or ICC Standard method 137-1.[Citation8] In this procedure, 10.0 g ± 0.01 g of flour or whole meal is weighed and put into the Glutomatic wash chamber with an 88 micron polyester sieve (84 micron for wheat meal). After dispersing and mixing with salt, the mixture is washed to remove the starch and other solubles from the sample. The residue remaining after washing is the wet gluten. In the next step during centrifugation, the gluten is forced through a sieve. The percentage of gluten remaining on the sieve is defined as the GI, which is an indication of gluten strength.
The aim of the present study is to (a) compile and organize published data, regarding the values of GI and form a database; (b) explore the effect of experimental variables, such as genotype, glutenin, and gliadins subunits, the level of nitrogen fertilization, irrigation, damage on crop, and addition of enzymes on retrieved GI values; and (c) propose a model that indicates a simplified correlation between GI and the level of crop N-fertilization and protein content of flour or semolina.
MATERIALS AND METHODS
Data
An extensive bibliography search was made of the most popular food engineering and food science journals during recent years. The selected data for GI were compiled into a database developed in Excel®. In particular, this database containing the existing experimental values of GI and associated variables, is of great importance for food industries and cereal research teams, since it can be used as an effective tool to perform quick estimations, approximate assessments, low risk modifications, and comparison of final product properties concerning foods, based on flour or semolina. The main experimental variables can be organized into two groups. The first group, which is associated with the wheat crop or agricultural practices, includes variables, such as location of wheat crop, cultivars or varieties of wheat, nitrogen or sulfur fertilization level, irrigation level in wheat crop, and bug or insect damage in wheat crop. The second group, which is associated with the gluten, includes variables, such as allelic variations of high or low molecular weight glutenin subunits, the presence of specific γ-gliadins, the glutenin/gliadin ratio, whole meal or dehulled flour, addition of enzymes in gluten, and storage time of flour and flour blends of various genotypes.
Principal Component Analysis
Due to the fact that a large number of related continuous variables have an effect on GI, the statistical technique, which reduces this number to a smaller number of principal component analyses (PCA), was used. This method has two main steps: (1) principle component or factor extraction determining the smallest number of components that can be used to best represent the interrelations among the set of variables and (2) component rotation and interpretation. Usually Oblimin rotation provides information about the degree of correlation between the components.
Data Fitting Procedure
A preliminary effort to establish a relationship between GI and any experimental variable showed that only N-fertilization level (kgN/ha) and protein content (%) have a significant statistical effect and a strong relationship. A set of about 113 observations () was appropriate in order to examine the degree at which GI is related with the N-fertilization level (NF) and protein content (PC), while no other experimental conditions have been applied.
TABLE 1 Data compiled from the eight studies used in the statistical analysis
The proposed model function, which relates the GI with NF and PC of flour, can be described from the following equation:
RESULTS AND DISCUSSION
Variables and Relationships
GI is directly linked to wheat’s physicochemical characteristics and, therefore, to its quality. A total of 91 articles were retrieved from science documents of recent years, which reported experimental values of GI. The selected data were compiled and organized into a database developed in Excel® (not shown), which contains about 2000 values of different experimental conditions about GI.
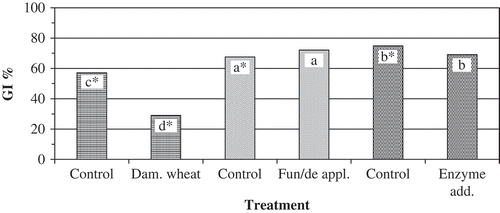
The moisture content (db) of wheat seeds ranged from about 120 g kg−1 to 160 g kg−1 for examined wheat seeds. demonstrates the minimum, maximum, and average values of GI for genotypes (including cultivars, varieties, market classes, landraces, breeding lines), which have been reported more than four times. The above data are the control values of each experiment. In conclusion, discarding “Hercules” genotype the rest of genotypes show a small spread of GI values. The small spread of GI values indicates that there is no strong relationship between genotype and region of experiment. The statistical results of three treatments are presented in . As we can see in the case of undamaged versus damaged wheat crops from bugs or fungi, the average GI value is decreased probably as a result of the damage on the genes that control the synthesis of prolamins. However, when a fungicide or insecticide is applied on the crop, there is no difference between GI values. Similar results on GI values are also observed when enzymes are added in wheat flours.
FIGURE 1 The minimum, maximum, and average values of GI for the most reported genotypes.
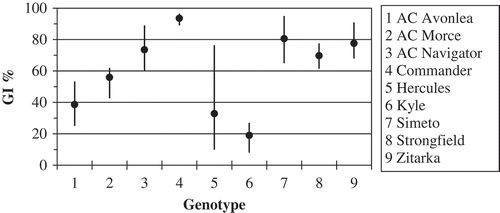
FIGURE 2 Statistical effects of three main variables versus control on GI value. *The same letter denotes a not statistically significant difference (p < 0.05). Dam. Wheat: Bug or insect damaged wheat; Fun/de appl.: fungicide application; Enzyme add.: Eenzyme addition.
shows the effects of the main variables from the retrieved data as a result of their statistical analysis. It can be seen in this table that most workers found a statistical significance between the genotype, year, and environment with the GI. No statistically significant difference was found for the overall flour protein content level and the value of GI. It was found that there was statistical significance between glutenin subunits and GI, whereas in some cases differences were found between gliadins subunits and GI.
TABLE 2 The statistical effects of the main variables on the value of GI as reported by authors
Preliminary Statistical Analysis
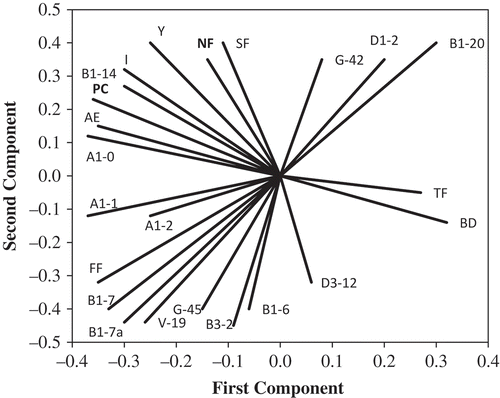
The underlying structure of the GI and the interrelationships among the variables () was explored using exploratory factor analysis (EFA). EFA was performed on the data (2000 values) using PASW Statistics® v. 18, after first confirming that the data was suitable for factor analysis. Principal component analysis (PCA) was used to extract the factors followed by oblique rotation of factors using Oblimin rotation. The number of factors to be retained was guided by two decision rules: (1) Kaiser’s criterion eigenvalues greater than 1 and (2) use of Horn’s parallel analysis. Parallel analysis is one of the most accurate approaches to estimating the number of components. The size of eigenvalues obtained from PCA are compared with those obtained from a randomly generated data set of the same size. Only factors with eigenvalues exceeding the values obtained from the corresponding random data set are retained for further investigation. Parallel analysis was conducted using the software named Monte Carlo PA.[Citation48] PCA revealed two eigenvalues exceeding 1, explaining 45.8% and 11.7% of the total variance, respectively. Furthermore, only these first two factors exceeded the criterion value obtained from parallel analysis. Following Oblimin rotation, the two factors showed a moderate intercorrelation (r = 0.36). Inspection of the pattern matrix () showed a relatively clear two-factor. The highest loadings on component 1 are items NF, PC, A1-2, and G-45. All of these components have a positive effect on GI value. The main items on component 2, BD and G-42, are negative effect items. The loading plot for the principal components for GI () shows that all the variables, which are located at right angles to each other, are independent of each other. NF is located almost perpendicular to FF, A1-1, and A1-2, indicating that NF and HMW-GS are independent. Afterwards, the prediction of GI based on the two most highly correlated parameters, NF and PC, was conducted.
TABLE 3 Variables used for PCA
TABLE 4 Pattern matrix of PCA
FIGURE 3 Principal components loading plot for GI.
Reliability of Model
The parameters () were estimated with respect to the main criterion of minimizing the sum of squared residuals utilizing the Solver function of MS Excel®, which is ideally suited to fitting data with non-linear functions via an iterative algorithm. The final form of Eq. (1), taking into account the values of parameters, is:
TABLE 5 Parameter estimates
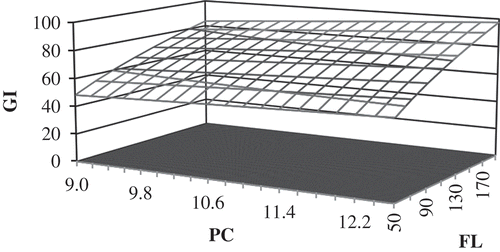
The standard experimental error σPE = 4.98 is smaller than the standard deviation between experimental and calculated values σLF = 6.29 and they are different by 26.3%. The F test (MSLF/MSPE) is equal to 1.60 < Fcrit(0.05,78,31) = 1.64 (P value equals 0.0724), which indicates that the difference is considered to be not quite statistically significant. Therefore, Eq. (2) is not missing or misspecified any significant terms and the regression model is satisfactory in predicting the GI value of flours with respect of NF and PC. illustrates the experimental values of PC versus the calculated values of PC. Most values lay near the diagonal, which indicates that the model fits in experimental data adequately. The effects of fertilization level and protein content on GI are show in . At low protein content levels, the increase in fertilization level resulted in a slight increase in gluten index value, while at high protein content levels, the increase in fertilization level resulted in a large increase in gluten index value.
FIGURE 4 Plot of GIexp versus GIcal.
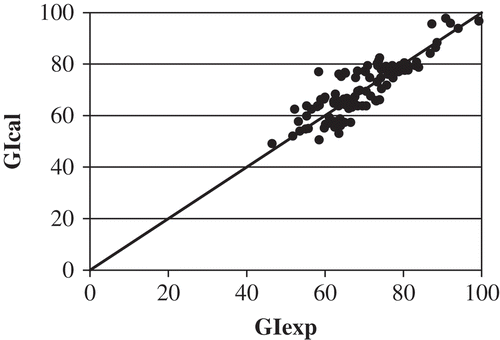
FIGURE 5 Response surface with contour plot showing the effect of NF and PC on the response of GI.
CONCLUSIONS
GI is an important index of gluten quality, and is suggested to be an indicator of the status of the protein and often used to specify its technological usefulness. A database was compiled and organized and presented including GI values of wheat gluten. A large number of variables were found to affect the value of GI, which resulted in the large spread of values of GI. A statistical model was constructed, including the fertilization level and protein content variables, which shows a strong relationship between them and GI. Finally, a generic model, which considers power law dependency of explanatory variables’ fertilization level and protein content, was established in order to predict the value of response variable GI. A more accurate model, which takes into consideration additional variables, such as the genotype of wheat, the presence of specific glutenin and gliadins subunits, etc., can be obtained in the future.
FUNDING
The authors wish to thank the State Scholarships Foundation (IKY) for its generous support.
REFERENCES
- Maroulis, Z.B.; Saravacos, G.D. Food Plant Economics; CRC Press: Boca Raton, FL, 2007.
- Edwards, N.M.; Mulvaney, S.J.; Scanlon, M.G.; Dexter, J.E. Role of gluten and its components in determining durum semolina dough viscoelastic properties. Cereal Chemistry 2003, 80 (6), 755–763.
- Saravacos, G.D.; Maroulis, Z.B. Transport Properties of Foods; Marcel Dekker: New York, USA, 2001.
- Ames, N.P.; Clarke, J.M.; Dexter, J.E.; Woods, S.M.; Selles, F.; Marchylo, B. Effects of nitrogen fertilizer on protein quantity and gluten strength parameters in durum wheat (Triticum turgidum L. var. durum) cultivars of variable gluten strength. Cereal Chemistry 2003, 80 (2), 203–211.
- Cubadda, R.; Carcea, M.; Pasqui, L.A. Suitability of the gluten index method for assessing gluten strength in durum wheat and semolina. Cereal Foods World 1992, 37 (12), 866–869.
- Edwards, N.M.; Gianibelli, M.C.; McCaig, T.N.; Clarke, J.M.; Ames, N.P.; Larroque, O.R.; Dexter, J.E. Relationships between dough strength, polymeric protein quantity and composition for diverse durum wheat genotypes. Journal of Cereal Science 2007, 45 (2), 140–149.
- Wang, C.; Kovacs, M.I.P. Swelling index of glutenin test. II. Application in prediction of dough properties and end-use quality. Cereal Chemistry 2002, 79 (2), 190–196.
- Williams, P.; Lindhauer, M.G.; Poms, R.E.; Wehling, R.L.; Bergthaller, W.; Gaines, C.S. The joint AACC International-ICC Methods Harmonization project. Cereal Foods World 2008, 53 (2), 99–102.
- Jarvan, M.; Edesi, L.; Adamson, A.; Lukme, L.; Akk, A. The effect of sulphur fertilization on yield, quality of protein and baking properties of winter wheat. Agronomy Research 2008, 6 (2), 459–469.
- Dobraszczyk, B.J.; Salmanowicz, B.P. Comparison of predictions of baking volume using large deformation rheological properties. Journal of Cereal Science 2008, 47 (2), 292–301.
- Borkowska, H.; Grundas, S. Changes of quality properties of spring wheat grain resulting from some agrotechnical factors. International Agrophysics 2007, 21, 117–121.
- Miś, A.; Grundas, S. Influence of wheat N-fertilization and grain moistening on the physical properties of wet gluten. International Agrophysics 2001, 15, 31–35.
- Borkowska, H.; Grundas, S.; Styk, B. Influence of nitrogen fertilization of winter wheat on its gluten quality. International Agrophysics 1999, 13, 333–335.
- Garrido-Lestache, E.; López-Bellido, R.J.; López-Bellido, L. Durum wheat quality under Mediterranean conditions as affected by N rate, timing and splitting, N form and S fertilization. European Journal of Agronomy 2005, 23 (3), 265–278.
- Garrido-Lestache, E.; López-Bellido, R.J.; López-Bellido, L. Effect of N rate, timing and splitting and N type on bread-making quality in hard red spring wheat under rainfed Mediterranean conditions. Field Crops Research 2004, 85 (2–3), 213–236.
- Gallant, R.A. Nonlinear Statistical Models; John Wiley & Sons: Hoboken, NJ, 1987.
- Bates, D.M.; Watts, D.G. Nonlinear Regression Analysis and Its Applications; John Wiley & Sons: New York, USA, 1988.
- Chung, O.K.; Seabourn, B.W. Effect of two growing years on gluten quality of hard winter wheats from two nurseries. In: Gluten Proteins 1990; Bushuk, W.; Tkachuk, R.; Eds.; AACC: St. Paul, MN, USA, 1991; 724–739.
- Jun, W.J.; Seib, P.A.; Chung, O.K. Characteristics of noodle flours from Japan. Cereal Chemistry 1998, 75 (6), 820–825.
- Ames, N.P.; Clarke, J.M.; Marchylo, B.A.; Dexter, J.E.; Woods, S.M. Effect of environment and genotype on durum wheat gluten strength and pasta viscoelasticity. Cereal Chemistry 1999, 76 (4), 582–586.
- Lu, W.; Grant, L.A. Role of flour fractions in breadmaking quality of frozen dough. Cereal Chemistry 1999, 76 (5), 663–667.
- Marconi, E.; Carcea, M.; Graziano, M.; Cubadda, R. Kernel properties and pasta-making quality of five European spelt wheat (Triticum spelta L.) cultivars. Cereal Chemistry 1999, 76 (1), 25–29.
- Ohm, J.B.; Chung, O.K. Relationships of free lipids with quality factors in hard winter wheat flours. Cereal Chemistry 2002, 79 (2), 274–278.
- Stehno, Z. Evaluation of durum wheat in the Czech gene bank: Quality parameters. Annual Report. CIHEAM, Paris, 2002; 173–176.
- Ames, N.P.; Clarke, J.M.; Marchylo, B.A.; Dexter, J.E.; Schlichting, L.M.; Woods, S.M. The effect of extra-strong gluten on quality parameters in durum wheat. Canadian Journal of Plant Science 2003, 83 (3), 525–532.
- Chung, O.K.; Ohm, J.B.; Lookhart, G.L.; Bruns, R.F. Quality characteristics of hard winter and spring wheats grown under an over-wintering condition. Journal of Cereal Science 2003, 37 (1), 91–99.
- Primo-Martin, C.; Valera, R.; Martinez-Anaya, M.A. Effect of pentosanase and oxidases on the characteristics of doughs and the glutenin macropolymer (GMP). Journal of Agricultural and Food Chemistry 2003, 51 (16), 4673–4679.
- Lerner, S.E.; Cogliatti, M.; Ponzio, N.R.; Seghezzo, M.L.; Molfese, E.R.; Rogers, W.J. Genetic variation for grain protein components and industrial quality of durum wheat cultivars sown in Argentina. Journal of Cereal Science 2004, 40 (2), 161–166.
- Vignaux, N.; Doehlert, D.C.; Hegstad, J.; Elias, E.M.; McMullen, M.S.; Grant, L.A.; Kianian, S.F. Grain quality characteristics and milling performance of full and partial waxy durum lines. Cereal Chemistry 2004, 81 (3), 377–383.
- Katerji, N.; Van Hoorn, J.W.; Fares, C.; Hamdy, A.; Mastrorilli, M.; Oweis, T. Salinity effect on grain quality of two durum wheat varieties differing in salt tolerance. Agricultural Water Management 2005, 75 (2), 85–91.
- Sissons, M.J.; Ames, N.P.; Hare, R.A.; Clarke, J.M. Relationship between glutenin subunit composition and gluten strength measurements in durum wheat. Journal of the Science of Food and Agriculture 2005, 85 (14), 2445–2452.
- De Vita, P.; Riefolo, C.; Codianni, P.; Cattivelli, L.; Fares, C. Agronomic and qualitative traits of T. turgidum ssp. dicoccum genotypes cultivated in Italy. Euphytica 2006, 150 (1–2), 195–205.
- Dvoracek, V.; Bradova, J.; Stehno, Z. Effect of 1B/1R translocation on selected grain quality parameters in a set of doubled haploid wheat lines. Czech Journal of Genetics and Plant Breeding 2006, 42 (2), 50–57.
- Gaines, C.S.; Fregea, R.J.; Vander Kant, C.; Morris, C.F. Comparison of methods for gluten strength assessment. Cereal Chemistry 2006, 83 (3), 284–286.
- Li, W.; Beta, T.; Sun, S.; Corke, H. Protein characteristics of Chinese black-grained wheat. Food Chemistry 2006, 98 (3), 463–472.
- Maghirang, E.B.; Lookhart, G.L.; Bean, S.R.; Pierce, R.O.; Xie, F.; Caley, M.S.; Wilson, J.D.; Seabourn, B.W.; Ram, M.S.; Park, O.K.; Dowell, F.E. Comparison of quality characteristics and breadmaking functionality of hard red winter and hard red spring wheat. Cereal Chemistry 2006, 83 (5), 520–528.
- Ounane, G.; Cuq, B.; Abecassis, J.; Yesli, A.; Ounane, S.M. Effects of physicochemical characteristics and lipid distribution in Algerian durum wheat semolinas on the technological quality of couscous. Cereal Chemistry 2006, 83 (4), 377–384.
- Varga, B.; Svečnjak, Z. The effect of late-season urea spraying on grain yield and quality of winter wheat cultivars under low and high basal nitrogen fertilization. Field Crops Research 2006, 96 (1), 125–132.
- Cubadda, R.; Carcea, M.; Marconi, E.; Trivisonno, M.C. Influence of protein content on durum wheat gluten strength determined by the SDS sedimentation test and by other methods. Cereal Foods World 2007, 52 (5), 273–277.
- Lijuan, S.; Guiying, Z.; Guoan, Z.; Zaigui, L. Effects of different milling methods on flour quality and performance in steamed breadmaking. Journal of Cereal Science 2007, 45 (1), 18–23.
- Qin, P.; Cheng, S.; Ma, C. Effect of waxy wheat flour blends on the quality of Chinese steamed bread. Agricultural Sciences in China 2007, 6 (10), 1275–1282.
- Rakszegi, M.; Pastori, G.; Jones, H.D.; Békés, F.; Butow, B.; Láng, L.; Bedő, Z.; Shewry, P.R. Technological quality of field grown transgenic lines of commercial wheat cultivars expressing the 1Ax1 HMW glutenin subunit gene. Journal of Cereal Science 2008, 47 (2), 310–321.
- Zielinski, H.; Ceglinska, A.; Michalska, A. Bioactive compounds in spelt bread. European Food Research and Technology 2008, 226 (3), 537–544.
- Cesevičienė, J.; Leistrumaitė, A.; Paplauskienė, V. Grain yield and quality of winter wheat varieties in organic agriculture. Agronomy Research 2009, 7 (I), 217–223.
- Pagnotta, M.A.; Mondini, L.; Codianni, P.; Fares, C. Agronomical, quality, and molecular characterization of twenty Italian emmer wheat (Triticum dicoccon) accessions. Genetic Resources and Crop Evolution 2009, 56 (3), 299–310.
- Ying, B.; Yunzi, F.; Zhuo, C.; Zaigui, L. Applicability of DATEM for Chinese steamed bread made from flours of different gluten qualities. Journal of the Science of Food and Agriculture 2009, 89 (2), 227–231.
- Flagella, Z.; Giuliani, M.M.; Giuzio, L.; Volpi, C.; Masci, S. Influence of water deficit on durum wheat storage protein composition and technological quality. European Journal of Agronomy 2010, 33 (3), 197–207.
- Pallant, J. SPSS Survival Manual; Open University Press: Maidenhead, England, 2007.