
Abstract
The grain of five spring spelt lines, three common wheat cultivars, and their hybrids were analyzed by Fourier transform infrared–attenuated total reflection spectroscopy. Variations in the log(absorbance) values in the range of 900–1200 cm−1 (carbohydrates), 1520–1550 cm−1 (amides II), 1637–1655 cm−1 (amides I), and 2850–2955 cm−1 (lipids) indicated that hybrids were more similar to common wheat than to spelt. Significant differences between common wheat and spelt were reported in the above wavenumber range. No such differences were noted between common wheat × spelt and spelt × common wheat hybrid groups. A classical discriminant analysis indicated that hybrids were more similar to common wheat than to spelt. Fourier transform infrared–attenuated total reflection emerges as a highly suitable tool for the identification of spelt grains intended for human consumption or further processing.
INTRODUCTION
Progressing gene erosion prompts plant breeders to search for new sources of genetic variation that can be used to develop new varieties. Common wheat (Triticum aestivum L.) is a strategic crop plant, characterized by high yield and high processing suitability, which contribute to the versatility of wheat grain.[Citation1] Despite this, modern intensively grown wheat cultivars have several weaknesses, such as low resistance to key stressors and decreasing suitability for the production of functional foods. Breeders, farmers, and consumers show a growing interest in Triticum species other than common wheat, and alternative wheats are increasingly often used as initial material in the production of recombinant wheat lines. A high degree of genetic similarity resulting from an identical number of chromosomes and significant chromosome homology supports the development of high-yielding and genetically stable hybrids between common wheat and spelt (Triticum spelta L.).[Citation2] The resulting hybrids may be characterized by high processing suitability; they may be used directly as precursors of new cultivars and source material for further crossbreeding.
Infrared spectroscopy creates new opportunities for exploring the phytochemical composition of plants,[Citation3] and it effectively contributes to taxonomic research.[Citation4] Most studies of the type rely on the near infrared (NIR) spectrum, which corresponds to radiation with the wavelength of 780–2500 nm. The above spectrum of electromagnetic radiation is widely applied due to the ease and speed of measurement. NIR spectroscopic results are comparable in accuracy to those of other analytical techniques; also, their precision is usually higher because there is no need for sample treatment.[Citation5] Spectroscopy is becoming a popular tool in analyses of biological materials with wavelengths of 2500–25,000 nm, which correspond to the mid-infrared spectrum (MIR). This type of radiation is weakly absorbed by water, and such analyses produce comprehensive spectra and high absorption coefficients, which facilitate the identification of substances at very low concentrations. In addition to high measurement speed, Fourier transform infrared spectroscopy (FTIR) delivers high sensitivity and resolution, which support reliable identification of various functional groups. The discussed technique is a simple and replicable method for analyzing small samples (in milligrams or micrograms) that do not require prior preparation.[Citation6] FTIR spectroscopy supports the development of green analytical chemistry.[Citation7] Cocchi et al.[Citation8] used this method to evaluate the processing suitability of flour, and Amir et al.[Citation9] demonstrated that it is a useful technique for discriminating wheat varieties. FTIR microspectroscopy is a supporting tool in anatomical and cytological studies of wheat.[Citation10,Citation11]
Fourier transform infrared–attenuated total reflection (FTIR-ATR) spectroscopy is widely applied in routine analyses of plant materials, including edible oils, essential oils, solvent extracts of various plant tissues,[Citation3] pollen grains,[Citation12] foodborne pathogenic bacteria,[Citation13] and plant roots.[Citation14] The discussed technique has been successfully used in analyses of corn seeds colonized by toxin-producing pathogens of the genus Fusarium.[Citation15,Citation16] The results of our previous work suggest that FTIR-ATR spectroscopy can be successfully applied to discriminate various species of the genus Triticum.[Citation17] The aim of this study was to discriminate the grain of wheat and spelt hybrids with the use of FTIR-ATR spectroscopy. This rapid and simple method for classifying genotypes into groups (hybrids or parental forms) could support selection of desirable recombinant inbreed lines with a very high phytochemical similarity to spelt.
MATERIALS AND METHODS
Field Experiment
The experimental material comprised the grain of F5 hybrids from single crosses between T. spelta × T. aestivum and T. aestivum × T. spelta and their parental forms: spring spelt breeding lines (denoted S10, S11, S12, S13, and S14), selected at the Department of Plant Breeding and Seed Production of the University of Warmia and Mazury in Olsztyn, Poland, and three cultivars of common wheat: Torka, Kontesa, and Zebra (). A total of 24 hybrids were investigated—five hybrids where Zebra was the parental form could not be obtained due to delayed flowering, and the Torka × S13 cross failed to produce any kernels. F5 hybrids were the fifth generation hybrids which, in comparison with the earlier generations, were more phenotypically uniform. Spelt lines were characterized by relatively high phenotypic variation. Torka and Zebra were characterized by the highest flour strength (both classified in the group of elite wheat cultivars—E), whereas Kontesa was a highly productive variety classified in quality group A.[Citation18] T. aestivum seeds were supplied by plant breeding stations where maintenance breeding is carried out.
TABLE 1 Hybrids and their parental forms analyzed in the study
The field experiment was established at the Experimental Station in Bałcyny near Ostróda (53° 36ʹ N Latitude; 19° 51ʹ E Longitude), Poland. Experimental material was sown in triplicate in single spikelets (spelt and hybrids) or grains (common wheat) and fertilized with N/P/K at a rate of 20/25/80 kg/ha in plots with an area of 6 mCitation2. Chemical plant protection was not applied. Single spikelets/grains were sown at 10 × 20 cm spacing.
FTIR-ATR Analysis
After harvesting at the over-ripe stage (BBCH 92),[Citation19] grain samples were milled using a laboratory mill (Cullati MFC, Zürich, Switzerland, mesh size of 1 mm) and analyzed in the Vector 22 FTIR (Bruker, Karlsruhe, Germany) spectrometer equipped with an MIR source. A horizontal ATR module (with an embedded diamond that guarantees three internal reflections, mounted directly on the ZnSe crystal, which acted as a focusing element) (SensIR-Technologies, USA) was mounted inside the spectrometer chamber. The ground sample was directly compressed against the surface of the diamond using a rotary pressure applicator with a slip clutch for reproducible pressure application. The applied detector was deuterated L-alanine doped triglycine sulfate (DLaTGS). Each sample (in three replications) was scanned 32 times within the applied wavenumber range (575–4500 cm−1) with the resolution of 2 cm−1.
Statistical Analysis
The results were processed statistically using STATISTICA 10[Citation20] and SYSTAT 11[Citation21] software. The ANOVA procedure was applied, and the significance of differences between mean values was estimated by the multiple Student Newman-Keuls test. The absorbance values (Abs.) were subjected to logarithmic transformation (log(Abs.)) to stabilize a baseline shift among spectra. The prepared data were analyzed using classical discrimination analysis whose results are presented in graphic form. The Savitzky–Golay smoothing filter was applied to calculate the first derivative for all spectra (one-sided width of the moving window was equal to eight points) and to develop spectral diagrams.[Citation22]
RESULTS AND DISCUSSION
The diagrams of the spectra characteristic of hybrids and their parental forms in the wavenumber range of 575–4500 cm−1 are presented in . In the vast majority of cases, the average absorbance values for hybrids represented the median values of their parental forms. However, the absorbance curves indicate that hybrids were more similar to common wheat than to spelt. Local maxima were clearly noted for wavenumbers in the ranges of 998–1011, 1545, 1643, and 2945 cm−1. The above wavenumber ranges corresponded to carbohydrates (900–1200 cm−1), amides II (1520–1550 cm−1), amides I (1637–1655 cm−1), and lipids (2850–2955 cm−1).[Citation23,Citation24] The average absorbance values for the above ranges, including the range corresponding to amides III, are presented in . In most cases, significant differences were noted between spelt versus common wheat and hybrids, whereas no such differences were observed between common wheat × spelt hybrids versus spelt × common wheat hybrids, or between hybrids (collectively) and common wheat. Significant differences between the examined forms were not reported in only two wavenumber ranges (2916.2–2923.9 cm−1 within the range corresponding to lipids and 898.8–983.6 cm−1 within the range corresponding to carbohydrates). Similar trends were observed for the first derivative of spectra (). Three local maxima were noted in the wavenumber range corresponding to carbohydrates (980, 1070, and 1144 cm−1), but the differences between hybrids, common wheat and spelt were statistically nonsignificant in this case (). Within the range corresponding to amides II, the average values of the first derivative were similar for hybrids and spelt and significantly lower for common wheat. An inverse relationship was reported for wavenumber ranges corresponding to amides I (1637.5–1676.0 cm−1) and lipids (2864.1–2872.6 cm−1) ().
TABLE 2 Average log(Abs.) values for the analyzed hybrids and parental forms in the wavenumber ranges corresponding to lipids, amides (I, II, and III), and saccharides; wavenumber ranges were divided based on significant differences between the tested genotype groups
FIGURE 1 FTIR-ATR spectra for the grain of hybrids and their parental forms. The ranges for lipids, amides I, II, and III, and carbohydrates follow Nauman et al.[Citation14] The results are expressed as log of absorbance values (log(Abs.)).
![FIGURE 1 FTIR-ATR spectra for the grain of hybrids and their parental forms. The ranges for lipids, amides I, II, and III, and carbohydrates follow Nauman et al.[Citation14] The results are expressed as log of absorbance values (log(Abs.)).](/cms/asset/80d2e805-9786-487d-a339-96ff6c9f66d7/ljfp_a_814665_f0001_oc.jpg)
FIGURE 2 First derivative of FTIR-ATR spectra for the grain of hybrids and their parental forms. The ranges for lipids, amides I, II, and III, and carbohydrates follow Nauman et al.[Citation14]
![FIGURE 2 First derivative of FTIR-ATR spectra for the grain of hybrids and their parental forms. The ranges for lipids, amides I, II, and III, and carbohydrates follow Nauman et al.[Citation14]](/cms/asset/97ecc6ab-8f3d-4830-8773-b3e8afc826c6/ljfp_a_814665_f0002_oc.jpg)
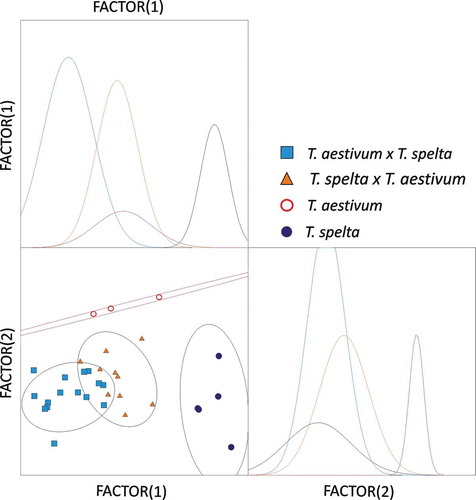
The results of a classical discriminant analysis of log(Abs.) values corresponding to all wavenumbers in the range of 575–4500 cm−1 point to strong discrimination between all of the studied forms (). The presence of greater similarity between hybrids and common wheat than that between hybrids and spelt was the most important finding of the analysis. It should be noted that the regions indicated by confidence ellipses, corresponding to spelt, hybrids, and common wheat, were completely separate.
FIGURE 3 Discriminant analysis of FTIR-ATR spectra (log(Abs.)) for wavenumber ranges 575–4500 cm−1. Confidence ellipses were plotted for a probability of 0.669.
Our results were largely consistent with the preliminary findings of a previous study investigating Triticum monococcum, T. dicoccum, and T. spelta.[Citation17] The discrimination of genetically distant species with different numbers of chromosomes is likely to be stronger than the discrimination of forms characterized by the same degree of ploidy. Significant genotypic similarity between spelt and common wheat contributes to the development of genetically stable hybrids for creative breeding purposes. The grain of spelt varieties, which did not originate from crosses between T. spelta and T. aestivum and which meets Swiss requirements for Urdinkel (primeval spelt), is in high demand not only on European markets (http://www.urdinkel.ch). The described technique supports rapid identification of such genotypes, which validates its usefulness for plant breeding. Due to its ability to effectively discriminate spelt, common wheat, and their hybrids, FTIR-ATR may be a highly suitable tool for the creative breeding of spelt.
FTIR-ATR spectroscopy is used primarily in chemical compound analyses, but when its results are combined with the findings of multidirectional analyses, this method can be deployed to assess the degree of genetic relatedness between various plants, including cereals. The results reported by Amir et al.,[Citation9] who studied four common wheat varieties, indicate that FTIR is a highly useful tool for classifying varieties based on differences in their processing suitability. The above authors observed significant, variety-specific differences in absorbance, in particular in the wavenumber ranges corresponding to proteins (amides I+II) and starch (below 800, 800–1500, 2800–3000, and 3000–3600 cm−1).
TABLE 3 Average values of the first derivates of absorbance spectra for the analyzed hybrids and parental forms in the wavenumber ranges corresponding to lipids, amides (I, II, and III), and saccharides; wavenumber ranges were divided based on significant differences between the tested genotype groups
CONCLUSIONS
Our results show that FTIR-ATR spectroscopy is a useful tool for classifying and discriminating the grain of wheat and spelt hybrids and their parental forms. In the future, the discussed method can support the identification of spelt varieties containing genes derived from common wheat. The absorbance patterns characteristic of hybrids and their parental forms clearly indicate that hybrids are more similar to common wheat than to spelt.
FUNDING
This research study was supported by the Polish Ministry of Science and Higher Education as part of the Iuventus Plus Research Program.
REFERENCES
- Wrigley, C.W. Wheat: A unique grain for the world. In: Wheat Chemistry and Technology; Khan, K.; Shewry, P.R.; Eds.; AACC International: St. Paul, MN, 2009; 1–17.
- Schmid, J.E.; Winzeler, H. Genetic studies of crosses between common wheat (Triticum aestivum L.) and spelt (Triticum spelta L.). Journal of Genetics and Breeding 1990, 44 (2), 75–80.
- Schulz, H.; Baranska, M. Identification and quantification of valuable plant substances by IR and Raman spectroscopy. Review. Vibrational Spectroscopy 2007, 43, 13–25.
- Nie, M.; Bao, K.; Xiao, M.; Chen, J.-M.; Luo, J.-L.; Zhang, W.-Q.; Chen, J.-K.; Li, B. Differentiation of Fusarium spp. by Fourier transform infrared (FT-IR) spectroscopy. Annals of Microbiology 2006, 56 (4), 399–401.
- Blanco, M.; Villarroya, I. NIR spectroscopy: A rapid-response analytical tool. Trends in Analytical Chemistry 2002, 21 (4), 240–250.
- Movasaghi, Z.; Rehman, S.; Rehman, I. Fourier transform infrared (FTIR) spectroscopy of biological tissues. Applied Spectroscopy Reviews 2008, 43, 134–179.
- Rohman, A.; Che Man, Y.B. Application of FTIR spectroscopy for monitoring the stabilities of selected vegetable oils during thermal oxidation. International Journal of Food Properties, 2013 (in press). DOI: 10.1080/10942912.2011.603874.
- Cocchi, M.; Foca, G.; Lucisano, M.; Marchetti, A.; Paean, M.A.; Tassi, L.; Ulrici, A. Classification of cereal flours by chemometric analysis of MIR spectra. Journal of Agricultural and Food Chemistry 2004, 52, 1062–1067.
- Amir, R.M.; Anjum, F.M.; Khan, M.I.; Khan, M.R.; Pasha, I.; Nadeem, M. Application of Fourier transform infrared (FTIR) spectroscopy for the identification of wheat varieties. Journal of Food Science and Technology 2011 (in press). DOI: 10.1007/s13197-011-0424-y.
- Barron, C.; Parker, M.L.; Mills, E.N.C.; Rouau, X.; Wilson, R.H. FT-IR imaging of wheat endosperm cell walls in situ reveals compositional and architectural heterogeneity related to grain hardness. Planta 2005, 220, 667–677.
- Barron, C.; Rouau, X. FTIR and Raman signatures of wheat grain peripheral tissues. Cereal Chemistry 2008, 85 (5), 619–625.
- Gottardini, E.; Rossi, S.; Cristofolini, F.; Benedetti, L. Use of Fourier transform infrared (FT-IR) spectroscopy as a tool for pollen identification. Aerobiologia 2007, 23, 211–219.
- Davis, R.; Mauer, L.J. Fourier transform infrared (FT-IR) spectroscopy: A rapid tool for detection and analysis of foodborne pathogenic bacteria. In: Current Research, Technology and Education Topics in Applied Microbiology and Microbial Biotechnology, Vol. 2; Mendez-Vilas, A.; Ed.; Formatex: Badajoz, Spain, 2010; 1582–1594.
- Naumann, A.; Heine, G.; Rauber, R. Efficient discrimination of oat and pea roots by cluster analysis of Fourier transform infrared (FTIR) spectra. Field Crops Research 2010, 119, 78–84.
- Kos, G.; Lohninger, H.; Krska, R. Fourier transform mid-infrared spectroscopy with attenuated total reflection (FT-IR/ATR) as a tool for the detection of Fusarium fungi on maize. Vibrational Spectroscopy 2002, 29, 115–119.
- Kos, G.; Lohninger, H.; Mizaikoff, B.; Krska, R. Optimisation of a sample preparation procedure for the screening of fungal infection and assessment of deoxynivalenol content in maize using mid-infrared attenuated total reflection spectroscopy. Food Additives and Contaminants 2007, 24 (7), 721–729.
- Suchowilska, E.; Kandler, W.; Wiwart, M.; Krska, R. Fourier transform infrared–attenuated total reflection for wheat grain. International Agrophysics 2012, 26, 207–210.
- List of Agriculture Cultivars; Centralny Ośrodek Badania Odmian Roślin Uprawnych w Słupi Wielkiej (Ed), Research Center for Cultivar Testing: Słupia Wielka, Poland, 2007.
- Witzenberger, A.; Hack, H.; van den Boom, T. Erläuterungen zum BBCH-Dezimal-Code für die Entwicklungsstadien des Getreides–mit Abbildungen. Gesunde Pflanzen 1989, 41, 384–388.
- StatSoft Inc. STATISTICA (data analysis software system), version 10. 2011. http://www.statsoft.com.
- Systat Software Inc. SYSTAT, version 11. 2004. http://www.systat.com/.
- TableCurve 2D. 2002. http://www.sigmaplot.com/.
- Kohler, A.; Afseth, K.N.; Jørgensen, K.; Randby, Å.; Martens, H. Quality analysis of milk by vibrational spectroscopy. In: Applications of Vibrational Spectroscopy in Food Science, Vol. 1, Instrumentation and Fundamental Applications; Li-Chan, E.; Chalmers, J.M.; Griffiths, P.R.; Eds.; John Wiley & Sons Ltd: Chichester, UK, 2010; 483–500.
- Maquelin, K.; Kirschner, C.; Choo-Smith, L.-P.; van den Braak, N.; Endtz, H.Ph.; Naumann, D.; Puppels, G.J. Identification of medically relevant microorganisms by vibrational spectroscopy. Journal of Microbiological Methods 2002, 51, 255–271.