
Abstract
Carbon dioxide treatment to reduce soluble tannins and astringency in persimmons is sometimes ineffective. Near-infrared spectroscopy was used to develop a predictive model for soluble tannin content and persimmon classification. A model using averaged spectra collected in the interactance mode showed better performance (correlation coefficient of prediction, rp = 0.95 and root mean square error of prediction, RMSEP = 0.17% w/w) than that from the transmittance mode (rp = 0.94 and RMSEP = 0.19% w/w). Models generated using spectra from the stem-end or middle plane flesh and whole fruit were comparable. Classification accuracy of 97.1% was achieved using stem-end flesh spectra. Therefore, near-infrared spectroscopy is a rapid and non-destructive technique with potential applications in the estimation of persimmon tannin content.
INTRODUCTION
There are two types of persimmon fruit: astringent and non-stringent persimmons.[Citation1] The astringent type is normally sweeter and juicier, whereas the non-astringent type is more crisp and cantaloupe-flavored. The astringent persimmon of the “Xichu” cultivar is mainly grown in Thailand[Citation2] because of its resistance to pests and insects, ability to adapt to the environment, economic value, and flavor, which is preferred by local consumers. When matured, however, the “Xichu” persimmon develops an astringent taste due to the presence of soluble tannins. Normally, a persimmon that contains 0.80–1.94% soluble tannin per fruit weight is judged as astringent by local consumers in Thailand.[Citation3] In Japan, a soluble tannin content of less than 0.1% is not considered to be astringent.[Citation4] Tannins are polyphenol compounds with a high molecular weight. Their large hydroxyl phenolic groups cause astringency. However, as the fruit ripens, the soluble tannins gradually change to insoluble tannins; this makes the fruit taste less astringent. Soluble tannins are transformed to insoluble tannins when acetaldehyde accumulates in the flesh in an airless state.[Citation5,Citation6] By the time the astringency is low enough to be palatable to the consumer, the fruit texture has become too soft. Therefore, harvested fully mature fruit are subjected to de-astringent treatment using carbon dioxide to eliminate the soluble tannins responsible for astringency.[Citation7,Citation8] Nevertheless, some persimmons may not fully respond to this treatment and thus still taste astringent. Therefore, evaluation of individual fruit for astringency and their classification is necessary.
Near-infrared (NIR) spectroscopy has been widely employed to detect the internal quality of fruit. Different modes of NIR spectroscopic measurements have been used to evaluate the internal properties of agricultural produce and products, including fruit. The most common mode is the diffuse reflectance, which acquires the reflected light in the vicinity of the illuminating point and is preferable for the measurement of intact fruit.[Citation9,Citation10] In the transmittance mode, the detector is installed opposite to the light source,[Citation11] and more internal information can be obtained due to greater penetration depth. However, for the measurement of intact fruit, a very high light intensity is needed, which can easily burn the sample surface and cause altered spectral properties. On the other hand, a much lower intensity of light can be utilized for liquid samples.[Citation12,Citation13] In the interactance mode, the light source and detector are installed parallel to each other, so as to prevent light caused by specular reflection from entering the detector. This configuration is carried out using an optical fiber.[Citation14]
Many researchers have used NIR spectroscopy for non-destructive quality analysis of persimmons. Ito et al.[Citation15] investigated astringency in the “Nisimura-wase” persimmon, a pollination-variant, non-astringent variety of persimmon. The half-cut persimmon fruits were analyzed using NIR reflection and the intact persimmon fruits were analyzed in transmittance mode. In the study, the tannin print method was used as the reference value. The classifying correctness was 89.40%. NIR spectrophotometry in the wavelength range 680–1235 nm was used to estimate the tannin content determined by the Folin-Denis method in intact de-astringent persimmons with a correlation coefficient of 0.852, a standard error of calibration of 0.491% and a standard error of prediction equal to 0.518%.[Citation16] Mowat and Poole[Citation17] successfully classified persimmon into the varieties “Fuyu” and “Matsumoto Wase Fuyu” based on different maturity characteristics induced by the application of phytohormones using visible-NIR reflectance spectrophotometry. However, no studies have compared the performance of the transmittance and interactance modes in the evaluation of tannin content.
Delayed light emission (DLE) was also reported as another non-destructive method for the quality analysis of persimmons. Forbus et al.[Citation18] studied the maturity of persimmon fruit using DLE. They found highly linear and negative correlations between DLE and maturity for both astringent and non-astringent Japanese persimmon cultivars.
Knowledge of the physiological differences inside the fruit is useful in the development and optimization of models using NIR spectroscopy. For instance, in the detection of brown heart in pear, diffuse reflectance and transmittance of visible-NIR spectroscopy were compared.[Citation19] As brown heart occurred around the core, transmission mode, which contained the spectral information of both the surface layer and inner flesh tissues, was more suitable than diffuse reflectance. Fan et al.[Citation20] showed that for transmittance irradiation, the size, shape, and variation in the internal structure had an effect on the NIR spectra. As a result, sample orientation became a significant factor in developing an optimal model. They found that the transmission spectra were best obtained when the axis of the core was vertical to the light irradiation. In mangosteens, translucent flesh is known to mostly occur in the largest flesh segment inside the fruit.[Citation21] The optimal model based on NIR transmittance was developed using spectral information obtained from the fruit position that revealed the largest flesh segment.
There have been no reports on the effect of the measurement position in the assessment of the astringency and tannin content in persimmon using NIR spectroscopy. Thus, the objective of this study was to assess the influence of measurement position on the tannin content and astringency using NIR spectroscopy (i.e., transmittance and interactance modes). Optimal models for the prediction of tannin content and the classification of astringent fruit distinct from astringent-free fruit were also investigated.
MATERIALS AND METHODS
Samples
Persimmons of the “Xichu” variety were harvested at 150 days after anthesis from the Royal Inthanon Agricultural Research Station, Chiang Mai Thailand. A total of 210 fruit were collected, 105 from both the July and October harvests. The persimmons were transported in a temperature-controlled truck to the laboratory where they were kept at 25°C overnight to attain temperature equilibrium prior to taking measurements. To generate variation in the soluble tannin content among the samples, the fruit were divided equally into three groups. The first two groups were subjected to two de-astringent treatments. These groups were put into plastic bags filled with 80% carbon dioxide, where they were kept for two days at temperatures of 25 and 15°C, respectively. The treatment caused the transformation of the soluble tannin into insoluble tannin, and thus created variation in the soluble tannin content among groups of samples. The remaining group was kept under an ambient environment at a controlled temperature of 25°C for 2 days. This was the control. After treatment, three fruits were found to be damaged due to undetected pre-harvest conditions, and thus were removed from the study.
Spectral Acquisition
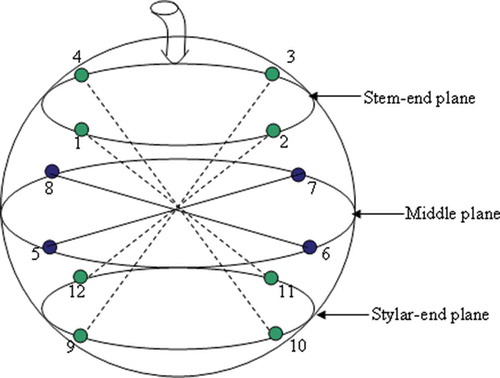
Each individual fruit was scanned in the transmittance and interactance modes of measurement in 12 positions, originating from 3 horizontal planes, each with 4 equally spaced origins, passing through the center of the stem-calyx axis, as shown in . Both measurement modes were compared for the effective evaluation of soluble tannin content, and the most accurate mode was utilized for the astringency classification.
FIGURE 1 Illustration of the planes of measurements showing 4 positions on each plane.
Transmittance measurement
A NIR spectrophotometer (PureSpect, HOS-200, SAIKA Technological Institute Foundation, Japan) was used to acquire the transmitted light in the range 660–960 nm with a spectral resolution of 1 nm. A light source (100 W tungsten halogen) was directed through an optical fiber and set at a distance of 11 cm above the fruit surface. The integration time was optimized to 200 ms with a spectral average count of 4. The transmitted light was collected through an optical fiber from the bottom of the fruit at each position (). A Teflon sphere was employed as a reference for each set of ten fruits. Due to noise at both ends of the spectral range, the wavelength range was shortened to 678–943 nm for further analysis. This process took approximately four min for each fruit.
FIGURE 2 Measurement of persimmon fruit in the (a) transmittance mode and (b) interactance mode at 3 common orientations, showing opposite points of measurement corresponding to the numbers assigned in Figure 1.
Interactance measurement
Scanning was carried out using a portable spectrophotometer (FQA-NIR GUN, FANTEC Research Institute, Kosai, Japan) in the range 600–1100 nm with a resolution of 2 nm (). An integration time of 30 ms was set for optimal absorbance. After every ten fruits, a Teflon disc was scanned as a reference. However, to remove the noise at the lower and higher frequencies of each spectrum, the spectral range was reduced to 700–1050 nm. This process took approximately six min for each fruit.
Assessment of Tannin Content
A set of 6 cylindrical specimens of flesh, each 10.7 mm in diameter, was removed from each fruit, with a corer, in radial directions between 2 opposite measurement positions (). Both ends of each cylindrical flesh sample and the middle part of the first cylinder (12 terminal parts and 1 middle part) were used for assessment of the soluble tannin content (% w/w on a flesh weight basis), by using the Folin-Denis test adjusted by Gu et al.[Citation22] Therefore, from each fruit, 1 sample of from the middle and 12 samples from near the surface were obtained. The measurement of the 65 samples of flesh from 5 fruits took about 8 h. Subsequent samples waiting for the analysis were stored at –30°C. An average of the tannin content of each fruit was used to calculate a z-score and samples with a score higher or lower than 3 and –3, respectively, were considered to be outliers[Citation23] and were removed from the samples for analysis. Two outliers were detected and removed.
FIGURE 3 Cylindrical specimens from each fruit for tannin content determination. The numbers on each specimen correspond with those assigned in Figure 1.
Statistical Analyses
Quantitative analysis for prediction of tannin content
After the removal of the damaged and outlier fruits, the number of samples was reduced to 205. Persimmon samples were divided into a calibration set (n = 137; 67% of the whole sample set) and a prediction set (n = 68). Both sets showed uniform distribution and near identical variations in the soluble tannin content (). The lower part of shows the calibration and prediction sets that were assigned based on the measurement position for the development of the individual-spectra model. Partial least squares regression (PLSR) models[Citation11] were developed to predict the soluble tannin content using multivariate data analysis software (The Unscrambler v.9.8; Camo, Oslo, Norway). The calibration set was employed in developing the model as well as in the determination of the optimal number of PLSR factors, which resulted in the lowest standard error of cross validation, using a full cross validation procedure. PLSR models based on the transmittance and interactance modes were compared using the individual spectra obtained from each measurement position and averaged spectra. The performance of the models in terms of the correlation coefficient of prediction (rp) and the root mean square error of prediction (RMSEP) was validated in the prediction set by comparing the predicted values against the measured values. A further statistic, RPD,[Citation11] was also used for model comparison and expressed as SD/RMSEP, where SD is the standard deviation of the prediction set. The RPD was used to indicate the relative predictive performance of a model.
TABLE 1 Summary statistics of percentage of soluble tannin content in the calibration and prediction sets determined based on the averaged value in the whole fruit and individual values at each position of measurement
TABLE 2 Variation of soluble tannin content in persimmons treated with CO2: comparison of the flesh near the skin and at the core
Different pre-treatment methods were examined to decrease the scattering effect. The methods included smoothing, first and second derivatives, multiplicative scatter correction (MSC), and standard normal variate (SNV),[Citation11] which were used both individually and in combination. The pre-treatment that led to the best prediction result of the PLSR model in terms of the highest RPD was selected. The PLSR models were also developed to investigate the physiological effect, with respect to the internal distribution of the soluble tannin content, on prediction performance. Initially, a whole fruit model was created using all 12 spectral measurements. Three other simplified models were developed using averaged spectral information obtained from four positions in the top plane (stem end), the middle plane, and the bottom plane (stylar end) perpendicular to the stem-calyx axis. It was noted that the tannin content for the middle plane did not include the flesh at the core. Two modes of measurement (interactance and transmittance) were also investigated to compare the accuracy of prediction.
Classification model
A persimmon is considered to be astringent when the soluble tannin content is equal to or greater than 0.8%.[Citation3] Depending on the tannin content, samples from the control group and the 2 treated groups, which had tannin content lower than 0.8%, were classified in the normal group, whereas samples with tannin content equal to or higher than 0.8% were classified in the astringent group. As a result, 135 normal samples and 70 astringent samples were used for the analysis. The normal and astringent samples were then assigned to a calibration set and a prediction set, based on the uniform distribution of soluble tannin content between the sets. In total, 137 samples were assigned to the calibration set (90 normal samples and 47 astringent samples), and the remaining 68 samples were used for the prediction set (45 normal samples and 23 astringent samples). The optimal spectra resulting from quantitative analysis were used for qualitative analysis to evaluate their practical use in further applications. A model for classification was created by performing partial least squares discriminant analysis (PLSDA) using the calibration set. The classification models developed were cross-validated for an optimum number of factors using PLSR (The Unscrambler v.9.8; Camo, Oslo, Norway), with a value of zero for normal samples and one for astringent samples. The classification correctness of the model was evaluated using the prediction set.
RESULTS AND DISCUSSION
Internal Distribution of Tannin Content
Analysis of variance based on a randomized complete blocked design was performed to test the effect of each treatment on the tannin content. Each harvest was assigned as a block in the analysis. shows the effect of carbon dioxide treatment on the reduction of soluble tannin content. Initial results showed that the mean values of the tannin content at the two harvest times (block) did not differ significantly. Therefore, all samples were re-analyzed using a completely randomized design. Persimmons treated with CO2 at all temperatures had a significantly lower soluble tannin content to an acceptable level for de-astringent fruit compared to the untreated fruit. Persimmons subjected to CO2 treatment at both temperatures had no significant difference in tannin content. However, this investigation did not focus on the effect of temperature, but rather concentrated on creating variation in the soluble tannin content in the samples for further analysis.
Understanding the internal distribution of the soluble tannin content in the fruit is important for the successful development of NIR spectroscopy. From , it was evident that in untreated fruit, soluble tannin accumulated more in the flesh beneath the skin (1.21%) than in the core (0.29%). After all treatments, the soluble tannin content in the core was reduced to values that were indicative of non-astringency (less than 0.8%). The flesh near the core still had a lower soluble tannin content than that near the skin after treatment, especially at 25°C.
Variation in the soluble tannin content of the flesh near the skin from the stem end to the stylar end was also examined. A persimmon fruit normally grows from the stylar end toward the stem,[Citation24] so that the stylar-end flesh is generally riper than the stem-end flesh. shows the average values of the soluble tannin content on three planes perpendicular to the stem-calyx axis. For untreated fruit (astringent persimmon), the flesh on the plane close to the stylar end had significantly lower tannin content than that on the planes at the middle section and next to the stem (). After treatment, the soluble tannin content was reduced, yet the content in the bottom plane remained significantly different from that in the stem and middle plane. Overall, the stem-end flesh contained higher soluble tannin content than other parts of the fruit. Additionally, a larger difference in the soluble tannin content in the stem-end flesh was noted between astringent fruit (1.26%) and de-astringent fruit (0.10%) compared to the stylar-end flesh.
TABLE 3 Variation of soluble tannin content in astringent and de-astringent persimmons with respect to planes of measurement perpendicular to the stem-calyx axis
Spectral Characteristics
De-astringent persimmon fruit with a soluble tannin content less than 0.8% appeared to absorb less light regardless of the mode of measurement (). Soluble tannin appeared in the form of an insoluble polymer when transformed to insoluble tannin by reaction with accumulated acetaldehyde under CO2 gas treatment.[Citation6,Citation25] De-astringent persimmons contained tannin mostly in an insoluble form, and this probably resulted in more variation in the refractive indices of the interfaces in the flesh, leading to higher scattering characteristics. The flesh near the skin responded effectively to the de-astringent treatment and was full of insoluble tannin. Therefore, in the interactance mode (), the flesh of the de-astringent fruit scattered more light, which could be attributed to higher reflectance or lower absorbance compared to the flesh of astringent fruit. Further visual inspection of the interactance spectra revealed negative absorbance over a short wavelength range. The light intensity at the short wavelength range reflected from the reference was always lower than that from the sample, which gave rise to negative absorbance. The negative NIR absorbance over the short wavelength region (710–830 nm) of transmittance was also reported for non-astringent persimmons.[Citation15]
FIGURE 4 Average absorbance spectra of astringent and de-astringent persimmons (205 fruits) measured in the (a) transmittance mode and (b) interactance mode, and the corresponding second derivative spectra in the (c) transmittance mode and (d) interactance mode.
As previously discussed, for astringent fruit, the flesh in the core had a lower soluble tannin content (0.29%; ) than the flesh near the skin (1.21%). On the other hand, a small variation in the soluble tannin content was found in de-astringent fruit (0.03 to 0.10%). Therefore, using transmission mode (), greater homogeneity of the soluble tannin content in the whole fruit allowed more light to penetrate the de-astringent persimmon than the astringent fruit due to lower scattering, leading to higher transmitted light and low absorbance. Although the flesh near the skin reflected more light in the de-astringent fruit, as previously discussed, in transmission mode, samples were irradiated with a higher power than in the interactance mode. Therefore, it could be argued that a greater amount of light was able to penetrate the de-astringent fruit than was reflected by the flesh near the skin at the entrance. In addition, fruit under de-astringent treatment may differ in firmness from untreated fruit. This texture difference may also cause differences in scattering.
The spectral differences were not observable from the original absorbance spectra acquired either in the transmittance mode () or in the interactance mode (), except for the difference due to scattering as discussed. Therefore, the spectral features were enhanced by using a second derivative algorithm. For transmittance mode, the spectral difference appeared at various intervals along the second derivative spectra (). In the interactance mode (), the differences were observed only at both ends of the second derivative spectra (700–740 and 990–1050 nm). The results proved that NIR spectroscopy is a suitable technique to detect the spectral differences related to chemical differences in the tannin content.
TABLE 4 Statistics of the partial least squares regression models based on whole fruit spectra for the prediction of the soluble tannin content of the samples in the prediction set
Assessment of Soluble Tannin Content by Using a PLSR Model
Whole fruit assessment
For comparison between the modes of spectral acquisition, PLSR models were developed using average spectra and individual spectra obtained from 12 scans of each sample. The most accurate model assessed was based on the interactance measurement and average spectra. This model performed better than the models using transmitted spectra (), producing values of rp = 0.95, RMSEP = 0.17%, and RPD = 3.25. The scatter plots displaying the relationship between the actual soluble tannin content and the predicted soluble tannin content are shown in . It was noticed that samples in the analyses were discontinuous and clustered into two groups with low and high values of tannin content. This implied that the model may not be accurate in predicting the tannin content between 0.55 and 0.75% w/w. A similar discontinuity of samples was also reported[Citation26] in the prediction of the acidity of bayberry juice, with rp = 0.94 and RMSEP = 0.145%. Additionally, the average spectra models showed better performance than the individual spectra models irrespective of the mode of measurement. The results were in partial agreement with those reported by Khuriyati et al.,[Citation27] who obtained a highly efficient and stable calibration model for dry matter evaluation of intact tomatoes by using 6-position averaged spectra.
FIGURE 5 Prediction plot of the percentage of tannin determined from the averaged spectra from 12 positions on each fruit of the prediction set in the interactance mode (rp: coefficient of correlation and RMSEP: root mean square error of prediction).
The results with respect to the comparison between the measurement modes differed from those reported by Fu et al.,[Citation19] who observed that in the detection of brown heart symptoms in pears, transmission mode offered better performance than reflectance mode. In the case of pears, brown heart symptoms occurred mainly around the core of the fruit, and thus transmitted light provided more information on brown heart than did reflected light. Considering “Xichu” persimmon fruit from the physiological point of view, a larger variation in the soluble tannin content was found in the flesh close to the skin (0.07 to 1.21%; ) than at the core (0.03 to 0.29%). This suggests that using transmitted light is less suitable for assessing the soluble tannin content from whole persimmon fruit than reflected light is. Furthermore, locules might be present around the core and may have the effect of scattering transmitted light.
In the search for effective wavelengths for modeling, and wavelengths related to the absorbance of tannin, the regression coefficients of the best interactance model were explored as shown in . A high complexity of the regression coefficients was evident over the spectral range. Whereas a complete interpretation of these wavelengths with regard to the constituents may not be possible, some can be assigned from the NIR spectra of tannic acid powder, although astringency is related to many phenolic compounds. The second derivative spectrum of tannic acid in powder as measured by the diffuse reflectance method in the range 700–1050 nm using a NIR spectrophotometer, (The Unity Scientific SpectraStar 2500, LLC., USA) is shown in . A strong absorption peak for tannic acid powder can be observed at 996 nm, which was similarly reported by Takahashi et al.[Citation28] The negative peak at 995 nm in the regression coefficient plot () closely coincides with the absorption peak at 996 nm in the tannic acid spectrum. To verify the absorption peak of tannin, the high tannin spectrum was subtracted from the low tannin spectrum to create a difference spectrum. The second derivative of the different spectrum () also showed an absorption peak at 996 nm.
TABLE 5 Statistical data of partial least squares models obtained using averaged spectra measured in the interactance mode at each plane along the stem-calyx axis for the prediction of the soluble tannin content of the samples in the prediction set
The peak around 760 nm was attributed to the third overtone of the OH stretch of water.[Citation29] A benzene structure was observed at around 840–874 nm. Absorbance at 981 nm was probably due to the second OH overtone in phenols, which occurs in the region 945–985 nm. Other peaks with high regression coefficients, which could not be assigned, may represent interactions of other constituents with major constituents contributing to tannin.[Citation30]
Optimal plane of measurement for PLSR model
The interactance model based on the whole fruit spectra may not be easily implemented in sorting practice, as each fruit in this study was measured 12 times. A simplified model was thus explored by considering the physiological variation in the soluble tannin content within the whole fruit. Accordingly, three models were created to correspond with three planes of four measurements representing the difference in samples along the stem-calyx axis. Each plane was perpendicular to the stem-calyx axis. To determine the optimal plane of measurement, each PLSR model was compared for the best prediction performance.
It was found that the model based on the measurement on the plane close to the stem provided the best performance compared with the other planes with values of rp = 0.93, RMSEP = 0.22%, and RPD = 2.68 (; subjected to pre-treatments with Savitzky-Golay with 3–point smoothing and the second derivative). Under de-astringent treatment with carbon dioxide, a part of the flesh on the plane close to the stem, which physiologically contains higher amounts of soluble tannin, might not respond fully to the treatment. Therefore, high amounts of soluble tannin could still be found in some persimmons while others had diminished amounts of soluble tannin. This provided more variation in the soluble tannin content between fruit samples than was acceptable for a robust model.[Citation31] shows that there was a higher difference in the soluble tannin content between the astringent persimmons and de-astringent persimmons at the stem end than at the stylar end. In addition, the flesh adjacent to the stem was normally found to be more astringent than other parts of the flesh within the fruit. The middle plane model also provided a similar performance to the stem-end plane model for the same reason. Thus, the whole fruit model could be simplified using the stem-end model or the middle plane model, with comparable performances, both suitable for practical use.
Classification of Astringent Persimmons
The scatter plot in shows a bimodal distribution in the tannin content that suggested that the sample structure was suitable for binary prediction or two-group classification. The RPD values of 2.68 and 2.55 obtained from the stem plane and the middle plane models, respectively, were higher than the critical value of 2.5 that allowed the model to be used for sorting into 2 grades.[Citation32] For qualitative analysis, a PLSDA model was also created using the stem-plane spectra obtained in the interactance mode to evaluate classification performance. The classification results are displayed in . The classification accuracy was 97.8% (44 samples from a total of 45 samples) for the de-astringent group, which was slightly better than for the astringent group with an accuracy of 95.7% (22 samples out of 23 samples). The overall accuracy was 97.1%, which was acceptable. The PLSDA model required four latent variables to capture most of the variation in the spectra for classification. The score plots in present clusters of samples based on three latent variables, which showed a clear separation between the de-astringent and astringent groups of the persimmon fruit.
TABLE 6 Results of the partial least squares discriminant analysis of the accuracy of classification into astringent or de-astringent fruit based on the interactance model by using averaged spectra from the stem-end plane of the samples in the prediction set
The above classification was based on the average spectra, which implied that correctly classified fruit may still have an astringent flavor. Therefore, further analysis was performed using a classification model developed using individual spectra (corresponding to each position of measurement) obtained from the stem plane. With this model, the correctly classified fruit would be free of an astringent taste. However, the individual spectra model was less accurate in total classification (87.2%) than the average spectra model. As the classifying model based on individual spectra was useful for the classification of astringent-free fruit, further studies on wavelength selection should be performed to improve the accuracy of the model. These state-of-the-art approaches include an independent component analysis or the least squares-support vector machine, which was reported to be successful.[Citation33] In addition, a more robust model could be developed by incorporating more samples from other seasons in the calibration set.
CONCLUSIONS
PLSR models were developed to evaluate the tannin content and astringency in “Xichu” persimmons. The NIR spectra obtained in the interactance mode provided more useful information for the evaluation of the soluble tannin content in persimmons than did spectra obtained from transmission mode. In addition, the model developed using averaged spectra performed better in the prediction of tannin content irrespective of the measurement mode. Regarding the influence of the measurement position, the model generated using the average spectra obtained from the stem-end or the middle plane flesh produced results comparable to those obtained from the average spectra measured from the whole fruit. Taking the physiological distribution of the soluble tannin content into consideration, NIR interactance spectroscopy was shown to be optimal for the prediction of soluble tannin content. Moreover, spectral measurements on the flesh around the stem were also shown to be useful in the classification (97.1% correct).
ACKNOWLEDGMENTS
The technical assistance kindly provided by the Agricultural and Agro-Industrial Product Improvement Institute was much appreciated. The Center of Advanced Studies in Industrial Technology, Faculty of Engineering, and Center of Excellence on Food Agricultural Machinery (Kasetsart University) are also acknowledged for their support.
FUNDING
The authors gratefully acknowledge the Thailand Research Fund through the Royal Golden Jubilee Ph.D. Program (Grant No. PHD/0190/2552) and the Royal Project Foundation for their financial support of this research.
REFERENCES
- Mortensen, E.; Bullard, E.T. Handbook of Tropical and Sub-tropical Horticulture, Department of State Agency for International Development, 1964; 260.
- Krisanapook, K.; Subhadrabandhu, S.; Saleeto, S.; Niraparth, S.; Sirisuk, S. Effects of some growth regulators on growth of persimmon fruits cvs. Xichu and Fuyu. Acta Horticulturae 1997, 436, 261–266.
- Noppakhunwong, U.; Mansalung, P. Cultivars and characteristic of cultivars, In: Technical document No.19 Persimmon and Plum; Department of Agriculture. Ministry of Agriculture and Cooperatives, Ed.; The Agricultural Co-operative Federation of Thailand, Limited: Bangkok, 1997; 11–18.
- Inari, T.; Tomoyeda, M. Consideration on the removal of astringency in the persimmons (Part 2). Insolubility of tannins and changes of the realted enzyme activities. Journal of Home Economics of Japan 1992, 43 (4), 271–276.
- Khademi, O.; Mostofi, Y.; Zamani, Z.; Fatahi, R. The effect of deastringency treatments on increasing the marketability of persimmon fruit. Acta Horticulturae 2010, 877, 687–691.
- Taira, S.; Itamura, H.; Abe, K.; Watanabe, S. Comparison of the characteristics of removal of astringency in two Japanese persimmon cultivars, “Denkuro” and “Hiratanenashi.” Journal of the Japanese Society for Horticultural Science 1989, 58, 319–325.
- Matsuo, T.; Ito, S. On mechanisms of removing astringency in persimmon fruits by carbon dioxide treatment I. Some properties of the two processes in the de-astringency. Plant and Cell Physiology 1977, 18 (1), 17–25.
- Vidrih, R.; Simcic, M.; Hribar, J.; Plestenjak, A. Astringency removal by high CO2 treatment in persimmon fruit (Diospyros kaki). Acta Horticulturae 1994, 368, 652–666.
- Shao, Y.; He, Y.; Bao, Y.; Mao, J. Near-infrared spectroscopy for classification of oranges and prediction of the sugar content. International Journal of Food Properties 2009, 12 (3), 644–658.
- He, Y.; Li, X.; Shao, Y. Fast discrimination of apple varieties using vis/nir spectroscopy. International Journal of Food Properties 2007, 10 (1), 9–18.
- Nicolaï, B.M.; Beullens, K.; Bobelyn, E.; Peirs, A.; Saeys, W.; Theron, K.I.; Lammertyn, J. Non-destructive measurement of fruit and vegetable quality by means of NIR spectroscopy: A review. Postharvest Biology and Technology 2007, 46 (2), 99–118.
- Shen, F.; Ying, Y.; Li, B.; Zheng, Y.; Liu, X. Discrimination of blended Chinese rice wine ages based on near-infrared spectroscopy. International Journal of Food Properties 2012, 15 (6), 1262–1275.
- Liu, F.; Yusuf, B.L.; Zhong, J.; Feng, L.; He, Y.; Wang, L. Variety identification of rice vinegars using visible and near infrared spectroscopy and multivariate calibrations. International Journal of Food Properties 2011, 14 (6), 1264–1276.
- Liu, Y.; Ying, Y. Non-invasive method for internal quality evaluation of pear fruit using fiber-optic FT-NIR spectrometry. International Journal of Food Properties 2007, 10 (4), 877–886.
- Ito, S.; Ootake, Y.; Kito, I. Classification of astringency in pollination variant non-astringent persimmon fruits cv. “Nisimura-wase” by near infrared spectroscopy. Research Bulletin of the Aichi-ken Agricultural Research Center 1997, 29, 213–218.
- Okazaki, A.; Yoshimatsu, K. Non-destructive measurement of quality of persimmon and musk melon by NIR spectoroscopy. Bulletin of the Yamaguchi Agricultural Experiment Station 1994, 45, 23–29.
- Mowat, A.D.; Poole, P.R. Non-destructive discrimination of persimmon fruit quality using visible-near infrared reflectance spectrophotometry. Acta Horticulturae 1997, 436, 159–163.
- Forbus, W.R.J.; Payne, J.A.; Senter, S.D. Non-destructive evaluation of Japanese persimmon maturity by delayed light emission. Journal of Food Science 1991, 56 (4), 985–988.
- Fu, X.; Ying, Y.; Lu, H.; Xu, H. Comparison of diffuse reflectance and transmission mode of visible-near infrared spectroscopy for detecting brown heart of pear. Journal of Food Engineering 2007, 83 (3), 317–323.
- Fan, G.; Zha, J.; Du, R.; Gao, L. Determination of soluble solids and firmness of apples by Vis/NIR transmittance. Journal of Food Engineering 2009, 93 (4), 416–420.
- Terdwongworakul, A.; Nakawajana, N.; Teerachaichayut, S.; Janhiran, A. Determination of translucent content in mangosteen by means of near-infrared transmittance. Journal of Food Engineering 2012, 109 (1), 114–119.
- Gu, H.F.; Li, C.M.; Xu, Y.J.; Hu, W.F.; Chen, M.H.; Wan, Q.H. Structural features and antioxidant activity of tannin from persimmon pulp. Food Research International 2008, 41 (2), 208–217.
- Larose, D.T. Discovering knowledge in data: An introduction to data mining; John Wiley & Sons. USA, 2005; 241.
- Park, Y.M.; Lee, Y.J. Induction of modified atmosphere-related browning disorders in “Fuyu” persimmon fruit. Postharvest Biology and Technology 2008, 47 (3), 346–352.
- Matsuo, T.; Ito, S. A model experiment for de-astringency of persimmon fruit with high carbon dioxide treatment: In vitro gelation of kaki-tannin by reacting with acetaldehyde. Agricultural and Biological Chemistry 1982, 46, 683–689.
- Shao, Y.; He, Y.; Bao, Y. A new approach to predict acidity of bayberry juice by using vis/vear infrared spectroscopy. International Journal of Food Properties 2007, 10 (3), 631–638.
- Khuriyati, N.; Matsuoka, T.; Kawano, S. Precise near infrared spectral acquisition of intact tomatoes in interactance mode. Journal of Near Infrared Spectroscopy 2004, 12, 391–395.
- Takahashi, A.; Shimada, T.; Kawano, S. Non-destructive determination of tannin content in intact individual acorns by near-infrared spectroscopy. Ecological Research 2011, 26 (3), 679–685.
- Osborne, B.G.; Fearn, T.; Hindle, P.H. Practical NIR Spectroscopy with Applications in Food and Beverage Analysis. Longman Science & Technology. U.S.A., 1993; 225.
- Wang, D.; Dowell, F.E.; Lacey, R.E. Single wheat kernel color classification by using near-infrared reflectance spectra. Cereal Chemistry 1999, 76, 30–33.
- McGlone, V.A.; Kawano, S. Firmness, dry-matter, and soluble solids assessment of postharvest kiwifruit by NIR spectroscopy. Postharvest Biology and Technology 1998, 13, 131–141.
- Golic, M.; Walsh, K.B. Robustness of calibration models based on near-infrared spectroscopy for the in-line grading of stonefruit for total soluble solids content. Analytica Chimica Acta 2006, 555, 286–291.
- Liu, F.; He, Y.; Wang, L. Determination of effective wavelengths for discrimination of fruit vinegars using near-infrared spectroscopy and multivariate analysis. Analytica Chimica Acta 2008, 615 (1), 10–17.